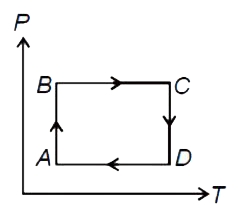
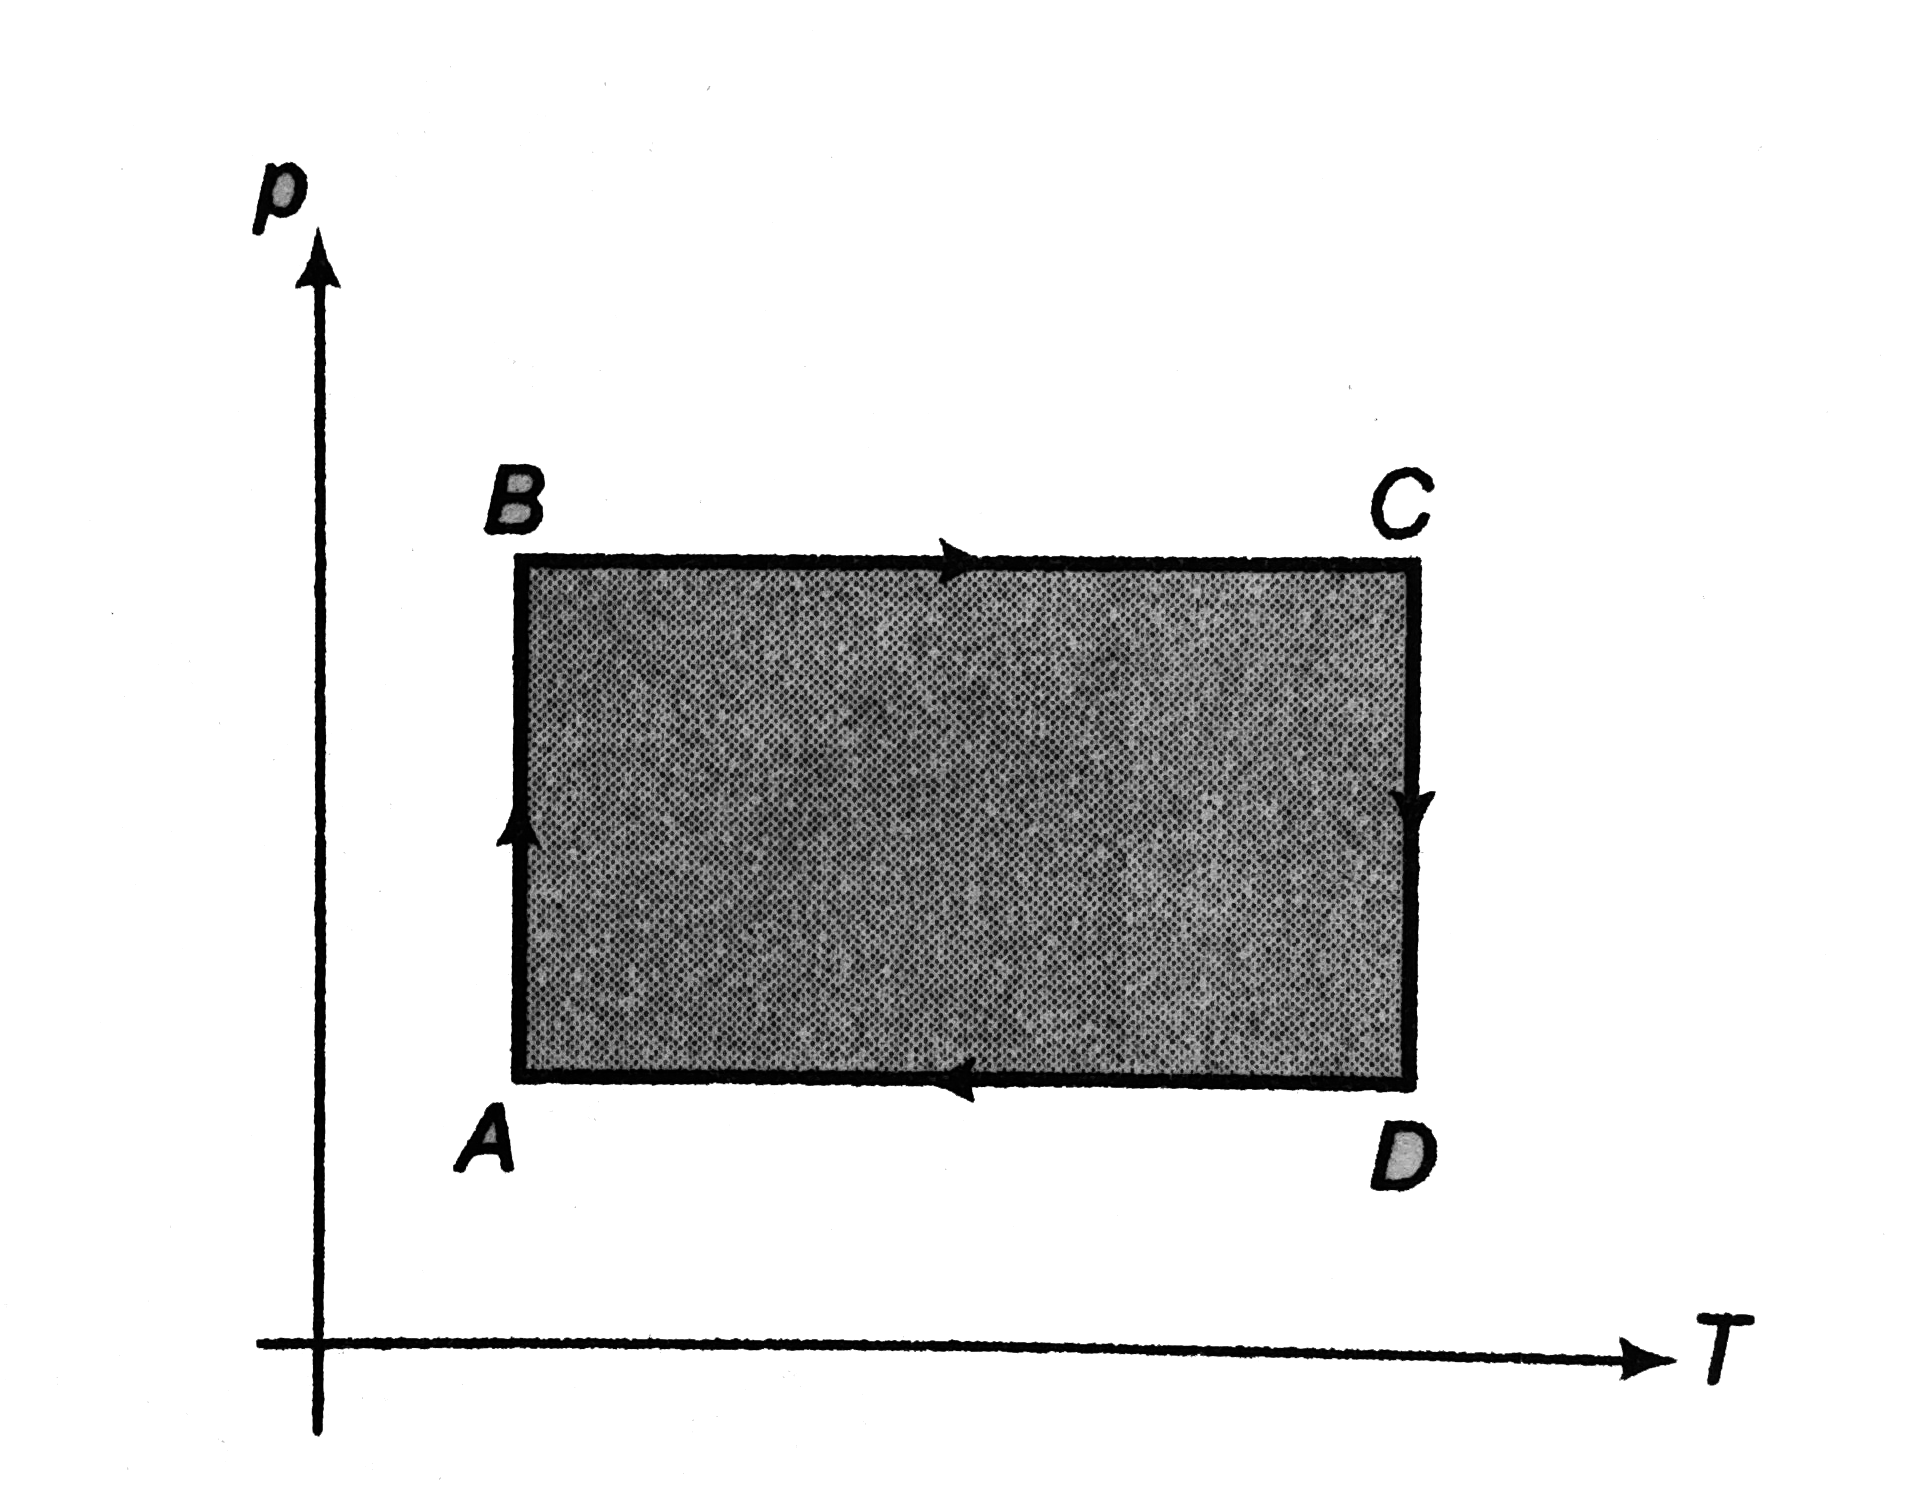
What is the corresponding P-T diagram, If the P-T diagram for an ideal gas is as shown in the figure ?
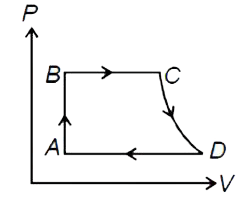
A
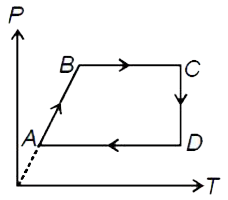
B
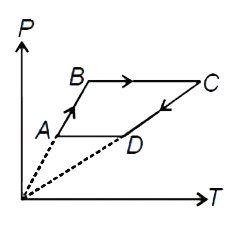
C
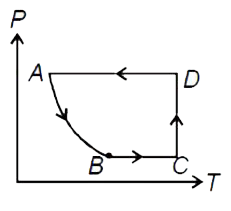
D
Text Solution
The correct Answer is:A
|
Topper's Solved these Questions
Similar Questions
Knowledge Check
The P−T graph for the given mass of an ideal gas is shown in figure. Then the volume
_E01_022_Q01.png) AincreasesBdecreasesCremains constantDdata insuficient
AincreasesBdecreasesCremains constantDdata insuficientAn ideal gas goes through a reversible cycle a→B→c→d has the V-T diagram shown below. Process d→a and b→c are adiabatic
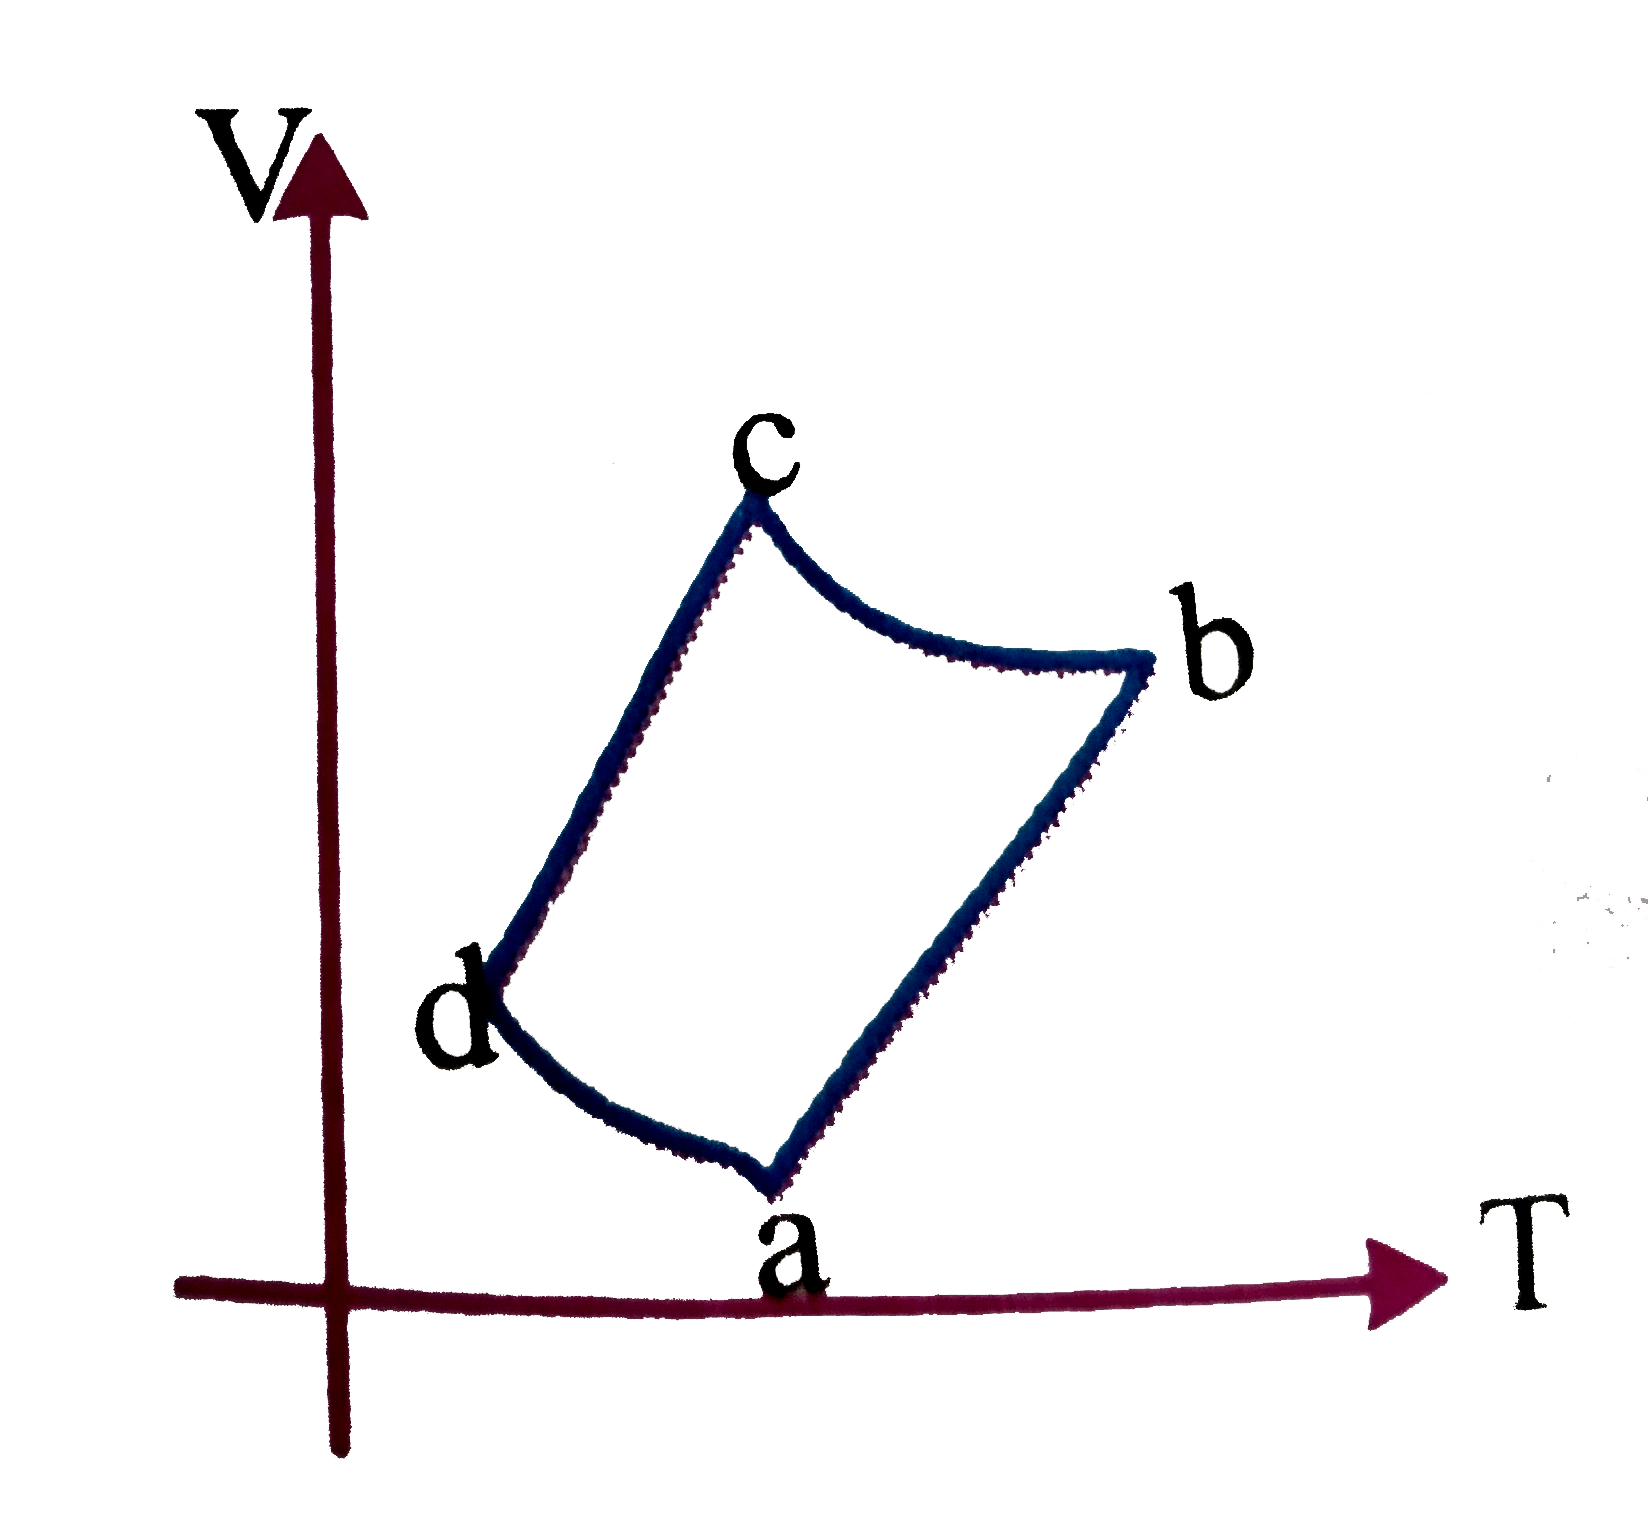
The corresponding P-V diagram for the process is(all figures are schematic and not drawn to scale)A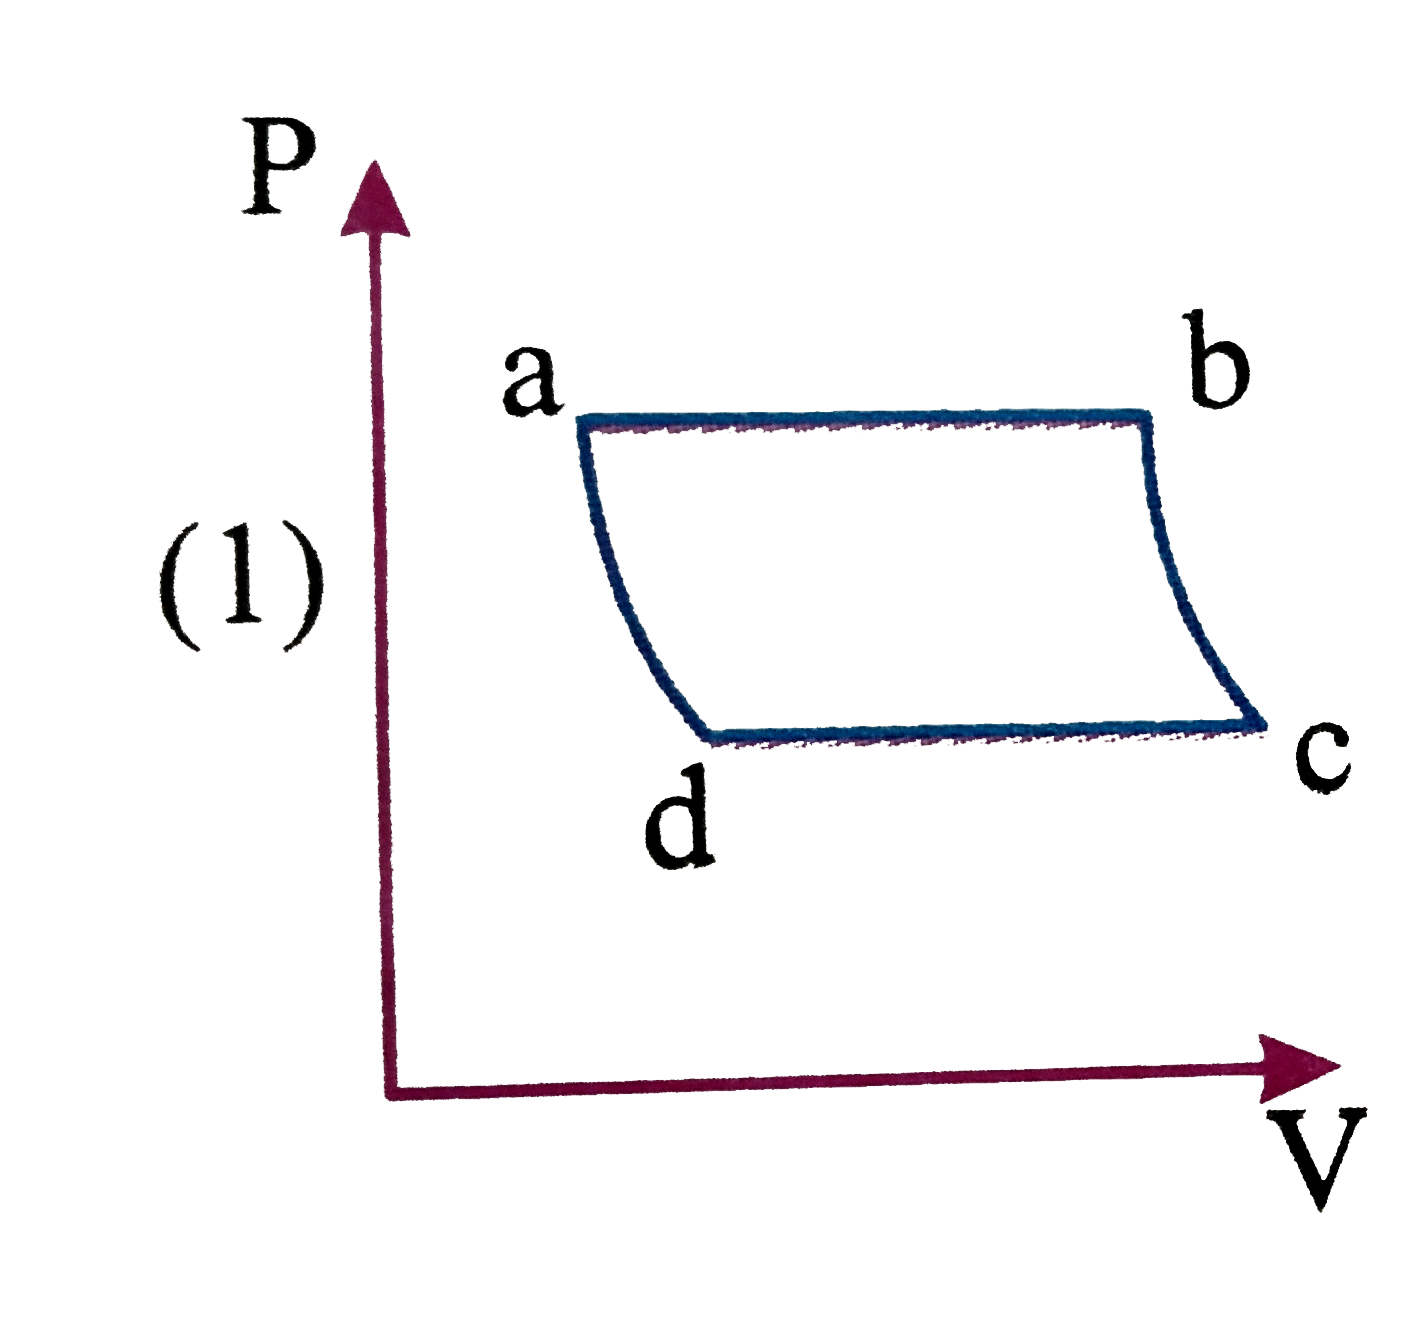 B
B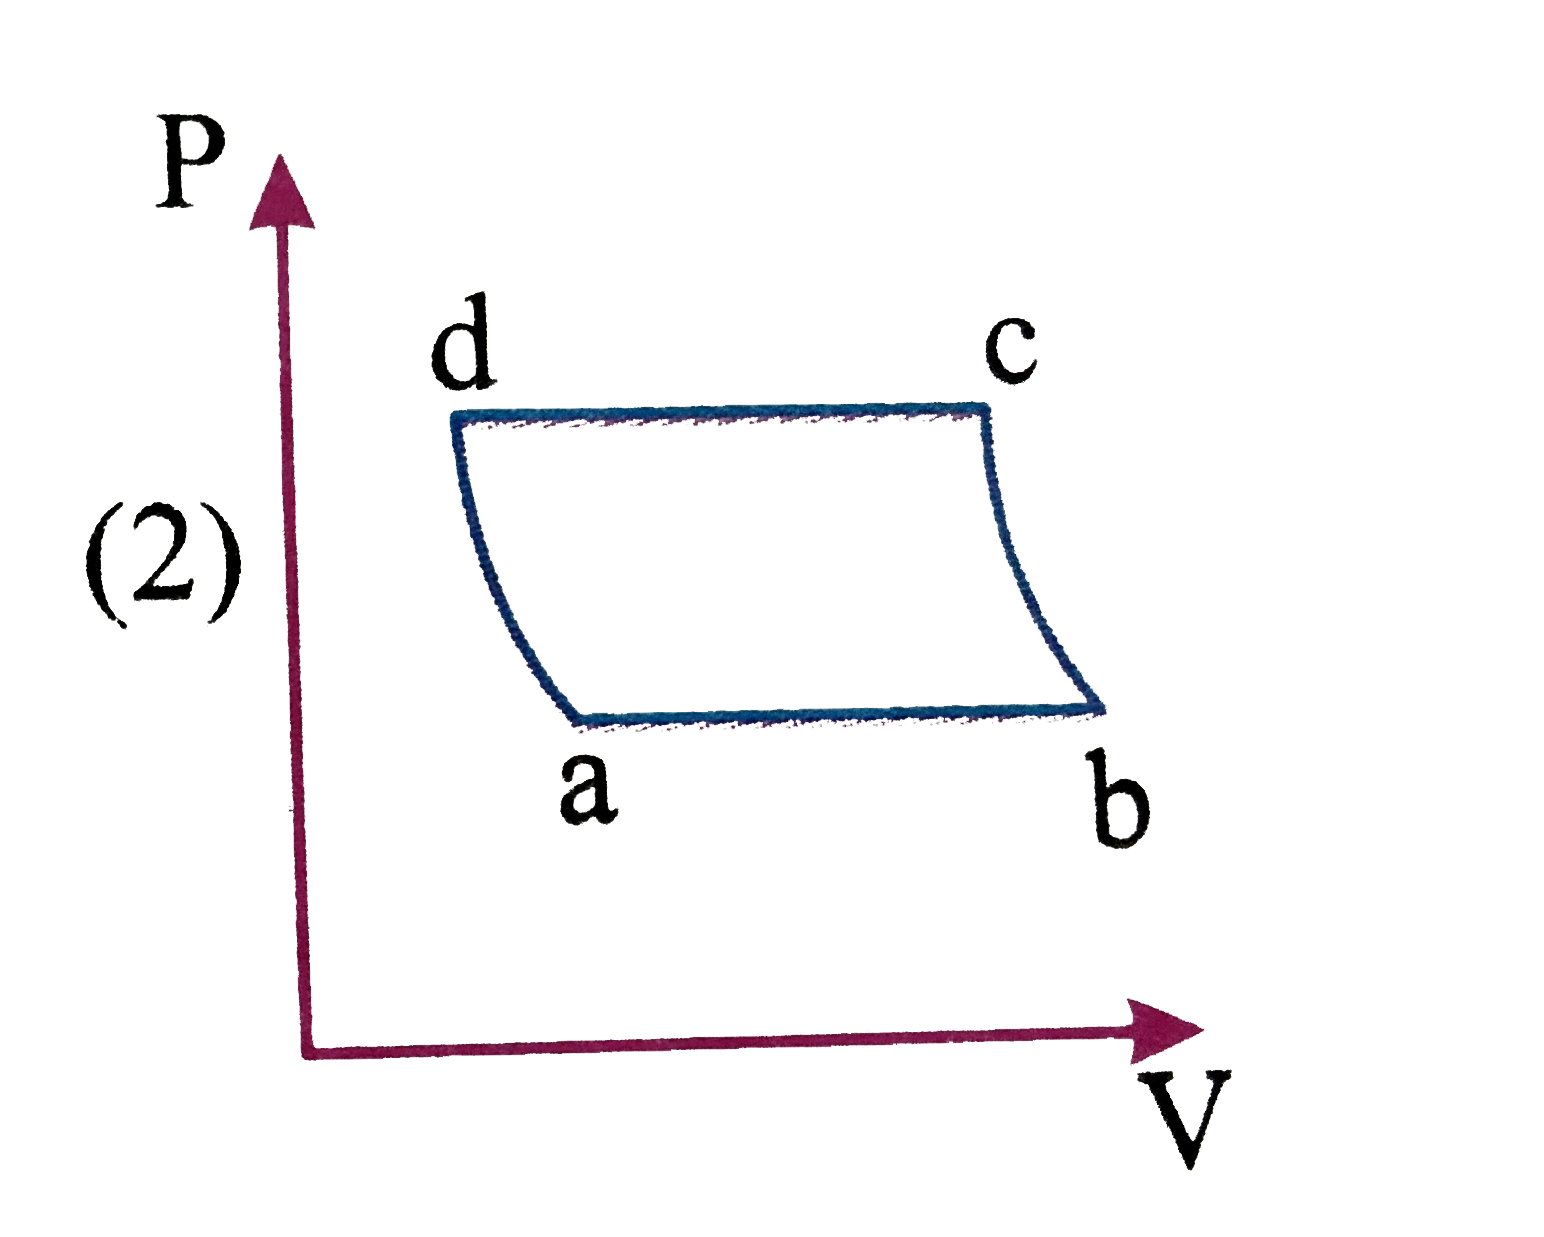 C
C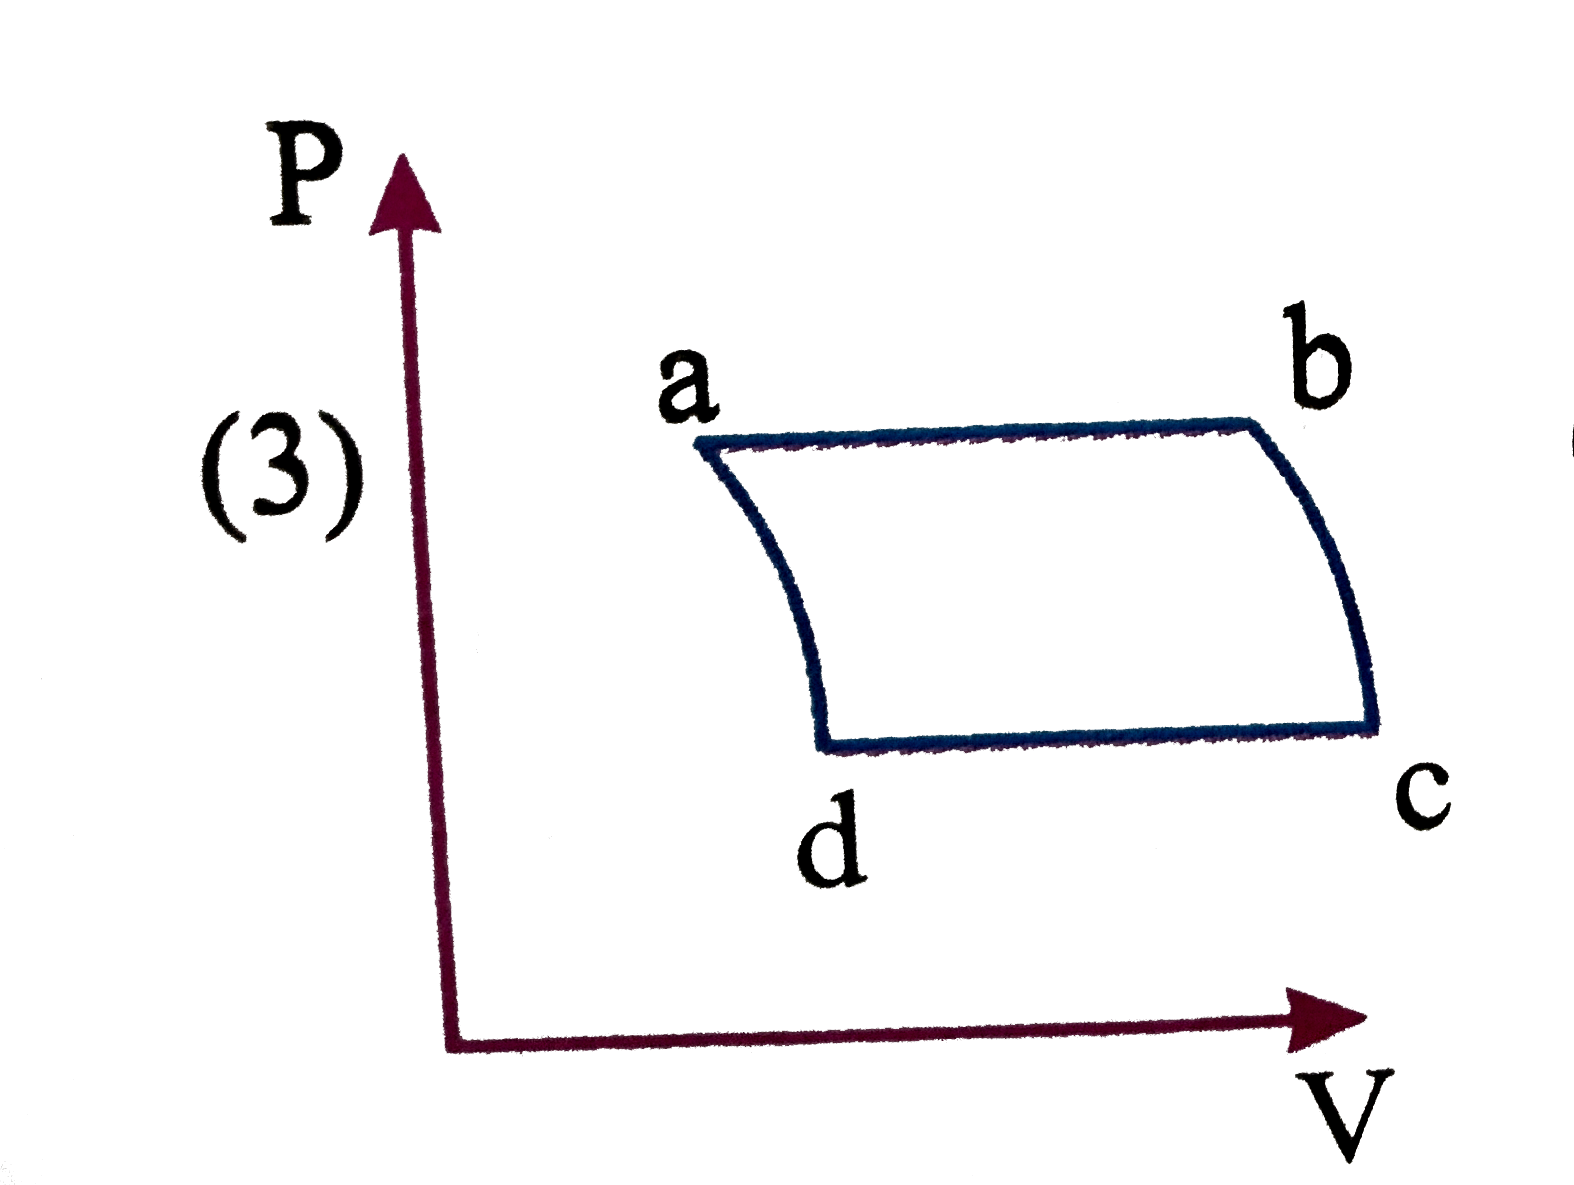 D
D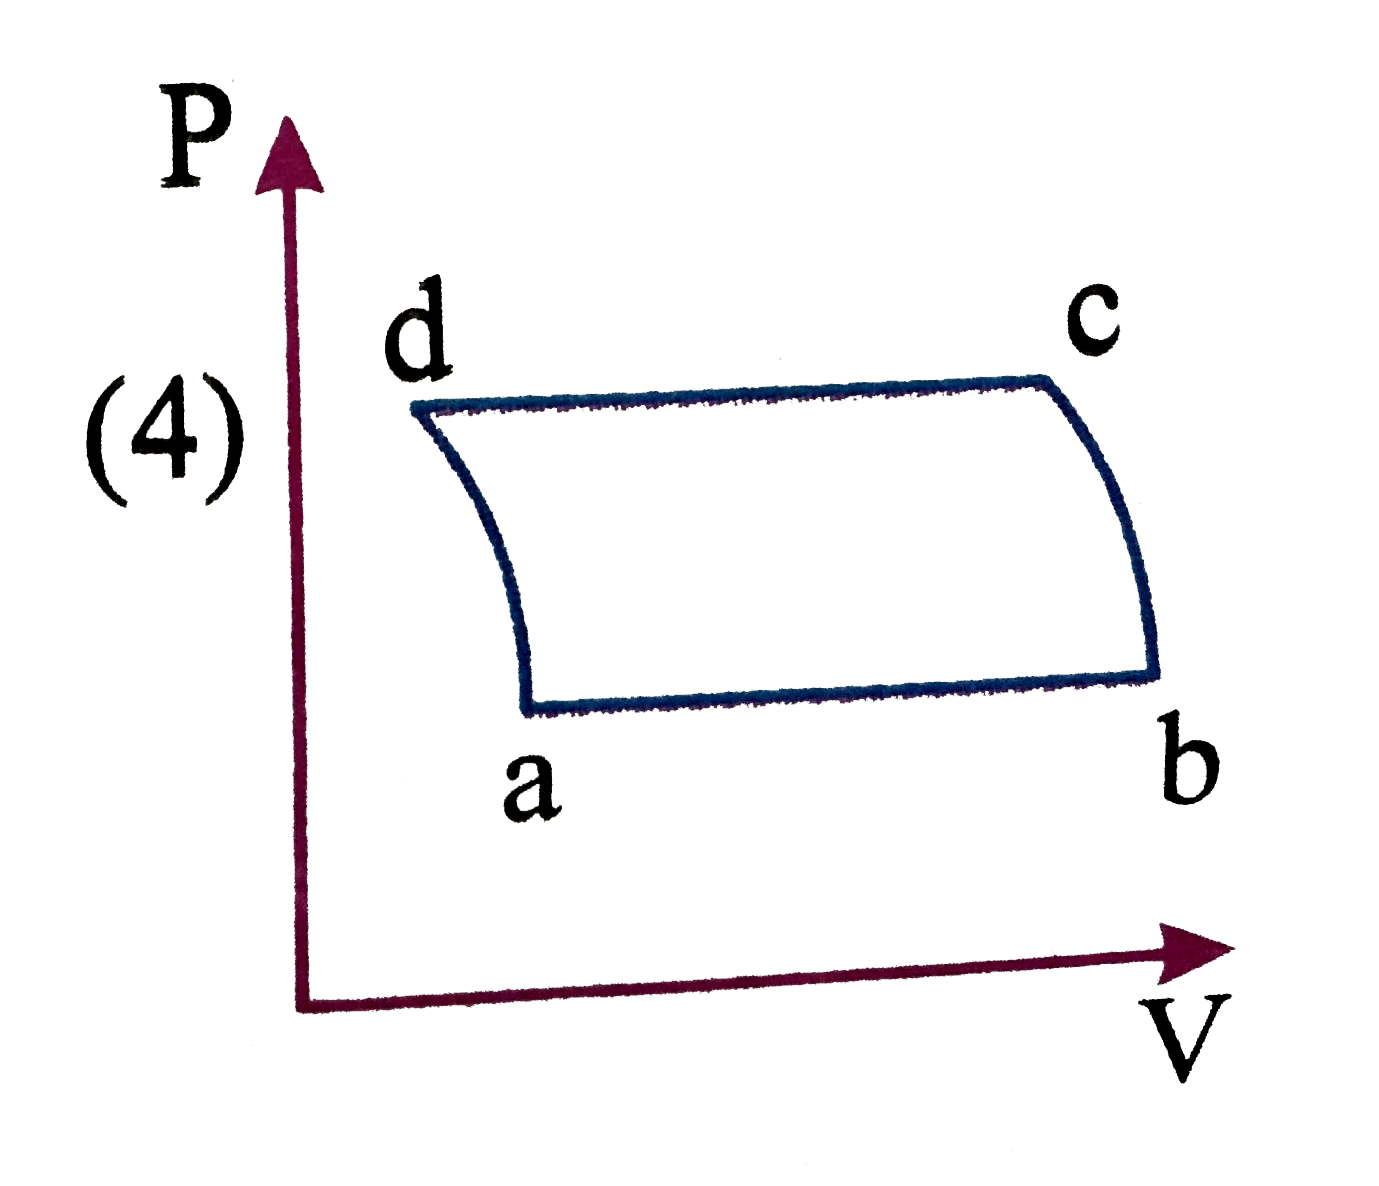
P−V diagram of an ideal gas is as shown in figure. Work done by the gas in process ABCD is
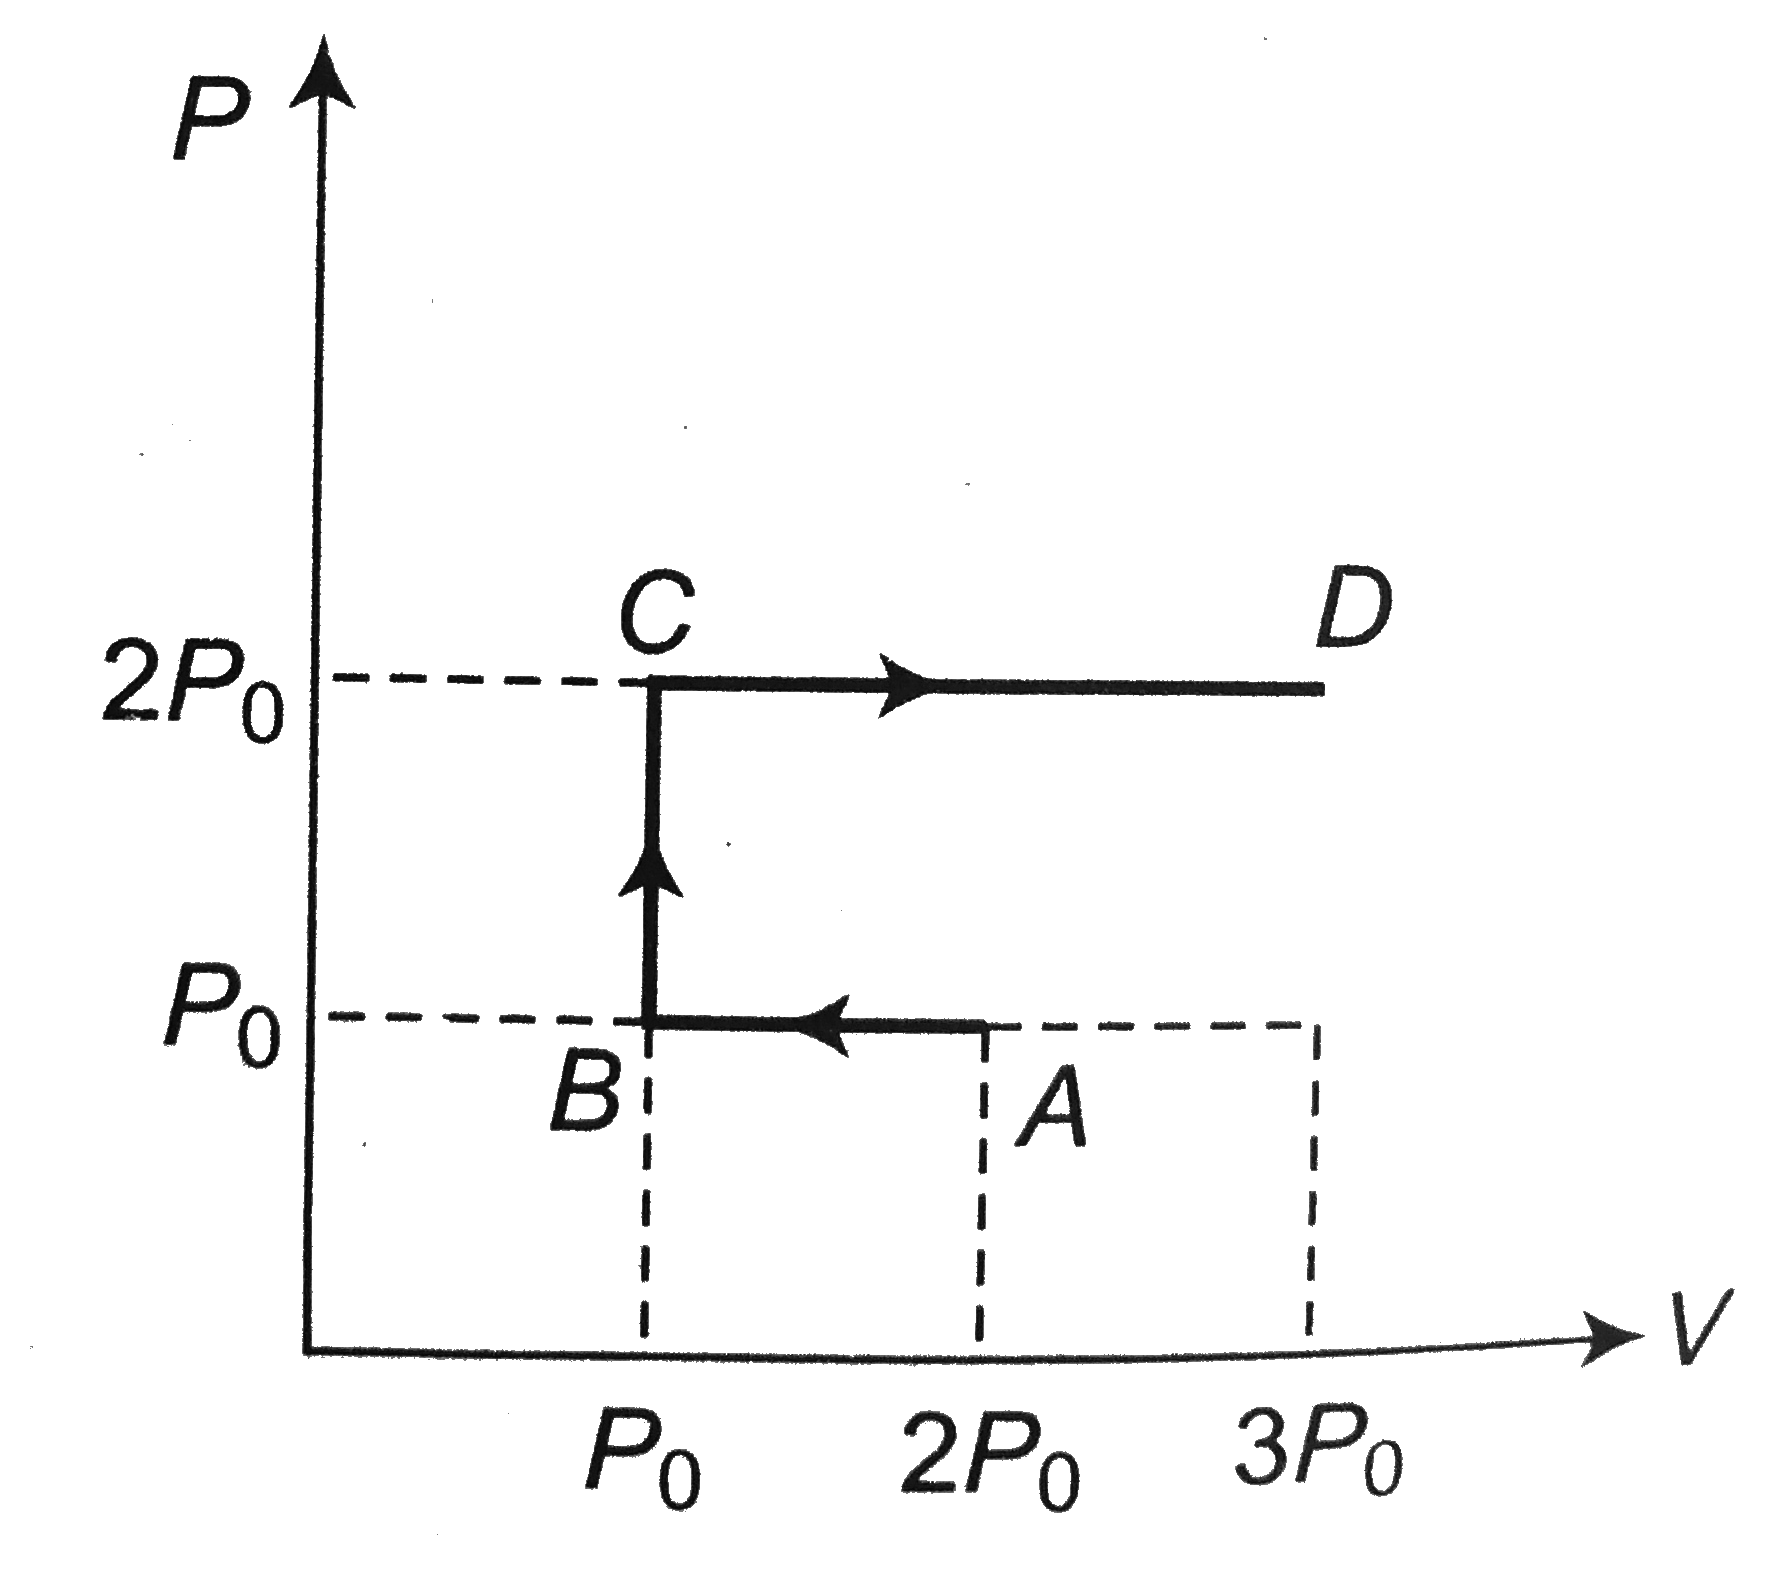 A4P0V0B2P0V0C3P0V0DP0V0
P−V diagram of an ideal gas is as shown in figure. Work done by the gas in process ABCD is

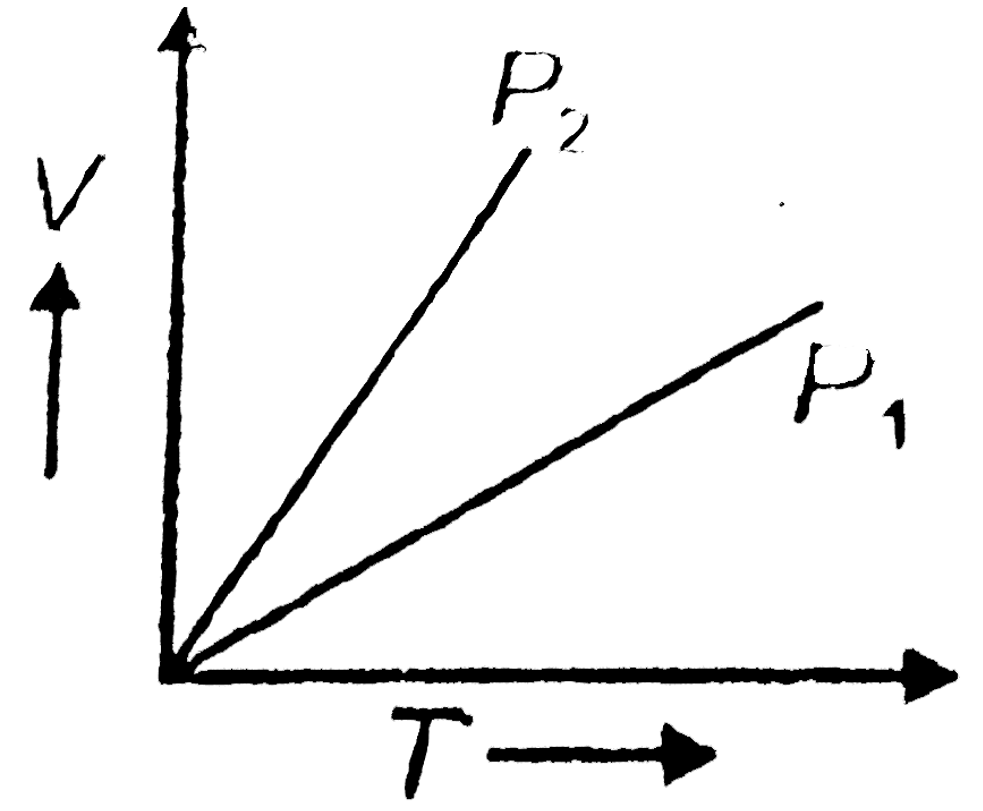
View SolutionFor V versus T curves at constant pressure P1andP2 for an ideal gas are shown in the figure given below
View SolutionThe PT diagram for an ideal gas is shown in the figure, where AC is an adiabatic process, find the corresponding PV diagram.
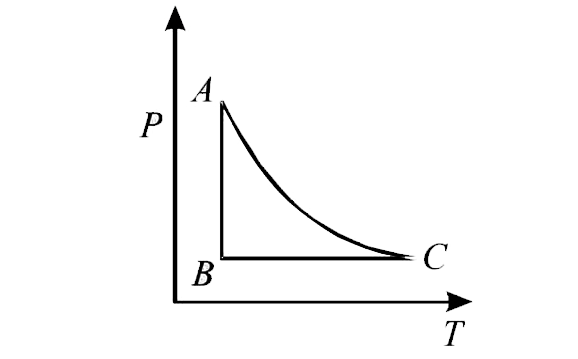
View SolutionThe PT diagram for an ideal gas is shown in the figure, where AC is an adiabatic process, find the corresponding PV diagram.

View SolutionThe PT diagram for an ideal gas is shown in the figure, where AC is an adiabatic process, find the corresponding PV diagram.

View Solution

 .
._S01_065_Q01.png)