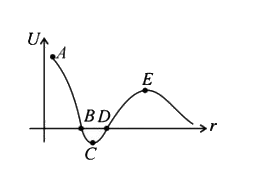
In the given graph shown the variation of the potential energy U by the interaction between two particles, with the distance separating them, r.

(i) C is a point of stable equilibrium.
(ii) B and D equilibrium points
(iii) The force of interaction between the particles is repulsive between points C and A.
(iv) The force of interaction between the two particles is attractive between points Cand B, and repulsive between D and E on the curve Choose correct statement(s) ?
A
(ii) and (iv)
B
(ii) and (iii)
C
(i) and (iii)
D
(i) and (iv)
Text Solution
The correct Answer is:C
Force acting on the particle is given by, F=−dUdr = -(slope of U - r graph)
If the slope of the graph is positive then the force of attraction will act and for the negative slope, the force repulsion will act.
At point C, F=−dUdr=0, hence it is a point of stable equilibrium.
Also, from C to A, the slope is negative, i.e., the repulsive force will act between two particles.
|
Topper's Solved these Questions
Similar Questions
Knowledge Check
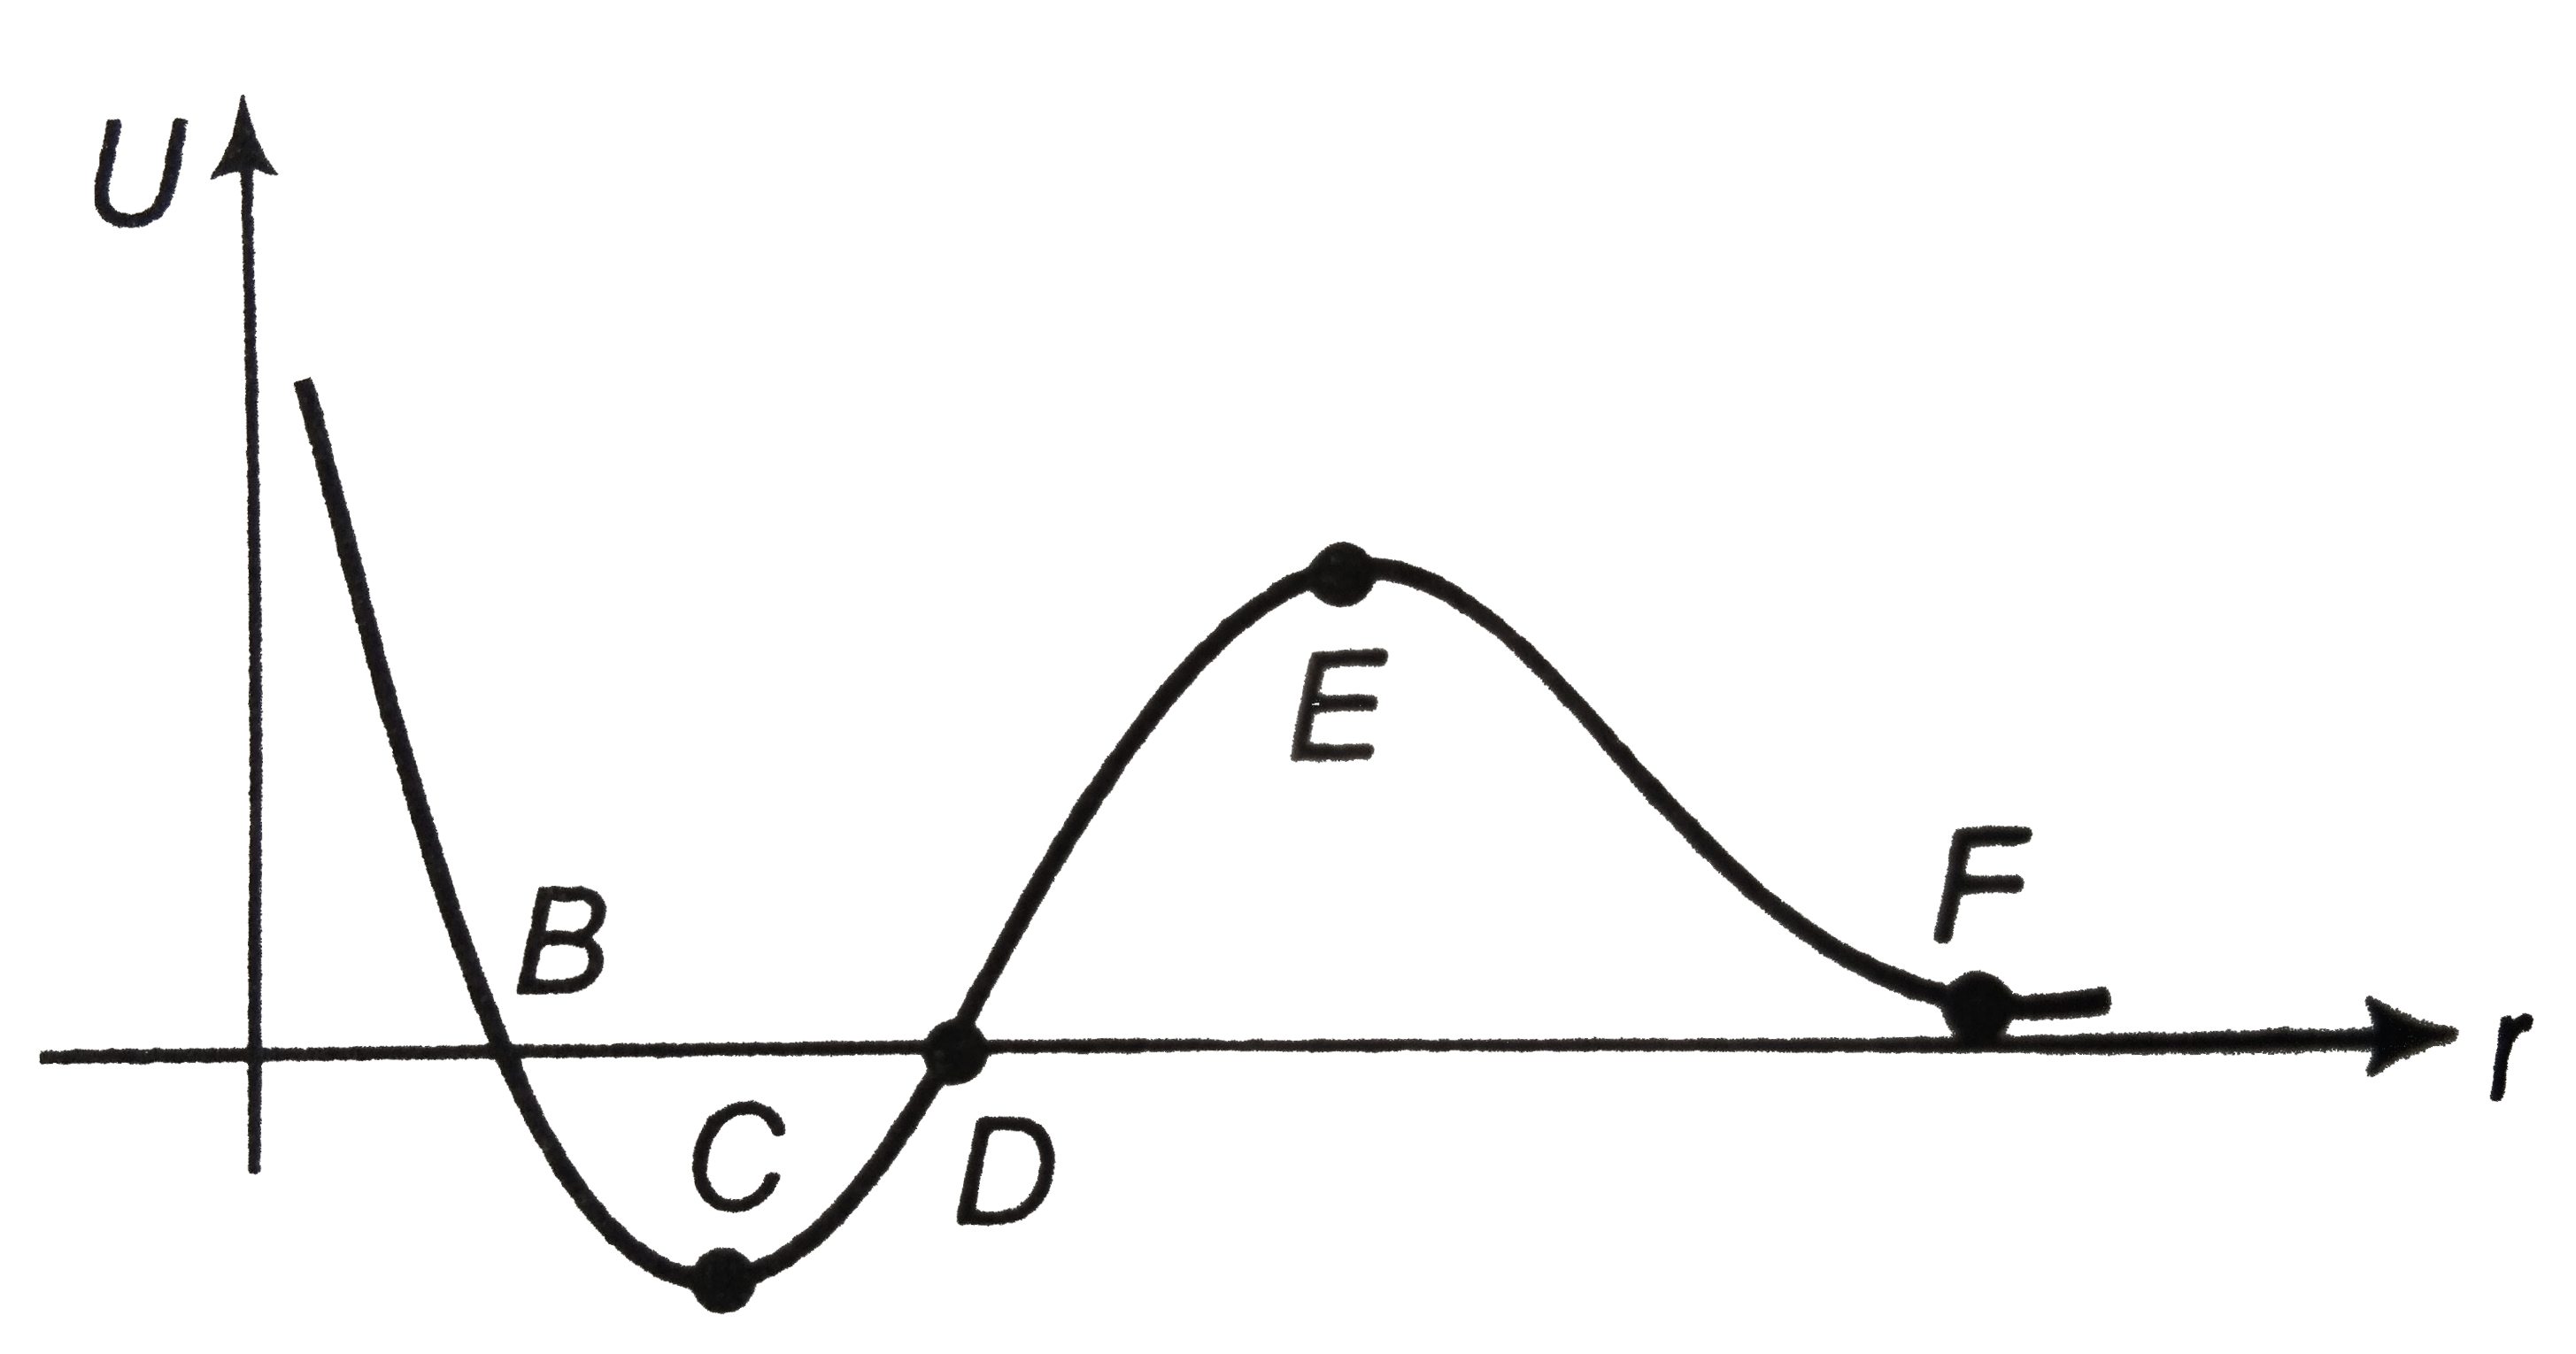
The given plot shows the variation of U, the potential energy of interaction between two particles with the distance separating them r,
 AB and D are equilibrium pointsBC is a point of stable equilibriumCThe force of stable equilibrium between the two particles is attracive between points C and D and repulsive between D and E .DThe force of interaction between particles is repulsive between points E and F.
The given plot shows the variation of U, the potential energy of interaction between two particles with the distance separating them r,
 A1 and 2B1 and 4C2 and 4D2 and 3
The inter-particle force of attraction between the particles is maximum in
AgasesBliquidsCsolidsDmatter
Forces of attraction between particles are strongest in
View SolutionWhen two bodies collide elastically, the force of interaction between them is
View SolutionIf the distance between two masses is doubled, then the gravitational attraction between them will be
View SolutionWhen two bodies collide elastically, the force of interaction between them is
View SolutionTorsion strain is the repulsive interaction between
View Solution
