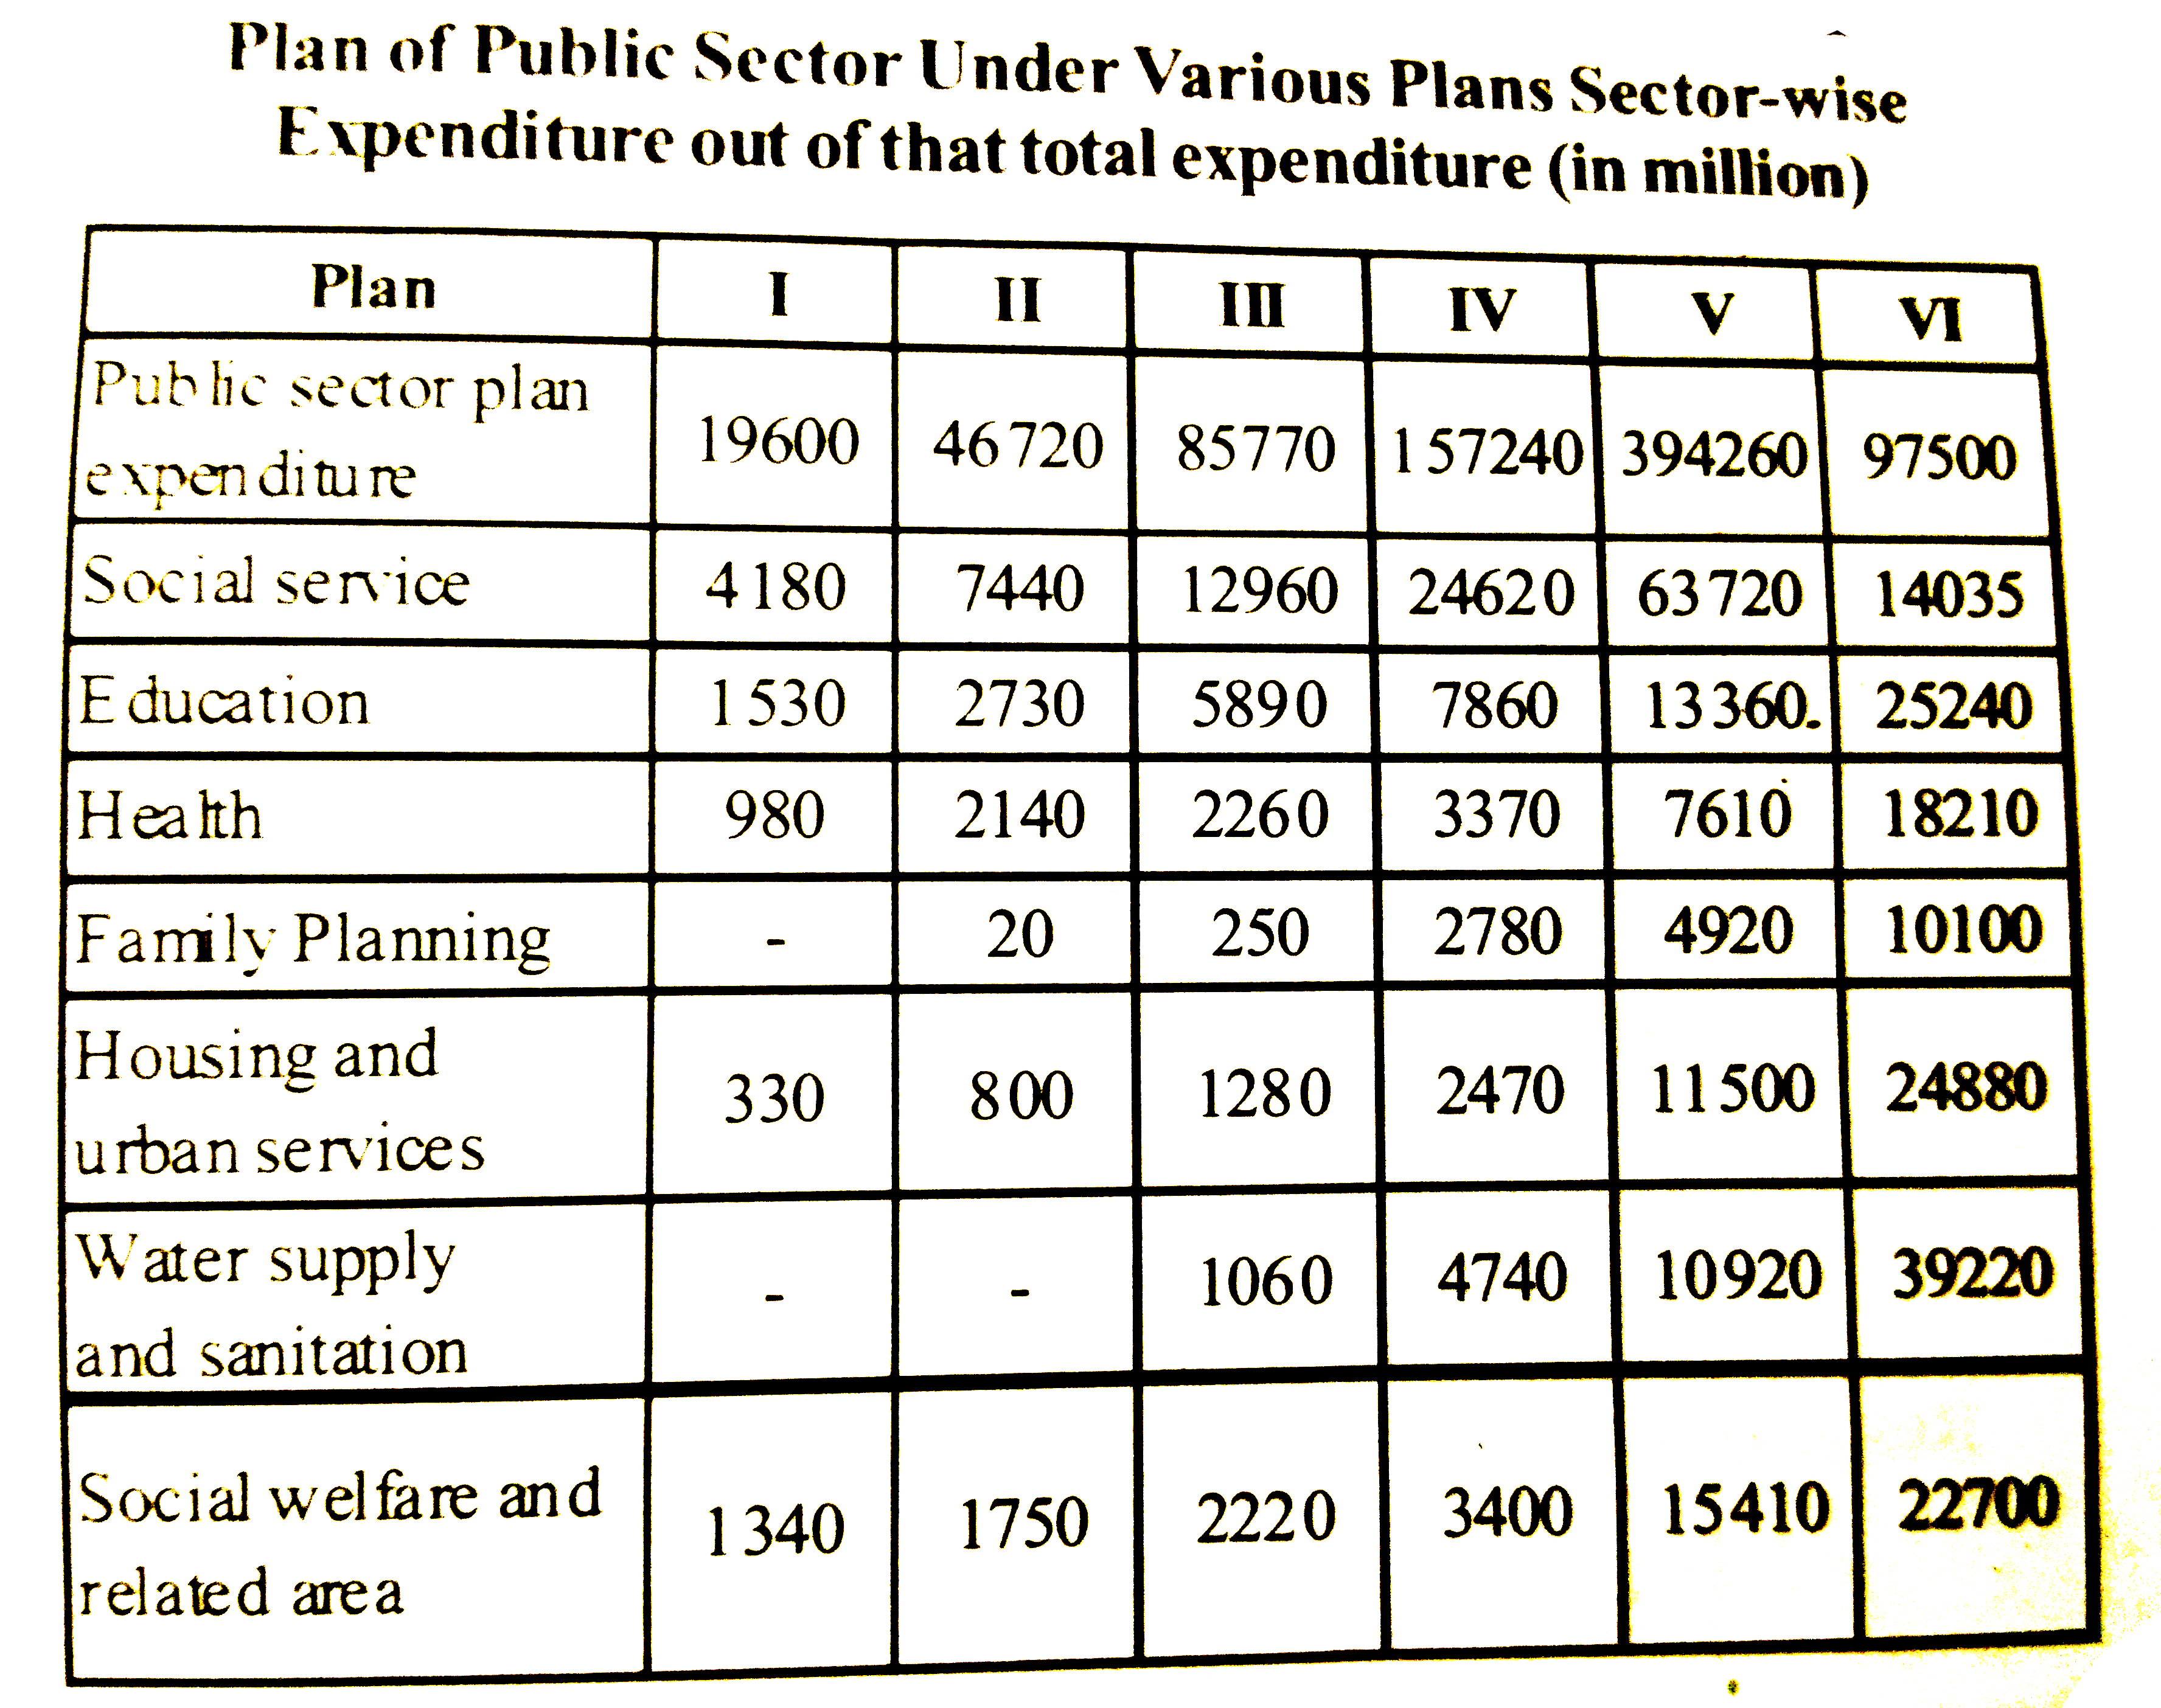
Each of the questions is based on the table given below -----
Which of the following graphs well illustrates expenditure for water supply and cleaning in the ratio of expenditure in public sector under various plannings ?
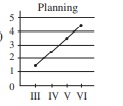
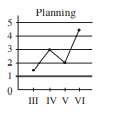
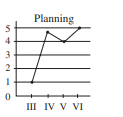
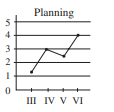
The correct Answer is:A
Topper's Solved these Questions
Similar Questions
Knowledge Check
Each of the questions is based on the table given below -----
In which sector there is a continuous decrease in expenditure in ratio of expenditure in public sector in successive planning ?ANot in any sectorBHealthCEducationDSocial ServicesEach of the questions is based on the table given below -----
What was the total difference of expenditure in Education and Health for all planning ?ARs. 220400000BRs.224000000CRs.22040000000DRs. 220400000000Each of the questions is based on the table given below -----
For which planning the expenditure of social services in ratio of expenditure of public service sector is maximum ?A(I)B(VI)C(V)D(II)
Study the following table and answer the questions based on it. Below is the Household is Expenditure (in Thousand Rupees) per annum
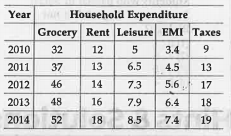
What is the total Houshold Expenditure for the year 2012
View SolutionA family with a monthly income of Rs 20,000 had planned the following expenditures per month under various heads
View SolutionA family with a monthly income of Rs 20,000 had planned the following expenditures per month under various heads
View SolutionEach of the questions is based on the table given below -----
In VI planning, how many percent expenditure of public sector planning is for housing and city services ?
View SolutionStudy the following graph carefully and answer the given questions :-
The following graph shows the % profit of two companies over the years :-
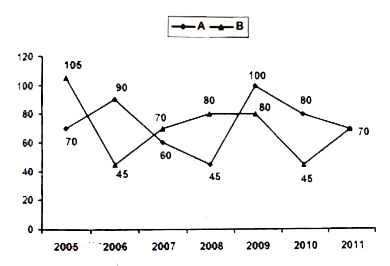
In which of the following years the ratio of expenditure to income was the least for company B?
View Solution

