Study the pie-chart and answer the questions:
Break up (degree wise) of students in terms of specialization in different areas(A, B, C, D & E) in an MBA program.
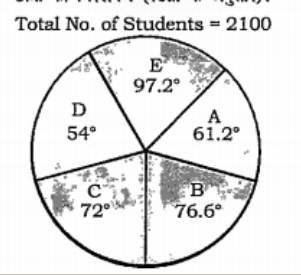
The number of students specialising in E is what percent more than that of students specialising in C?
पाई-चार्ट का अध्ययन करें और प्रश्नों के उत्तर दें: एमबीए प्रोग्राम में विभिन्न क्षेत्रों (ए, बी, सी, डी एंड ई) में विशेषज्ञता के मामले में छात्रों का ब्रेक अप (डिग्री वार)।

E में विशेषज्ञता प्राप्त छात्रों की संख्या C में विशेषज्ञता वाले छात्रों से कितने प्रतिशत अधिक है?
25.9
32
35
30.4
The correct Answer is:C
Step by step video, text & image solution for Study the pie-chart and answer the questions:Break up (degree wise) of students in terms of specialization in different areas(A, B, C, D & E) in an MBA program.The number of students specialising in E is what percent more than that of students specialising in C? पाई-चार्ट का अध्ययन करें और प्रश्नों के उत्तर दें: एमबीए प्रोग्राम में विभिन्न क्षेत्रों (ए, बी, सी, डी एंड ई) में विशेषज्ञता के मामले में छात्रों का ब्रेक अप (डिग्री वार)। E में विशेषज्ञता प्राप्त छात्रों की संख्या C में विशेषज्ञता वाले छात्रों से कितने प्रतिशत अधिक है? by Maths experts to help you in doubts & scoring excellent marks in Class 14 exams.
Updated on:21/07/2023Topper's Solved these Questions
Similar Questions
Study the pie-chart and answer the questions:
Break up (degree wise) of students in terms of specialization in different areas(A, B, C, D & E) in an MBA program.
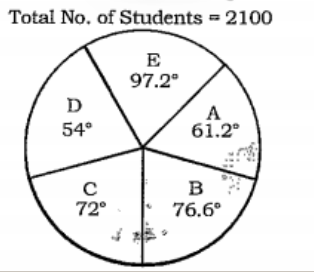
The total number of students specialising in A and B exceeds the total number of students specialising in C and D by x, which lies between:
पाई-चार्ट का अध्ययन करें और प्रश्नों के उत्तर दें: एमबीए प्रोग्राम में विभिन्न क्षेत्रों (ए, बी, सी, डी एंड ई) में विशेषज्ञता के मामले में छात्रों का ब्रेक अप (डिग्री वार)। <

ए और बी में विशेषज्ञता वाले छात्रों की कुल संख्या सी और डी में विशेषज्ञता वाले छात्रों की कुल संख्या से अधिक है।
View SolutionStudy the pie chart and answer the question that follows
आरेख का अध्ययन करें और प्रश्न का उत्तर दे।
Break up (degree wise) of students in terms of specialization in different areas (A,B,C,D&E) in MBA program.
MBA कार्यक्रम में विभिन्न क्षेत्रों (A, B, C, D और E) में विशेषज्ञता के संदर्भ में छात्रों का वितरण
The number of students specialising in E is what percent more than that of students specialising in C?
E में विशेषज्ञता प्राप्त छात्रों की संख्या, C में विशेषज्ञता प्राप्त छात्रों की संख्या की तुलना में कितना प्रतिशत अधिक है?
View Solution
Knowledge Check
Study the given pie chart and answer the question that follows.
Break-up of the students studying in schools A,B,C,D and E managed by a society, in 2019
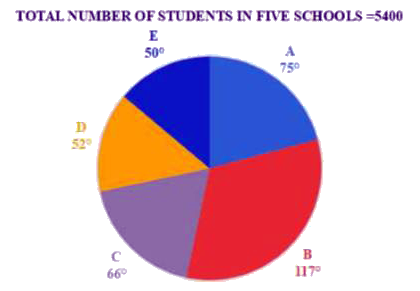
The average number of students in schools A,B and C is what percentage more than the number of students in school E ?A65%B60%C72%D70%Study the given pie chart and answer the question that follows.
Break-up (degree-wise) of the number of students in five schools (A, B, C, D and E) in a city.
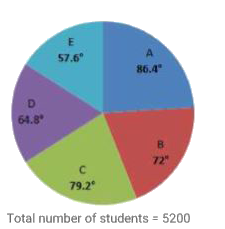
If the total number of students in schools D and E exceeds the number of students in school A by x, then x lies between:A475 and 500B550 and 575C525 and 550D500 and 525Study the following pie-chart and answer the questions given below :
Preferences of stuents among six beverages in terms of degre of angle in the pie-chart Total no. of students = 6800
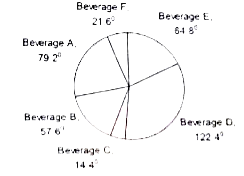
The number of students who prefer Beverage C are approximately what percent of the number of students who prefer Beverage D ?A7B12C18D22
Study the given pie chart and answer the question that follows
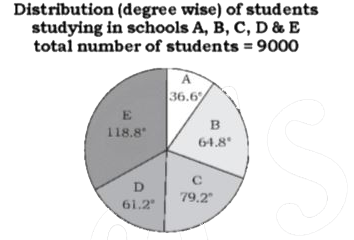
The total number of students in schools D and E is what percentage more than the number of students in schools B and C?
View SolutionStudy the given graph and answer the question that follows:
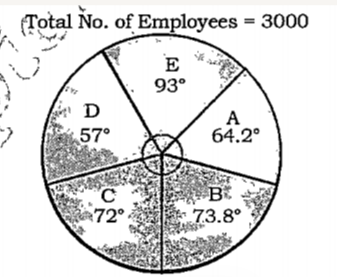
Breakup for distribution (degree wise) of the employees working in five departments (A,B,C,D, and E) in a company The number of employees in department B is what percent of the total number of employees working in department D and E?
दिए गए ग्राफ का अध्ययन करें और नीचे दिए गए प्रश्न का उत्त्तर दें। कंपनी के पांच विभागों (A, B, C, D और E) में काम कर रहे कर्मचारियों का वितरण
(डिग्री में) है। विभाग B में कर्मचारियों को संख्या, विभाग D और E में कार्य करने वाले कर्मचारियों की कुल संख्या की कितनी प्रतिशत है ?
View SolutionStudy the pie-chart and answer the questions. In an institute, there are 900 students who use different modes of transport for to and from travel. The given pie diagram represents the requisite data.
पाई-चार्ट का अध्ययन करें और प्रश्नों के उत्तर दें। एक संस्थान में, 900 छात्र हैं जो आने-जाने के लिए परिवहन के विभिन्न साधनों का उपयोग करते हैं। दिए गए पाई चार्ट में संबंधित आंकड़े दिए गए हैं।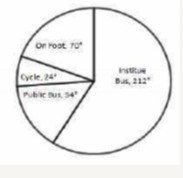 The number of students who travel on foot is:
पैदल यात्रा करने वाले छात्रों की संख्या है:
View SolutionStudy the following pie chart and table to answer the question.Total number of students admitted in a university in various fields = 5000 Distribution of the number of students into various fields:
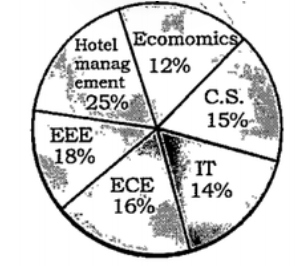
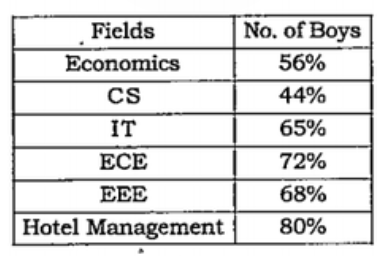
The ratio of the number of boys in Economics to the number of students in Economics is:
निम्नांकित पाई चार्ट का अध्ययन कीजिए और उसके बाद दिए गए प्रशन का उत्तर दीजिए। एक विश्वविद्यालय में विभिन्न संकायों में प्रवेश लेने वाले विद्यार्थियों की संख्या 5000 है। विभिन्न संकायों में विद्यार्थियों को संख्या का बंटनः
 इकोनॉमिक्स में लड़कों की संख्या का, इकोनॉमिक्स में कुल विद्यार्थियों की संख्या से क्या अनुपात हे?
View SolutionStudy the pie-chart and answer the options:-
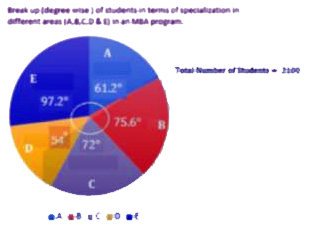
If the ratio of male and female students specialising in B is 4 : 3 and that of male and female students specialising in D is 8 : 7, then the number of female students in D is what per cent less than the number of male students in B (correct to one decimal place)?
View Solution
