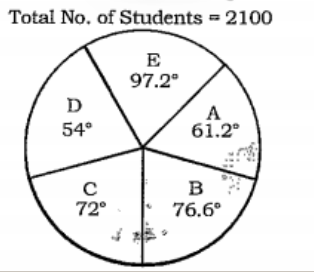
Study the pie-chart and answer the questions:
Break up (degree wise) of students in terms of specialization in different areas(A, B, C, D & E) in an MBA program.

The total number of students specialising in A and B exceeds the total number of students specialising in C and D by x, which lies between:
पाई-चार्ट का अध्ययन करें और प्रश्नों के उत्तर दें: एमबीए प्रोग्राम में विभिन्न क्षेत्रों (ए, बी, सी, डी एंड ई) में विशेषज्ञता के मामले में छात्रों का ब्रेक अप (डिग्री वार)। <

ए और बी में विशेषज्ञता वाले छात्रों की कुल संख्या सी और डी में विशेषज्ञता वाले छात्रों की कुल संख्या से अधिक है।
60 and 65
55 and 60
65 and 70
50 and 55
The correct Answer is:A
Step by step video, text & image solution for Study the pie-chart and answer the questions:Break up (degree wise) of students in terms of specialization in different areas(A, B, C, D & E) in an MBA program. The total number of students specialising in A and B exceeds the total number of students specialising in C and D by x, which lies between: पाई-चार्ट का अध्ययन करें और प्रश्नों के उत्तर दें: एमबीए प्रोग्राम में विभिन्न क्षेत्रों (ए, बी, सी, डी एंड ई) में विशेषज्ञता के मामले में छात्रों का ब्रेक अप (डिग्री वार)। < ए और बी में विशेषज्ञता वाले छात्रों की कुल संख्या सी और डी में विशेषज्ञता वाले छात्रों की कुल संख्या से अधिक है। by Maths experts to help you in doubts & scoring excellent marks in Class 14 exams.
Updated on:21/07/2023Topper's Solved these Questions
Similar Questions
A certain sum of money becomes 2.25 times of itself in 2 years. Then find the rate of interest if compounded annually.
View SolutionAfter a discount of 34% an article is sold for Rs.3168. What is the marked price (in Rs) of the article?
View SolutionDetermine the point of symmetry of a regular hexagon.
View SolutionMatch the following Column A to Column B

View SolutionMatch the following Column A to Column B

View SolutionMatch the following Column A to Column B

View SolutionThe inequation represented by the graph given below is :
View SolutionThe inequation that best describes the graph given below is _________
View SolutionThe inequation that best describes the following graph is _________
View SolutionThe total surface area of the given solid figure is _______________.

View SolutionStudy the pie-chart and answer the questions: Break up (degree wise) of students in terms of specialization in different areas(A, B, C, D & E) in an MBA program. The total number of students specialising in A and B exceeds the total number of students specialising in C and D by x, which lies between: पाई-चार्ट का अध्ययन करें और प्रश्नों के उत्तर दें: एमबीए प्रोग्राम में विभिन्न क्षेत्रों (ए, बी, सी, डी एंड ई) में विशेषज्ञता के मामले में छात्रों का ब्रेक अप (डिग्री वार)। ए और बी में विशेषज्ञता वाले छात्रों की कुल संख्या सी और डी में विशेषज्ञता वाले छात्रों की कुल संख्या से अधिक है।
View SolutionStudy the pie-chart and answer the questions: Break up (degree wise) of students in terms of specialization in different areas(A, B, C, D & E) in an MBA program. The number of students specialising in E is what percent more than that of students specialising in C? पाई-चार्ट का अध्ययन करें और प्रश्नों के उत्तर दें: एमबीए प्रोग्राम में विभिन्न क्षेत्रों (ए, बी, सी, डी एंड ई) में विशेषज्ञता के मामले में छात्रों का ब्रेक अप (डिग्री वार)। E में विशेषज्ञता प्राप्त छात्रों की संख्या C में विशेषज्ञता वाले छात्रों से कितने प्रतिशत अधिक है?
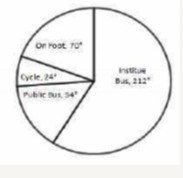
View SolutionStudy the pie-chart and answer the questions. In an institute, there are 900 students who use different modes of transport for to and from travel. The given pie diagram represents the requisite data.
पाई-चार्ट का अध्ययन करें और प्रश्नों के उत्तर दें। एक संस्थान में, 900 छात्र हैं जो आने-जाने के लिए परिवहन के विभिन्न साधनों का उपयोग करते हैं। दिए गए पाई चार्ट में संबंधित आंकड़े दिए गए हैं। The number of students who travel on foot is:
पैदल यात्रा करने वाले छात्रों की संख्या है:
View SolutionStudy the pie chart and answer the question that follows
आरेख का अध्ययन करें और प्रश्न का उत्तर दे।
Break up (degree wise) of students in terms of specialization in different areas (A,B,C,D&E) in MBA program.
MBA कार्यक्रम में विभिन्न क्षेत्रों (A, B, C, D और E) में विशेषज्ञता के संदर्भ में छात्रों का वितरण
The number of students specialising in E is what percent more than that of students specialising in C?
E में विशेषज्ञता प्राप्त छात्रों की संख्या, C में विशेषज्ञता प्राप्त छात्रों की संख्या की तुलना में कितना प्रतिशत अधिक है?
View SolutionStudy the given pie chart and answer the question that follows If the total number of students in schools D and E exceeds the number of students in school by x, then x lies between
View SolutionStudy the following pie-chart and then answer the given question. The distribution of the number of students (degree wise) in five schools (A, B, C, D and E) of a city is given. If the total number of students of school D and E is more than that of students of school A, then the value of x will lie between
View Solution
