Study the pie chart given below and answer the following questions. Pie chart shows the percentage distribution of total distance travelled by Anurag on 5 days (Monday, Tuesday, Wednesday, Thursday and Friday).
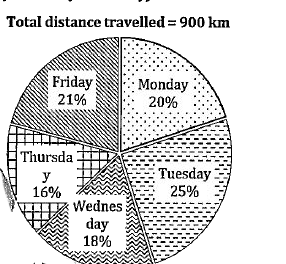
Distance travelled by Anurag on Wednesday and Friday together is how much more or less than distance travelled by Anurag on Tuesday and Thursday together?
9km
45km
18km
27km
The correct Answer is:C
Step by step video, text & image solution for Study the pie chart given below and answer the following questions. Pie chart shows the percentage distribution of total distance travelled by Anurag on 5 days (Monday, Tuesday, Wednesday, Thursday and Friday). Distance travelled by Anurag on Wednesday and Friday together is how much more or less than distance travelled by Anurag on Tuesday and Thursday together? by Maths experts to help you in doubts & scoring excellent marks in Class 14 exams.
Topper's Solved these Questions
- BOOK - ADDA247CHAPTER - DATA INTERPRETATIONEXERCISE - Prelims Questions (Level-2)59videos
DATA INTERPRETATION
- BOOK - ADDA247CHAPTER - DATA INTERPRETATIONEXERCISE - Mains Questions33videos
DATA INTERPRETATION
- BOOK - ADDA247CHAPTER - DATA INTERPRETATIONEXERCISE - Basic Questions30videos
DATA INTERPRETATION
- BOOK - ADDA247CHAPTER - BOAT AND STREAM EXERCISE - Previous Year Question22videos
BOAT AND STREAM
- BOOK - ADDA247CHAPTER - DATA SUFFICIENCY EXERCISE - PREVIOUS YEAR QUESTIONS25videos
DATA SUFFICIENCY
Similar Questions
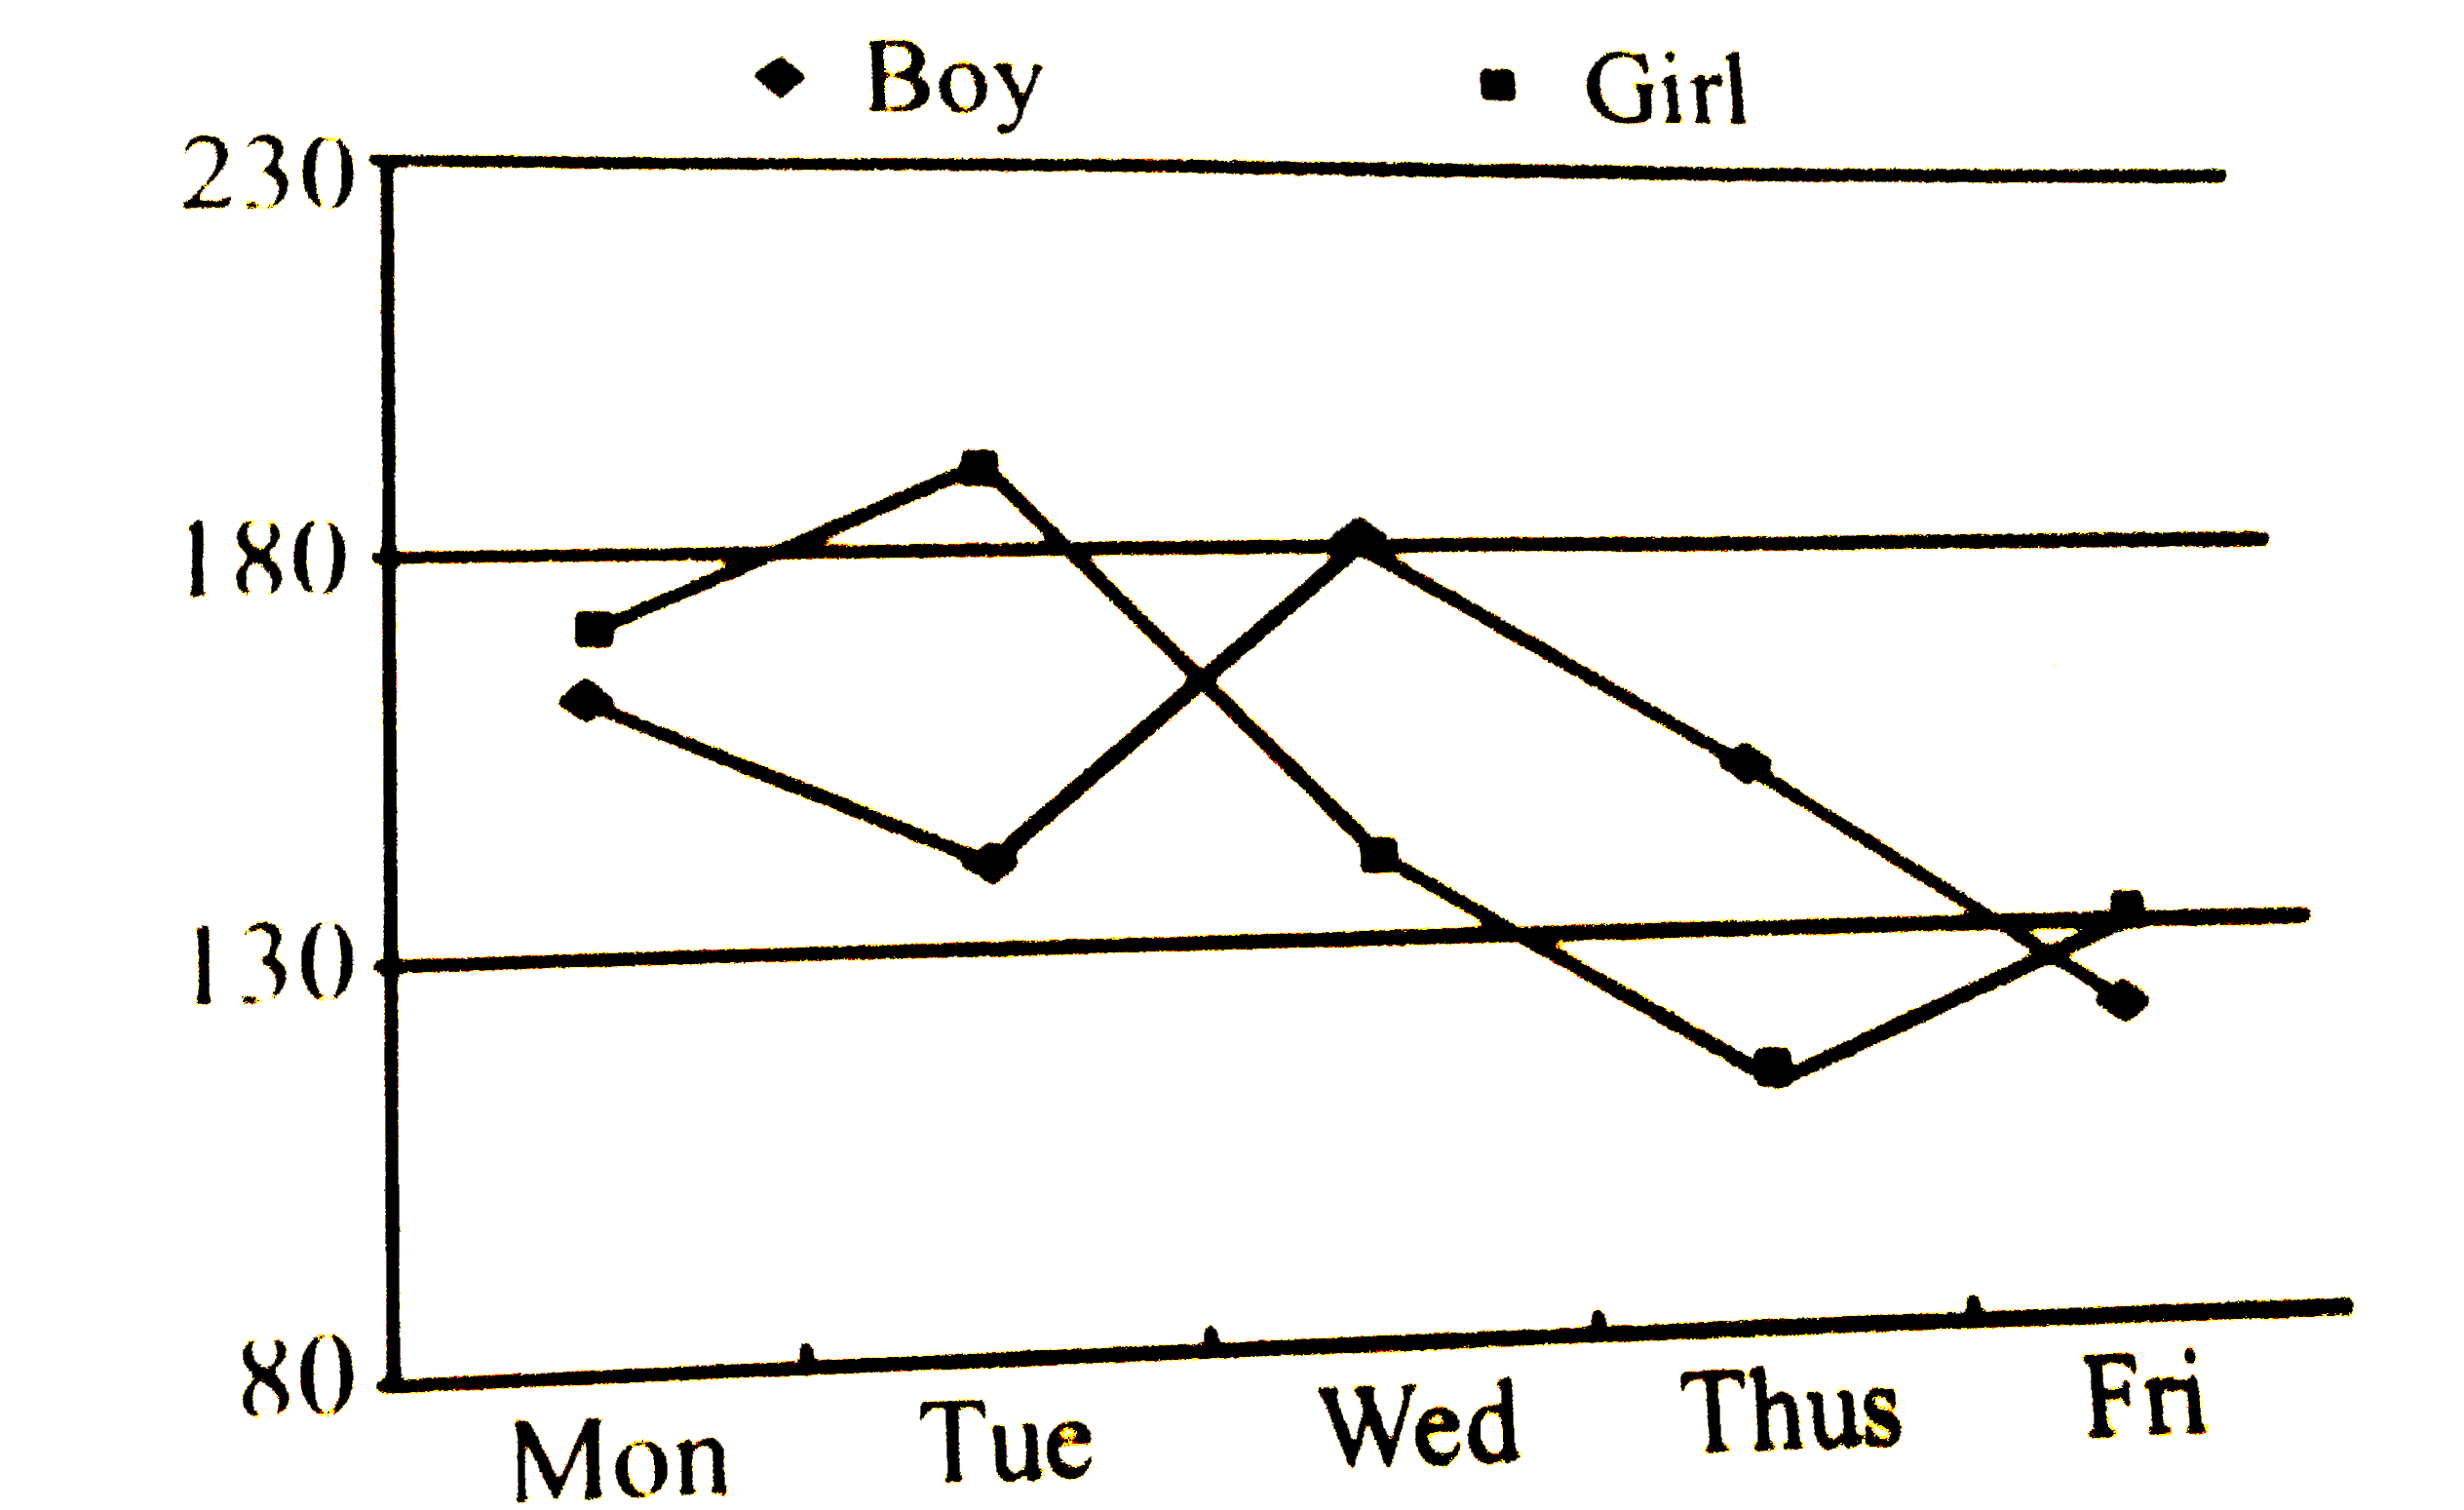
Total number of boys and girsl visited the place on Monday and Tuesday together is ho much more than the total number of boys and girsl visited the place on Thursday and Friday together ?View SolutionStudy the following information carefully and answer the given questions.
The following chart shows the opening, closing, high and low price of a share of a company XYZ on given 5 days-Monday, Tuesday, Wednesday, Thursday and Friday.
Opening and closing price of the shares of the company XYZ are represented by ceiling and floor of the black box and floor and ceiling of the white box respectively. The high and low price of the share of the company XYZ are represented by ceiling and floor of the line respectively
For example: On Monday, opening price = 60, closing price = 52, high price = 66 and low price = 40
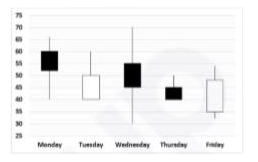
What is the ratio of average high price and average low price of the share of the company XYZ on Monday, Tuesday, Wednesday and Friday?View Solution
Knowledge Check
- Question 1 - Select One
Study the following pie chart carefully and answer the questions. The pie chart represents the percentage of people involved in various occupations.(total number of people-20000).
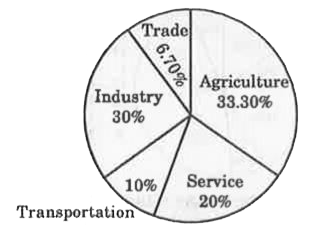
How many more people are involved in service than in trade?A3360B2660C1660D660 - Question 2 - Select One
The following pie-chart shows the percentage distribution of the expenditure incurred in publishing a book. Study the pie-chart and answer the questions based on it.
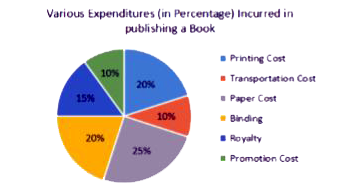
Royalty on the book is less than the paper cost by :A0.25B0.3C0.5D0.4 - Question 3 - Select One
The following pie-chart shows the percentage distribution of the expenditure incurred in publishing a book. Read the pie-chart and answer the questions.

Royality on the book is less than the printing cost by :A20%B5%C25%D3313
Study the following information carefully and answer the given questions.
The following chart shows the opening, closing, high and low price of a share of a company XYZ on given 5 days-Monday, Tuesday, Wednesday, Thursday and Friday.
Opening and closing price of the shares of the company XYZ are represented by ceiling and floor of the black box and floor and ceiling of the white box respectively. The high and low price of the share of the company XYZ are represented by ceiling and floor of the line respectively
For example: On Monday, opening price = 60, closing price = 52, high price = 66 and low price = 40
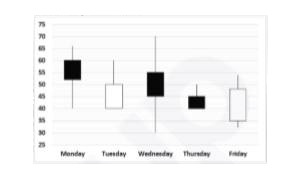
Average closing price of shares of the company XYZ is what percent more than the average opening price for the given 5 days?View SolutionStudy the following information carefully and answer the given questions.
The following chart shows the opening, closing, high and low price of a share of a company XYZ on given 5 days-Monday, Tuesday, Wednesday, Thursday and Friday.
Opening and closing price of the shares of the company XYZ are represented by ceiling and floor of the black box and floor and ceiling of the white box respectively. The high and low price of the share of the company XYZ are represented by ceiling and floor of the line respectively
For example: On Monday, opening price = 60, closing price = 52, high price = 66 and low price = 40
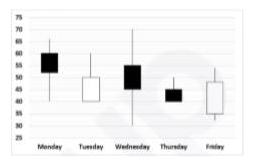
A trader, bought 150 shares of the company XYZ on opening price of Tuesday and sold 40% these shares on highest price of the share on Thursday and rest on opening price of Friday. Rate of commission while buying the shares is Flat Rs. 200 and while selling it is 8% of the selling price, then what is the total loss incurred by the trader in this transaction?View Solution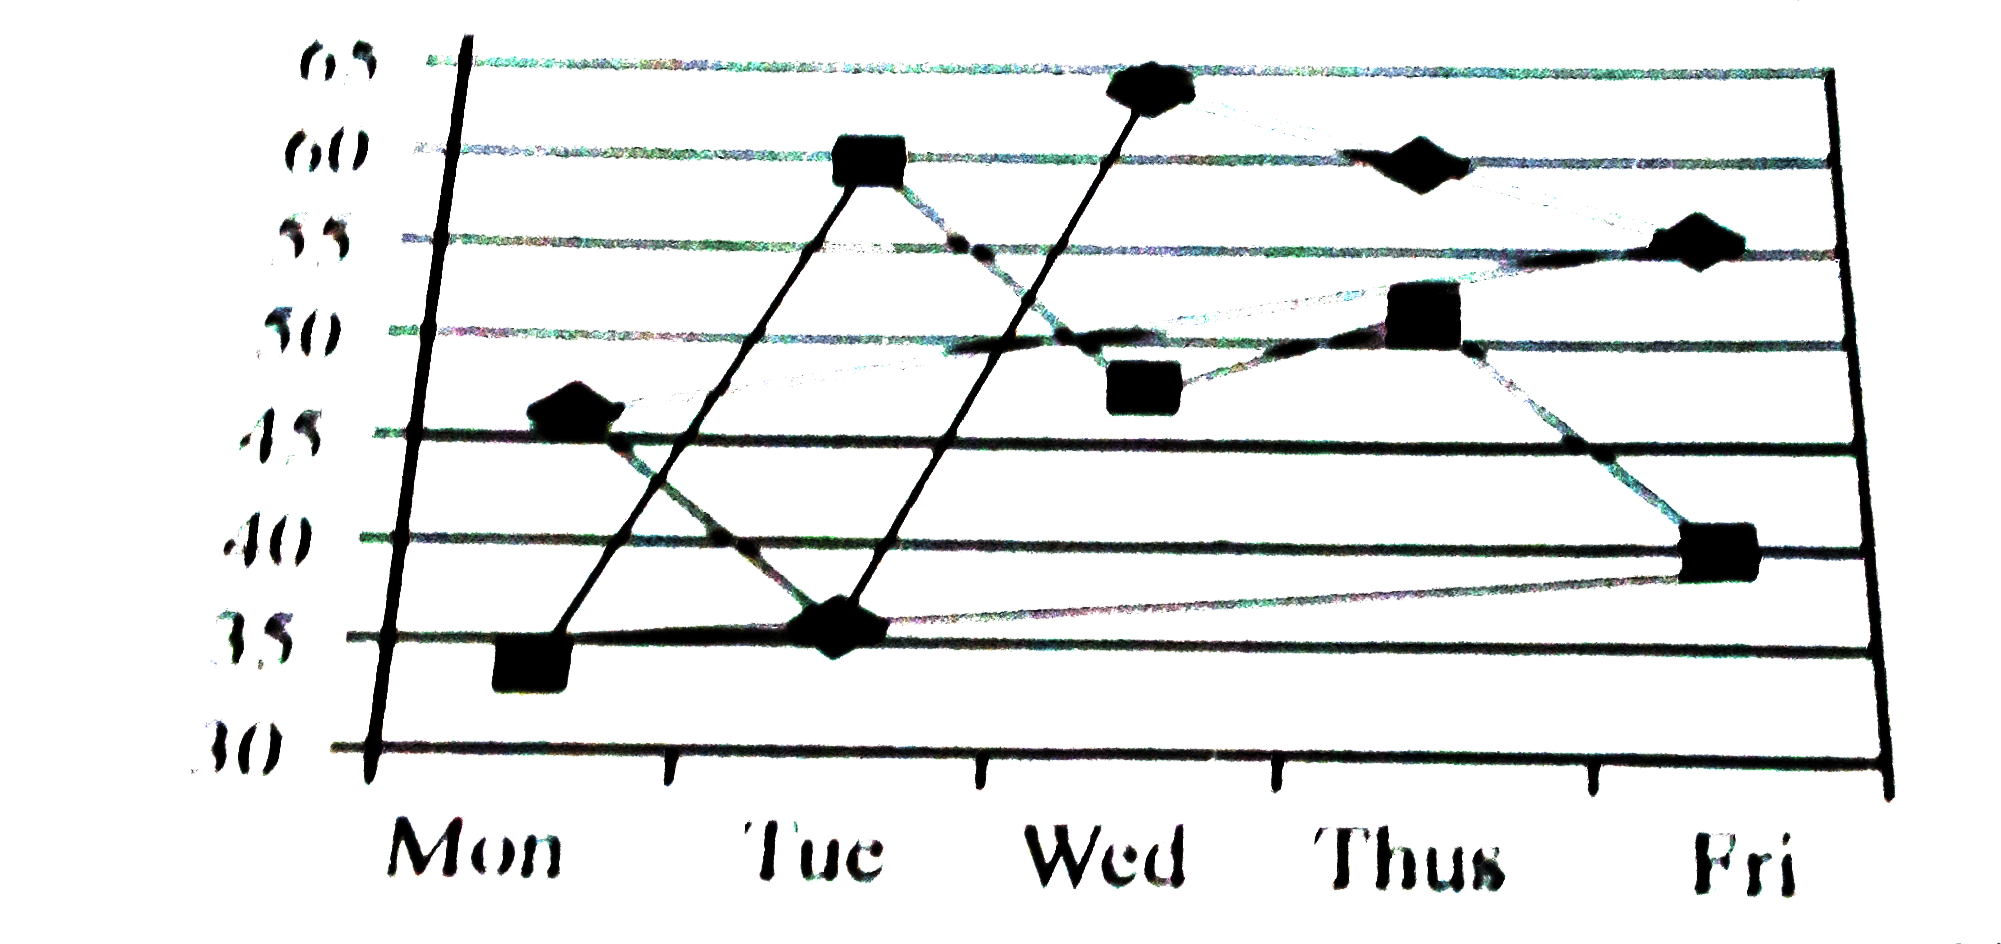
The total number of sold by P and Q together on Wednesday is how much percentage more than the number of mobiles sold by P and Q together on Tuesday ?View SolutionDirection: Study the following information carefully and answer the given questions: The following pie chart shows the percentage distribution of total number of Apples (Dry +dry)
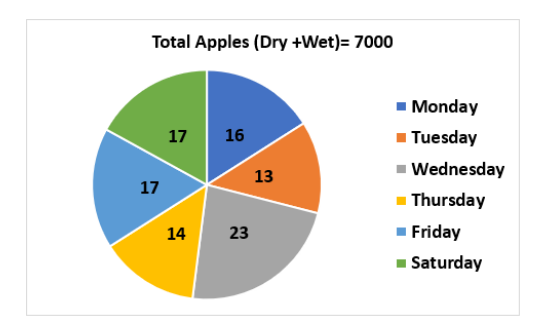
The pie chart2 shows the percentage distribution of total number of Apples (Wet) sold in different days of a week.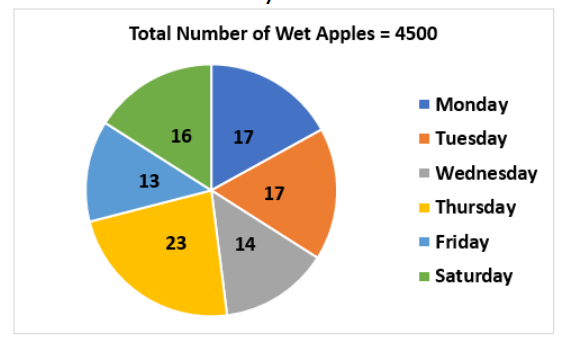
What percentage of dry apples sold on Monday and Tuesday together?View SolutionDirections: Read the following Pie chart carefully and answer the following questions:- The pie chart shows the percentage of candidates in 6 different shifts of an examination. Total number of candidates = 5500
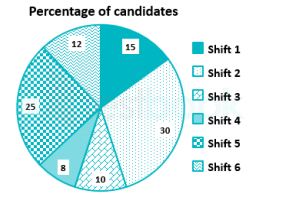
Find the average number of candidates in shift 2, shift 3 and shift 4 together in the examination.View Solution

