The given pie chart shows percentage, distribution of various expense of a family in a given month.
Study the graph carefully and answer the following questions.
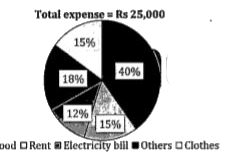
What is the average expense on Rent, Electricity bill and Others?
Rs 5000
Rs 3000
Rs 3750
Rs 2750
The correct Answer is:C
Topper's Solved these Questions
- DATA INTERPRETATIONBOOK - ADDA247CHAPTER - DATA INTERPRETATIONEXERCISE - Prelims Questions (Level-1)
54 Videos
- DATA INTERPRETATIONBOOK - ADDA247CHAPTER - DATA INTERPRETATIONEXERCISE - Prelims Questions (Level-2)
59 Videos
- DATA INTERPRETATIONBOOK - ADDA247CHAPTER - DATA INTERPRETATIONEXERCISE - Previous Year Questions
56 Videos
- BOAT AND STREAM BOOK - ADDA247CHAPTER - BOAT AND STREAM EXERCISE - Previous Year Question
22 Videos
- DATA SUFFICIENCY BOOK - ADDA247CHAPTER - DATA SUFFICIENCY EXERCISE - PREVIOUS YEAR QUESTIONS
25 Videos
Similar Questions
The pie-chart shows the breakup in percent age of the various expenses of a Company. Study the diagram and answer the following questions.
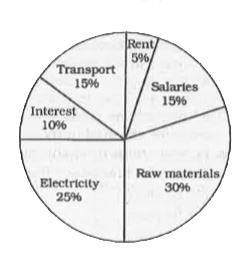
Which is the second biggest expense of the company?
View SolutionThe pie-chart shows the breakup in percent age of the various expenses of a Company. Study the diagram and answer the following questions.
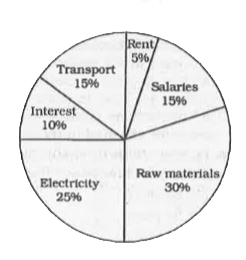
The company's expenditure on interest is greater than expenditure on rent by:
View Solution
Knowledge Check
The given pie chart shows the percentage distribution of 450 employees in an organisation. Study the pie chart and answer the question that follows.
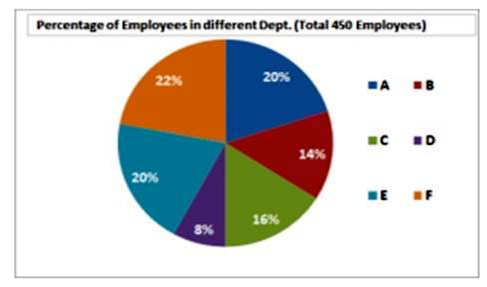
What is the number of employees working in departmetn B?A90B72C36D63The pie chart given below shows the spending of a family on various heads during a month. Study the graph and answer the following questions.
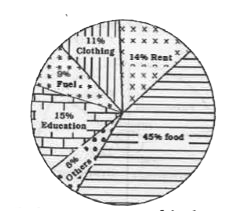
What is the ratio of the expenses on Education to the expenses on Food?A1:3B3:1C3:5D5:3The pie chart given below shows the spending of a family on various heads during a month. Study the graph and answer the following questions.
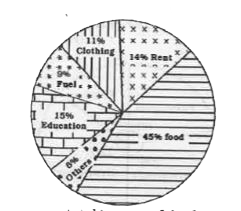
Expenditure on Rent is what percent of expenditure on Fuel?A135%B156%C167%D172%
The bar-graph given below shows the percentage distribution of total expenditures of a company under various expense heads during 2013. Study the graph and answer the given questions.
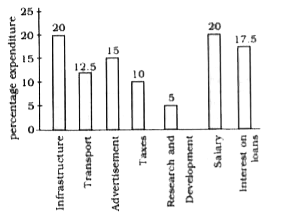
The ratio of the total expenditure on infrastructure and transport to the total expenditure on taxes and interest on loans is
View SolutionThe given pie chart shows the percentage distribution of 450 employees in an organisation. Study the pie chart and answer the question that follows
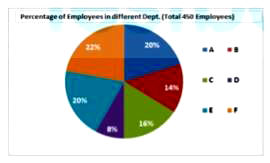
What is the central angle of the sector representing the number of employees in department A ?
View SolutionThe following pie-chart shows the percentage distribution of the expenditure incurred in publishing a book. Study the pie-chart and answer the questions based on it.
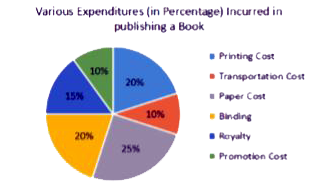
What is the central angle of the sector corresponding to the expenditure incurred on binding?
View SolutionThe pie chart given below shows the spendings of a family on various heads during a month. Study the graph and answer the questions
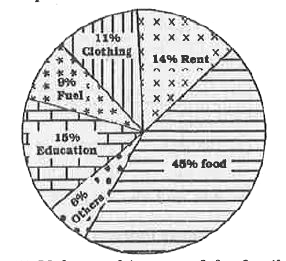
What is the ratio of the expenses on Education to the expenses on Food?
View SolutionThe pie chart given below shows the spending of a family on various heads during a month. Study the graph and answer the following questions.
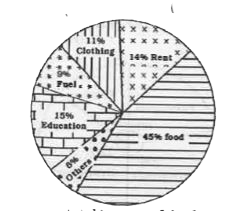
Which three expenditures together have a central angle of 108∘?
View Solution
