Study the pie chart given below and answer the following questions. Pie chart shows the percentage distribution of total distance travelled by Anurag on 5 days (Monday, Tuesday, Wednesday, Thursday and Friday).
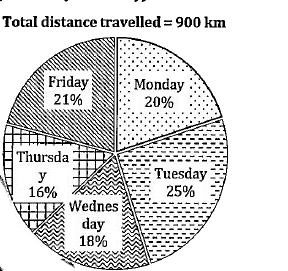
If on Sunday Anurag travelled 250% of the distance travelled by him on Monday and time taken by Anurag to travel whole distance on Sunday is 20 hours, then find average speed of Anurag on Sunday.
25 km/hr
30 km/hr
22.5 km/hr
20 km/hr
The correct Answer is:C
Step by step video & image solution for Study the pie chart given below and answer the following questions. Pie chart shows the percentage distribution of total distance travelled by Anurag on 5 days (Monday, Tuesday, Wednesday, Thursday and Friday). If on Sunday Anurag travelled 250% of the distance travelled by him on Monday and time taken by Anurag to travel whole distance on Sunday is 20 hours, then find average speed of Anurag on Sunday. by Maths experts to help you in doubts & scoring excellent marks in Class 14 exams.
Topper's Solved these Questions
- BOOK - ADDA247CHAPTER - DATA INTERPRETATIONEXERCISE - Prelims Questions (Level-2)59videos
DATA INTERPRETATION
- BOOK - ADDA247CHAPTER - DATA INTERPRETATIONEXERCISE - Mains Questions33videos
DATA INTERPRETATION
- BOOK - ADDA247CHAPTER - DATA INTERPRETATIONEXERCISE - Basic Questions30videos
DATA INTERPRETATION
- BOOK - ADDA247CHAPTER - BOAT AND STREAM EXERCISE - Previous Year Question22videos
BOAT AND STREAM
- BOOK - ADDA247CHAPTER - DATA SUFFICIENCY EXERCISE - PREVIOUS YEAR QUESTIONS25videos
DATA SUFFICIENCY
Similar Questions
Knowledge Check
- Question 1 - Select One
In the previous question, the total distance traveled is
Aαβt24(α+β)Bαβt22(α+β)C2αβt2(α+β)D4αβt2(α+β) - Question 2 - Select One
If the distance travelled by Truck C on Wednesday was 986 km what was the time taken by it to travel that distance ?
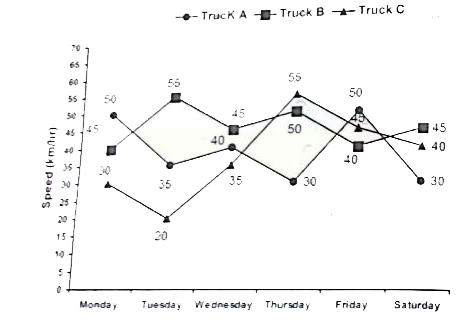 A26635 hrsB25435 hrsC22335 hrsDNone of these
 - Question 3 - Select One
The graph given here shows a car following the linear path with uniform speed. Study the graph and answer the questions.
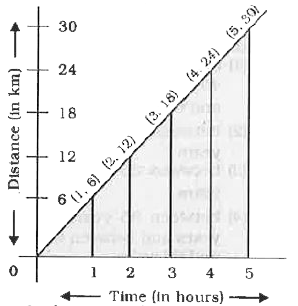
The distance travelled by the car in 4.5 hours isA27 kmB30 kmC36 kmD40 km
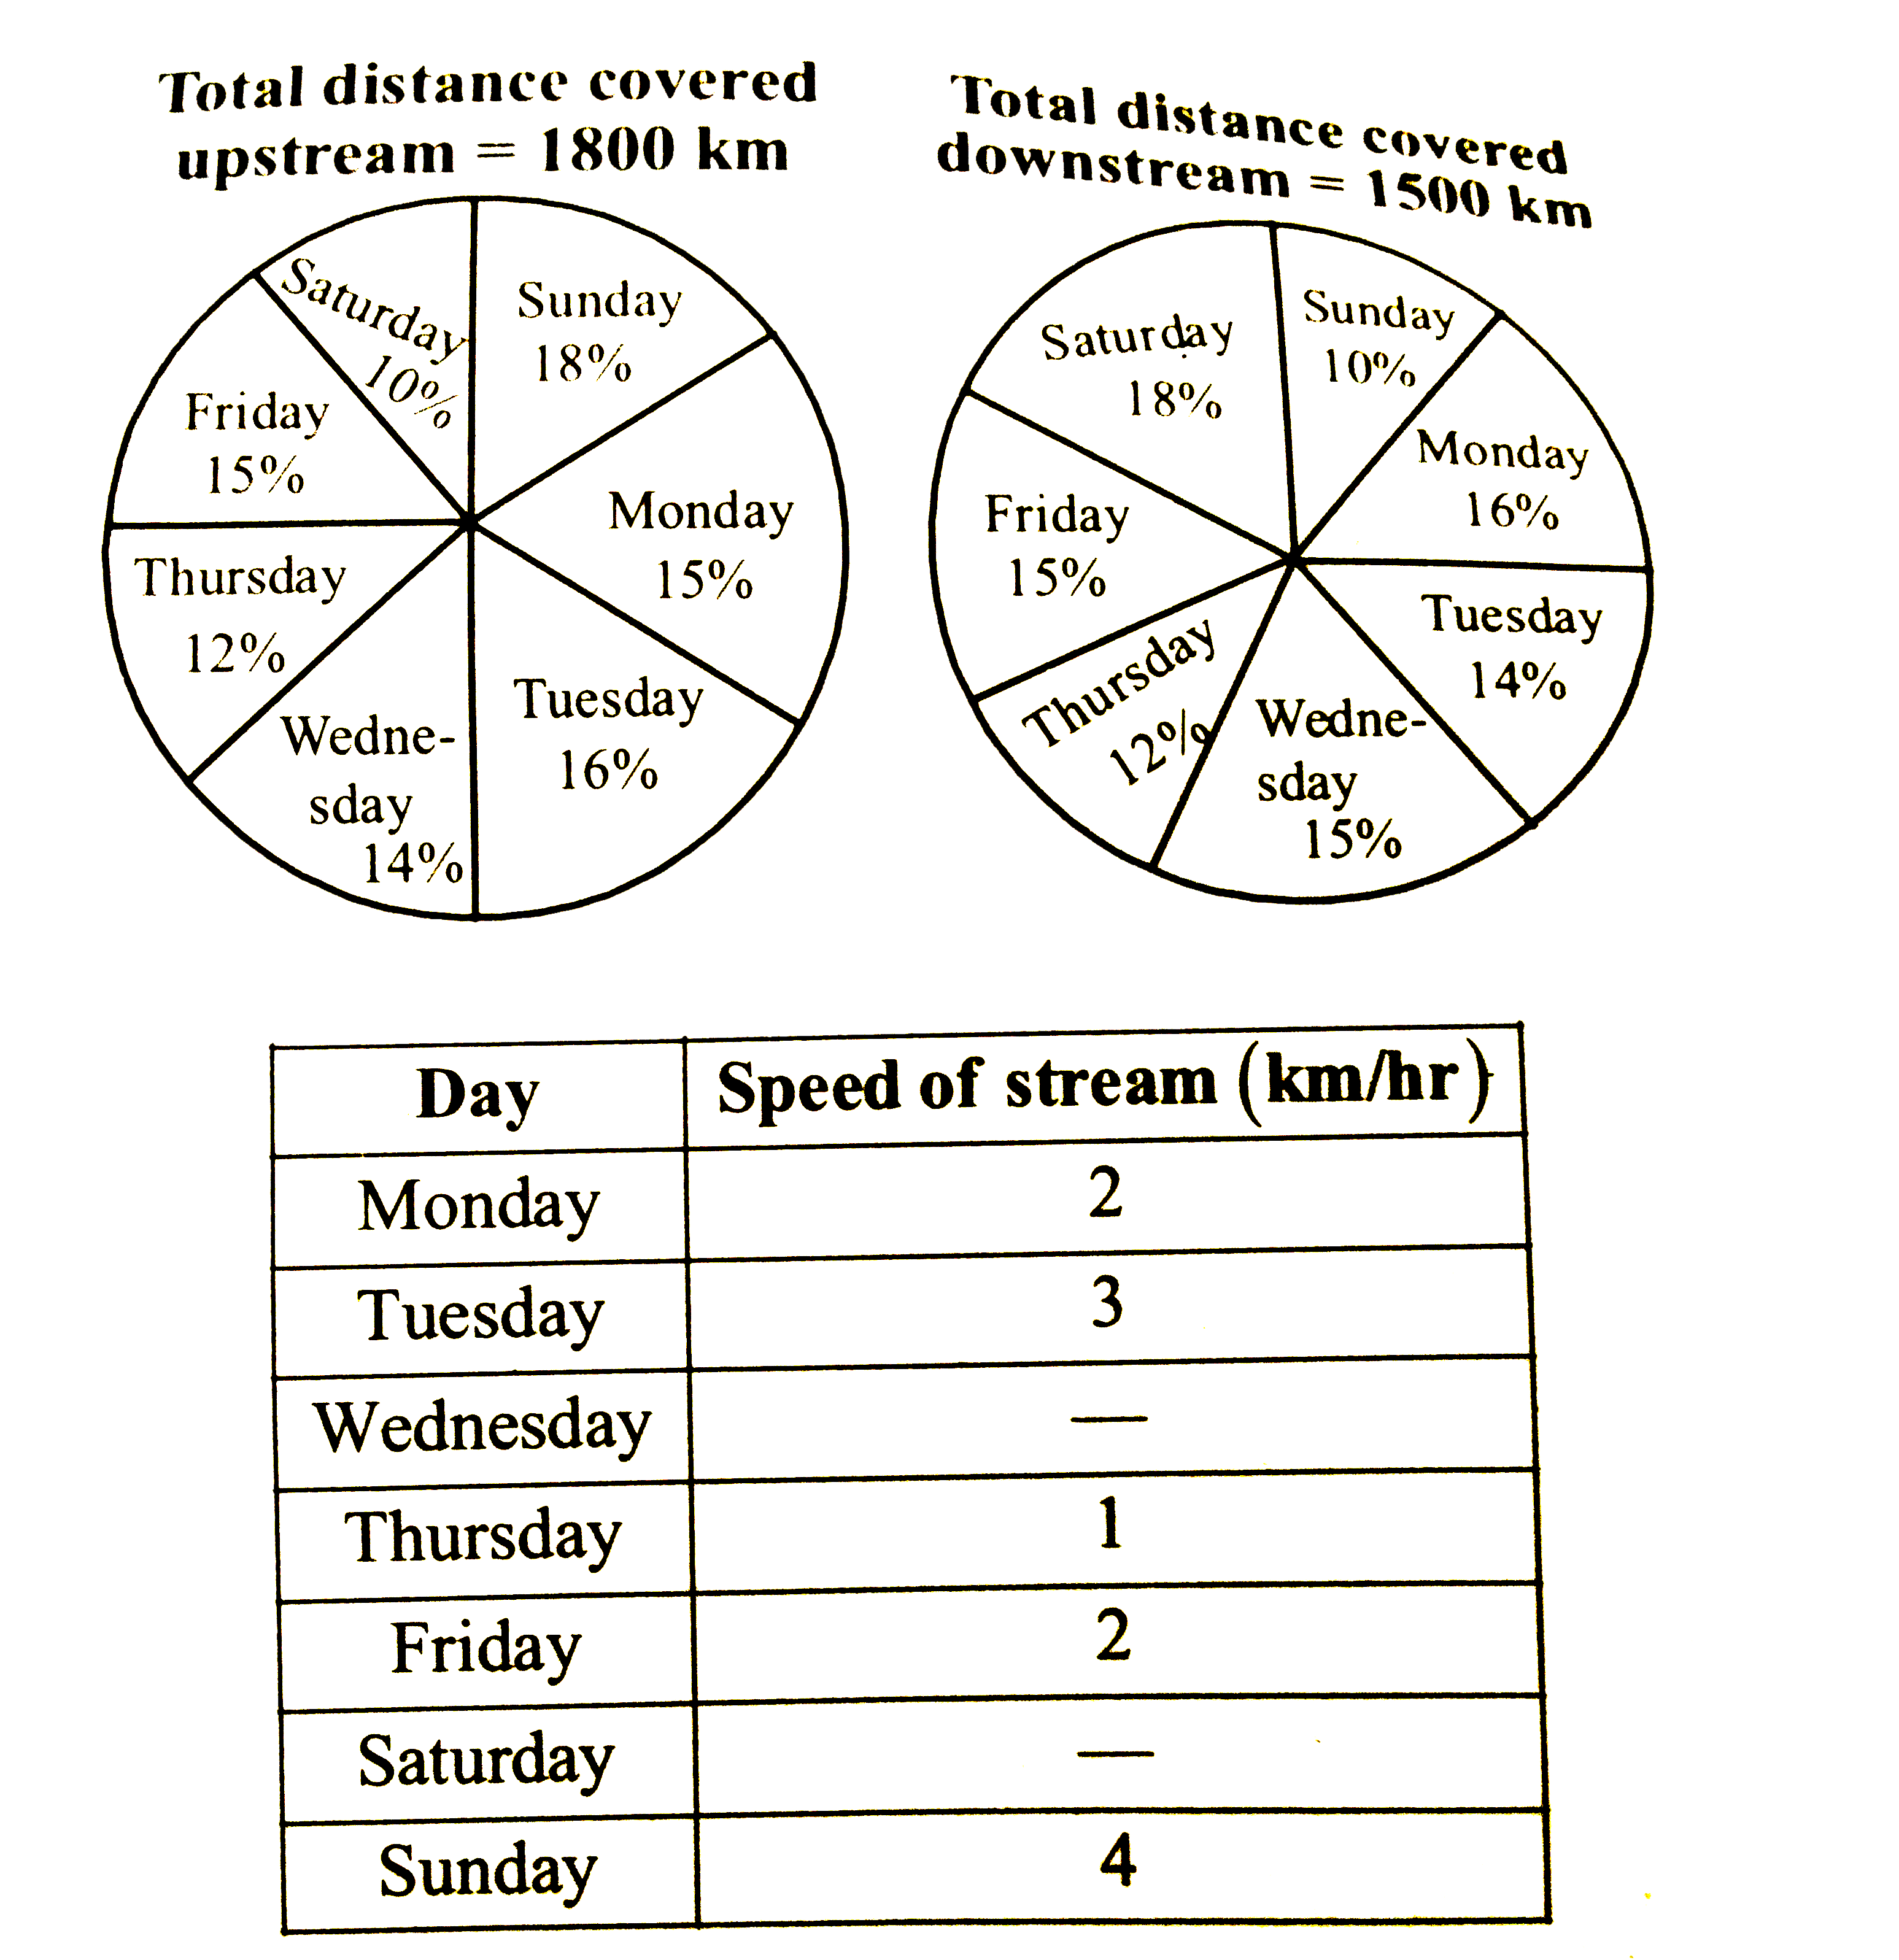
If the taken by boat to travel upstream on Monday is 4511 hrs. more than the time taken by it to travel downstream on the day, then find the speed of boat in still water on Monday ?View SolutionStudy the following information carefully and answer the given questions.
The following chart shows the opening, closing, high and low price of a share of a company XYZ on given 5 days-Monday, Tuesday, Wednesday, Thursday and Friday.
Opening and closing price of the shares of the company XYZ are represented by ceiling and floor of the black box and floor and ceiling of the white box respectively. The high and low price of the share of the company XYZ are represented by ceiling and floor of the line respectively
For example: On Monday, opening price = 60, closing price = 52, high price = 66 and low price = 40
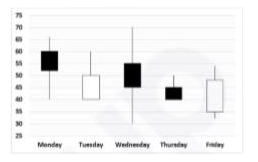
What is the ratio of average high price and average low price of the share of the company XYZ on Monday, Tuesday, Wednesday and Friday?View SolutionObserve the following frequency distribution table. It shows the distances travelled by 60 public transport buses in a day. Find the median of the distance travelled.
 View Solution
Complete the series -
Sunday, Monday, Wednesday, Saturday, Wednesday, Monday, ......View SolutionStudy the following pie chart carefully and answer the questions. The pie chart represents the percentage of people involved in various occupations.
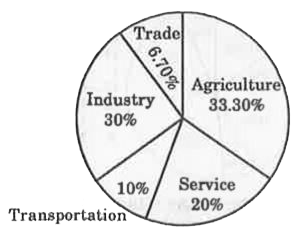
The ratio of the people involved in service to that in industry isView Solution

