Given below pie chart shows percentage distribution of total orders of ice cream purchased by five different shops and table shows percentage of orders of ice cream sold by these five shops. Read the data carefully and answer the questions.
Total orders of ice cream purchased by all shops together = 400
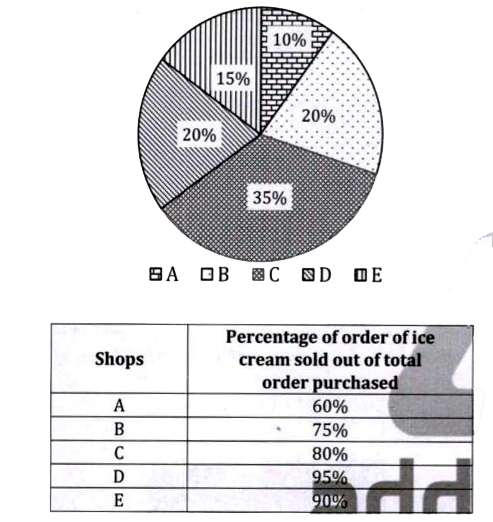
Find average number of unsold orders of ice cream for A, B & E?
14
12
16
18
The correct Answer is:A
Step by step video & image solution for Given below pie chart shows percentage distribution of total orders of ice cream purchased by five different shops and table shows percentage of orders of ice cream sold by these five shops. Read the data carefully and answer the questions. Total orders of ice cream purchased by all shops together = 400 Find average number of unsold orders of ice cream for A, B & E? by Maths experts to help you in doubts & scoring excellent marks in Class 14 exams.
Topper's Solved these Questions
Similar Questions
Direction :- Given below is the pie chart which shows the percentage distribution of a book 'XYZ'.
Published in 5 different stores.
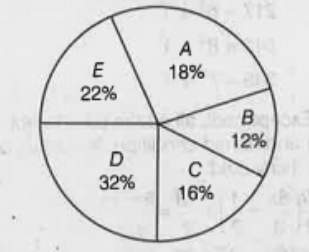
Total number of books = 550
Find the central angle for the book D.View SolutionThe following pie-chart shows the percentage-wise distribution of the number of students in five different schools P, Q, R, S and T. The total number of students in all five schools together is 8400.
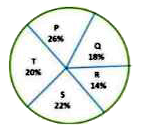
Find the average number of students in schools R and S together.View Solution
Knowledge Check
- Question 1 - Select One
The pie-chart shows the percentage-wise distribution of the number of students in five different schools P,Q,R,S and T .
The total number of students in all five schools together is 10,500 .
Study the pie -chart and answer the question .
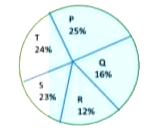
The difference between the central angles corresponding to schools T and R is :A42.8∘B44∘C43.2∘D34.5∘ - Question 2 - Select One
The pie-chart shows the percentage-wise distribution of the number of students in five different schools P,Q,R,S and T .
The total number of students in all five schools together is 10,500 .
Study the pie -chart and answer the question .
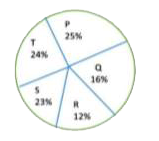
The number of students in school R is what per cent of the total number of students in schools Q and T together ?A40%B35%C25%D30% - Question 3 - Select One
Study the given information carefully and answer the questions that follow.
The given below graph shows the percentage distribution of the number of cakes baked by 5 shops (A, B, C, D and E) on a given day. Total number of cakes baked by the 5 shops were 400.
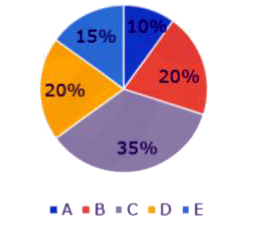
The given below table shows the percentage of cakes ordered from the five shops out of the baked cakes.
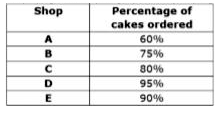
Note:
Number of cakes unsold = Number of cakes baked - Number of cakes ordered
All the ordered cakes are to be considered as cakes sold.
If the total number of cakes baked by all shops is distributed in a degree pie-chart, what would have been the central angle for shop C?A126∘B120∘C116∘D108∘
The table given below shows production of five types of cars by a company from the 1998 to 2003. Study the table and answer the questions.
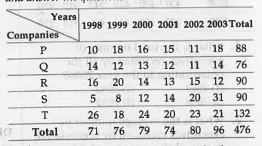
What is the ratio of total number of cars produced by all the companies together in the years 2003 and 1999?View SolutionStudy the given information carefully and answer the questions that follow.
The given below graph shows the percentage distribution of the number of cakes baked by 5 shops (A, B, C, D and E) on a given day. Total number of cakes baked by the 5 shops were 400.
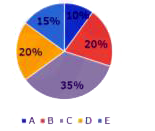
The given below table shows the percentage of cakes ordered from the five shops out of the baked cakes.
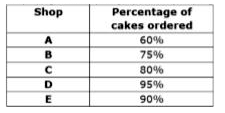
Note:
Number of cakes unsold = Number of cakes baked - Number of cakes ordered
All the ordered cakes are to be considered as cakes sold.
The number of cakes unsold from shop E is what percentage more than the number of cakes unsold from shop D?View SolutionStudy the given information carefully and answer the questions that follow.
The given below graph shows the percentage distribution of the number of cakes baked by 5 shops (A, B, C, D and E) on a given day. Total number of cakes baked by the 5 shops were 400.
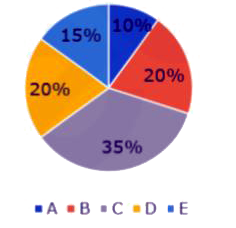
The given below table shows the percentage of cakes ordered from the five shops out of the baked cakes.
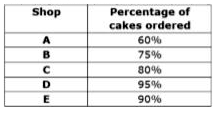
Note:
Number of cakes unsold = Number of cakes baked - Number of cakes ordered
All the ordered cakes are to be considered as cakes sold.
What is the ratio of the number of cakes baked by shop C and the number of cakes sold by shop B?View SolutionStudy the given information carefully and answer the questions that follow.
The given below graph shows the percentage distribution of the number of cakes baked by 5 shops (A, B, C, D and E) on a given day. Total number of cakes baked by the 5 shops were 400.
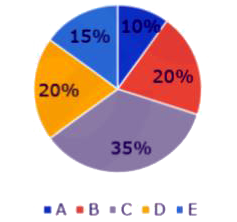
The given below table shows the percentage of cakes ordered from the five shops out of the baked cakes.
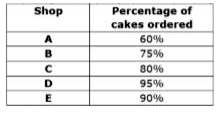
Note:
Number of cakes unsold = Number of cakes baked - Number of cakes ordered
All the ordered cakes are to be considered as cakes sold.
The number of cakes that were unsold from shops A, B and C, 25 % were given to the beggars. Of the remaining, 25 % were eaten by the staff of the shops while the rest were sold the next day at 10% loss. If, each cake costed Rs. 250 to bake for all the shops, what was the total amount earned from these cakes?View SolutionStudy the given information carefully and answer the questions that follow.
The given below graph shows the percentage distribution of the number of cakes baked by 5 shops (A, B, C, D and E) on a given day. Total number of cakes baked by the 5 shops were 400.
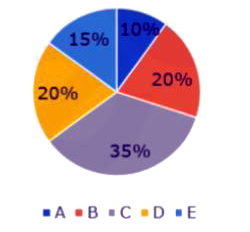
The given below table shows the percentage of cakes ordered from the five shops out of the baked cakes.
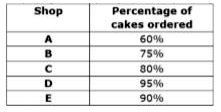
Note:
Number of cakes unsold = Number of cakes baked - Number of cakes ordered
All the ordered cakes are to be considered as cakes sold.
If the next day, number of cakes ordered increased by 20% for shop B, while the number of cakes baked by shop B remained the same, then the number of cakes unsold by Shop B is more than how many shops?View Solution

