The line graph given below shows the total number of posts (Photos + Videos) shared by six (A, B, C, D, E & F) people in December 2019. Read the data carefully and answer the questions.
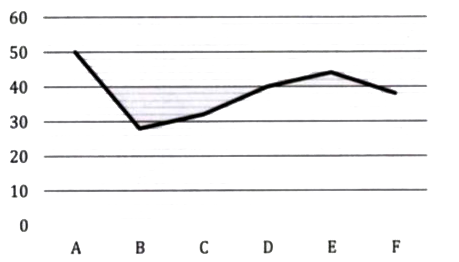
In January 2020 total posts shared by B & F is 12 and 15 more than previous month respectively, then find the total number of the post shared by B & F in January 2020?
95
91
93
97
The correct Answer is:C
Step by step video, text & image solution for The line graph given below shows the total number of posts (Photos + Videos) shared by six (A, B, C, D, E & F) people in December 2019. Read the data carefully and answer the questions. In January 2020 total posts shared by B & F is 12 and 15 more than previous month respectively, then find the total number of the post shared by B & F in January 2020? by Maths experts to help you in doubts & scoring excellent marks in Class 14 exams.
Updated on:21/07/2023Topper's Solved these Questions
Similar Questions
Direction: Study the data carefully and answer the following questions. Following is the production data by 4 persons during 2 months.
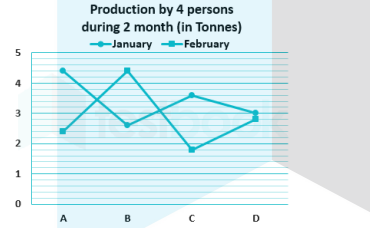
Find the total production by A in February month and by C in January month.
View SolutionDirections: The following bar graph shows the number of pages in five different books (viz. A, B, C, D and E). Study the graph carefully and answer the following questions.
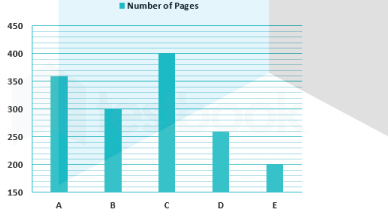
What is the ratio of total number of pages in book B and E together to the total number of pages in book C and D together?
View Solution
Knowledge Check
Read the following table carefully and answer the questions given below.

If number of appeared students from school B and F in 1998 and 2000 are 4000 and 5000 respectively, what is thte total number of passed students from school B and F in the same years?A4320B4220C4360D4230Study the following table carefully and answer the questions given below :

What is the percentage of students studying Management with respect to the total number of students studying in the institute B ?A10%B20%C30%D5%In a triple bond total number of share electrons are
A3 electronsB4 electronsCSeveral electronsD6 electrons
Study the graph carefully and answer the question below
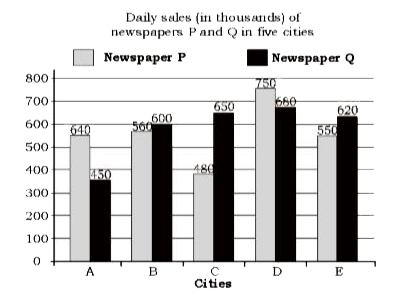
The total daily sales of newspaper P in cities B D and E in what percentage less than that of newspaper Q in cities A,C D and E?
View SolutionStudy the following graph carefully and answer the question given below it.
Production and sale of printers of various companies in a month.
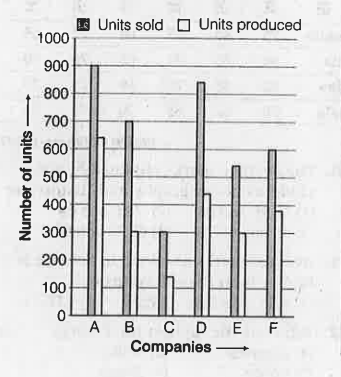
The total produced by the companies A B and C together is
View SolutionThe bar graph, given here, shows the number of tickets sold by 6 students A, B, C, D, E and F during a fair. Observe the graph and answer questions based on it.
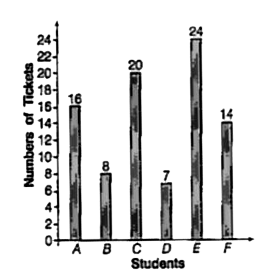
Total number of tickets sold by A, B and C is
View SolutionThe bar graph, given here, shows the number of tickets sold by 6 students A, B, C, D, E and F during a fair. Observe the graph and answer questions based on it.
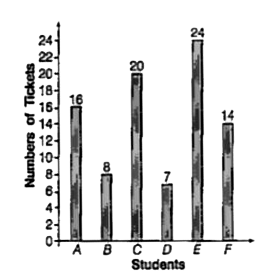
Total number of tickets sold by D, E and F is
View SolutionStudy the following graph carefully and answer the questions given below it :-
Number of people working in various departments of two different organisation:
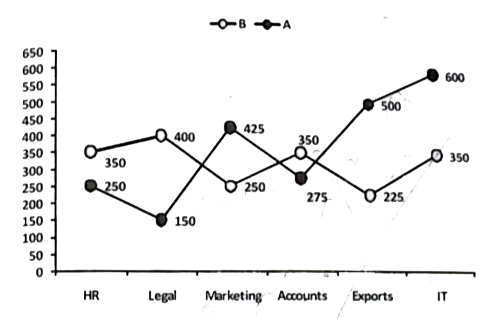
What is the total number of people working in organisation B?
View Solution
