The line graph given below shows the total number of posts (Photos + Videos) shared by six (A, B, C, D, E & F) people in December 2019. Read the data carefully and answer the questions.

Total photos shared by E is four more than total videos shared by him, then find total videos shared by E?
24
20
28
22
The correct Answer is:B
Step by step video, text & image solution for The line graph given below shows the total number of posts (Photos + Videos) shared by six (A, B, C, D, E & F) people in December 2019. Read the data carefully and answer the questions. Total photos shared by E is four more than total videos shared by him, then find total videos shared by E? by Maths experts to help you in doubts & scoring excellent marks in Class 14 exams.
Updated on:21/07/2023Topper's Solved these Questions
Similar Questions
Table given below shows marks obtained by four students in four different subjects in an exam. Study the data carefully and answer the following questions.
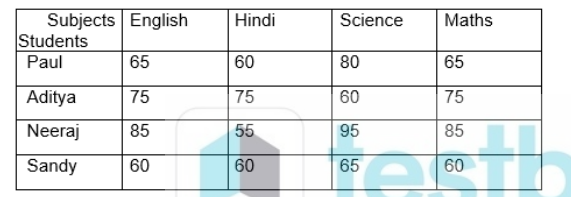
Total marks scored by Paul are how much more/less than total marks scored by Neeraj?
View SolutionBar graph given below shows pens sold by a retailor on five different days. Study the data carefully and answer the following questions.
Pen sold on different days
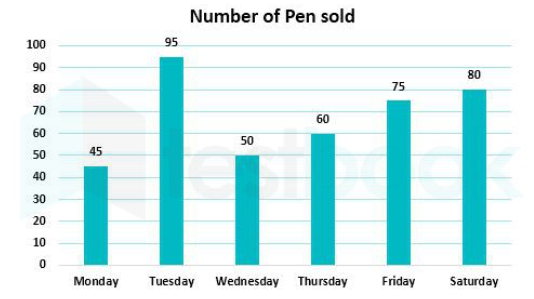
what is the average number of pens sold during a week if total number of pens sold on saturday is 25% more than total number of pens sold on Sunday .
View Solution
Knowledge Check
The bar graph, given here, shows the number of tickets sold by 6 students A, B, C, D, E and F during a fair. Observe the graph and answer questions based on it.
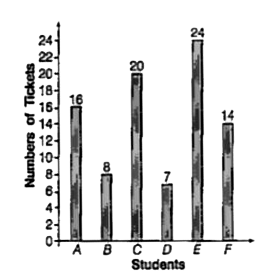
Total number of tickets sold by D, E and F isA47B46C45D44The bar graph, given here, shows the number of tickets sold by 6 students A, B, C, D, E and F during a fair. Observe the graph and answer questions based on it.
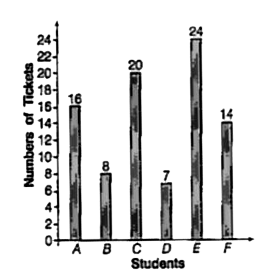
Total number of tickets sold by A, B and C isA45B44C42D40The bar graph shows the total number of male and female lives in four different towns and table shows the number of males and females whose ages are above 40 years. Read the data carefully and answer the questions below:
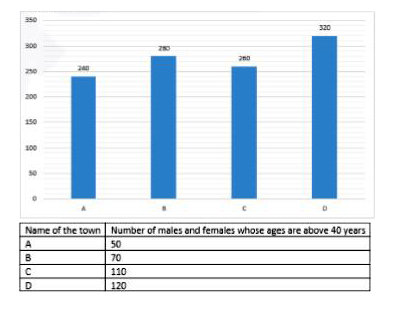
If in another town E, total males and females are 10% more than the total males and females in town A and those males and females whose ages are above 40 years is 20% more than those males and females whose ages are above 40 years in town C. find the number of those males and females in town E whose ages are below and equals to 40 years.A134B128C142D124
Directions: The following bar graph shows the number of pages in five different books (viz. A, B, C, D and E). Study the graph carefully and answer the following questions.
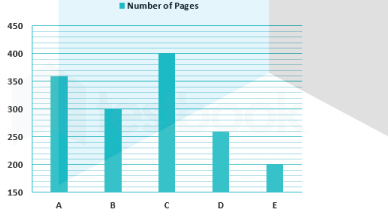
What is the ratio of total number of pages in book B and E together to the total number of pages in book C and D together?
View SolutionStudy the graph and answer the question
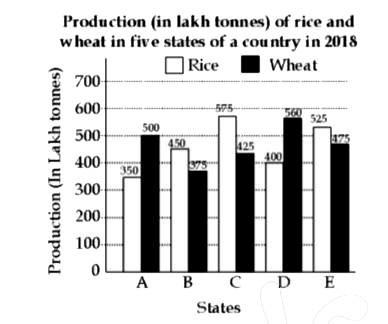
Total production of wheat in states A , B and E is what percentage less than the total production of rice in states C, D and E?
View SolutionPie chart given below shows total number of workers in three different companies. Table given below shows ratio between officers and workers working in these companies. Study the data carefully and answer the following questions
Total workers =900
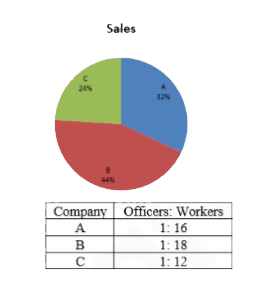
Note: total employees = officers + workers
Find the difference between total number of workers in company ‘A’ and total number of workers in company ‘B’ and ‘C’ together?
View SolutionDirections: The following table shows the number of bananas sold by 5 fruit sellers and the relation of apples with bananas in 3rd column. Read the table carefully and answer the following question.

Had Apples sold by A is only 10% more than bananas sold by A, then find the ratio of the total number of bananas sold by B, C and E to the total number of apples sold by A, D and E.
View SolutionStudy the graph and answer the question.
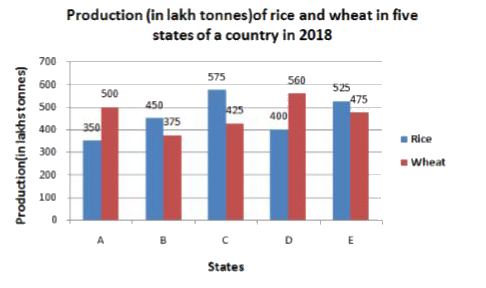
Total production of wheat in states A, B and E is what percentage less than the total production of rice in states C, D and E?
View Solution
