Line graph given below shows number of passengers travelling in five (A, B, C, D & E) different compartment of a trains. Read the data carefully and answer the questions.
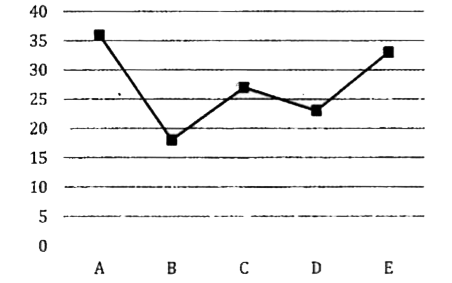
Find total number of passengers traveling in B, C & D together?
69
65
67
63
The correct Answer is:C
Step by step video & image solution for Line graph given below shows number of passengers travelling in five (A, B, C, D & E) different compartment of a trains. Read the data carefully and answer the questions. Find total number of passengers traveling in B, C & D together? by Maths experts to help you in doubts & scoring excellent marks in Class 14 exams.
Topper's Solved these Questions
Similar Questions
Directions: The following bar graph shows the number of pages in five different books (viz. A, B, C, D and E). Study the graph carefully and answer the following questions.
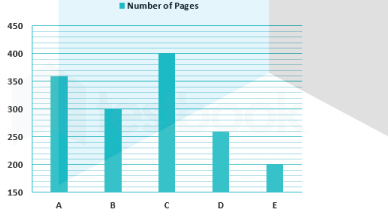
What is the ratio of total number of pages in book B and E together to the total number of pages in book C and D together?View SolutionBar graph given below shows pens sold by a retailor on five different days. Study the data carefully and answer the following questions.
Pen sold on different days
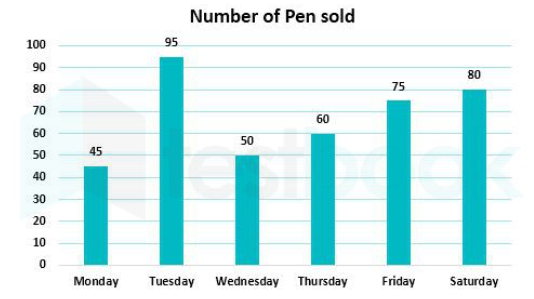
what is the average number of pens sold during a week if total number of pens sold on saturday is 25% more than total number of pens sold on Sunday .View Solution
Knowledge Check
- Question 1 - Select One
Study the graph carefully and answer the following questions.
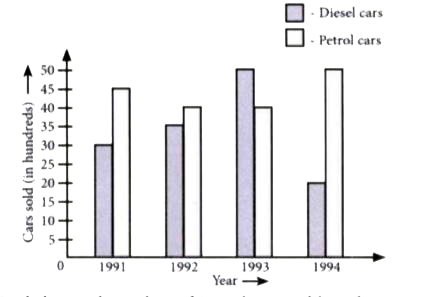
Find the total number of Diesel cars sold in the year 1992 and 1994 together.A2500B5500C1500D4500 - Question 2 - Select One
The following bar-diagram shows total number of males and females in five different organisations. Study it carefully to answer the questions.
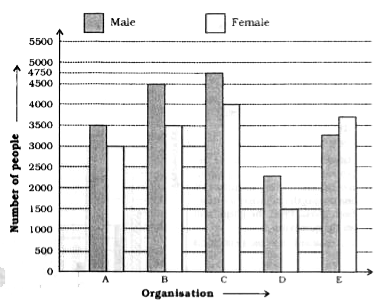
What is the ratio of average number of females from the organisations A, B and C to the average number of males from the organisations C, D and E?A42:41B41:42C40:41D41:40 - Question 3 - Select One
The following bar-diagram shows total number of males and females in five different organisations. Study it carefully to answer the questions.
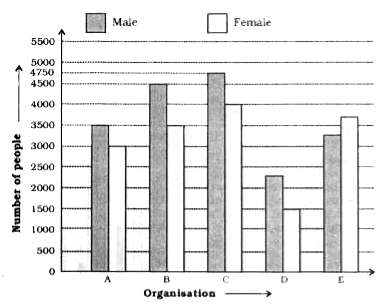
What is the difference between the total number of females and the total number of males from all the organisations together?A2005B2050C2500D2055
Bar graph given below shows pens sold by a retailor on five different days. Study the data carefully and answer the following questions.
Pen sold on different days
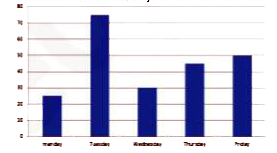
Find the difference between total number of pens sold on Monday and Tuesday together to total number of pens sold on Thursday and Friday together?View SolutionThe following bar-diagram shows total number of males and females in five different organisations. Study it carefully to answer the questions.
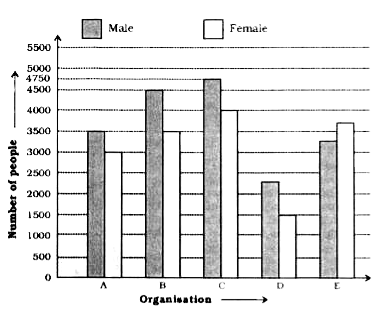
What is the ratio of the number of females from the organisations B and C to the number of males from the organisations D and E?View SolutionThe given bar graph represents the number of boys and girls in five different schools. Read the graph and answer the question that follows.
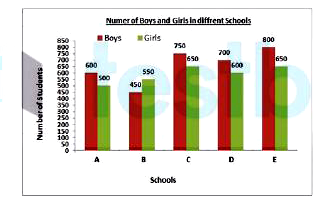
What is the average number of students (girls and boys) in schools A, B, C, D and E ?View SolutionThe bar graph, given here, shows the number of tickets sold by 6 students A, B, C, D, E and F during a fair. Observe the graph and answer questions based on it.
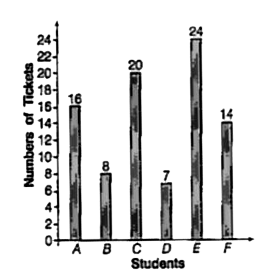
Total number of tickets sold by A, B and C isView SolutionThe following bar-diagram shows total number of males and females in five different organisations. Study it carefully to answer the questions.
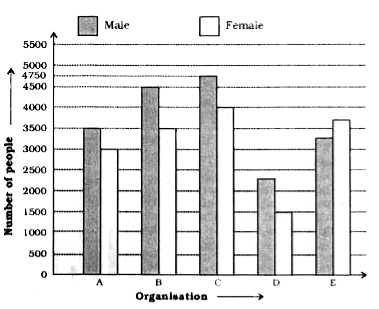
Males from organisations A and B together form what per cent of total number of males from organisations C, D and E together?View Solution

