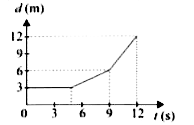
The distance-time graph of a motorcycle is shown in the figure. When was the motorcycle travelling at a speed of 2 ms−1?
A
2.5 s
B
5.0 s
C
8.0 s
D
10.5 s
Video Solution
Text Solution
The correct Answer is:D
From the given distance-time graph of a motorcycle, initially distance was same, for time interval 0 to 3 s. Hence speed of motorcycle was zero and it was in rest.
From 3 m to 6 m, motorcycle was moving with uniform speed but it took more than 3 s, so speed would be less than 1 m s−1. From 6 m to 12 m, motorcycle was also moving with uniform speed.
∴ Speed of motorcycle = Change in distanceChange in time
= (12−6)m(12−9)s=6m3s=2ms−1
Hence the motorcycle was travelling at a speed of 2 m s−1 at 10.5 s.
|
Updated on:21/07/2023
Topper's Solved these Questions
- BOOK - SCIENCE OLYMPIAD FOUNDATION CHAPTER - NSO QUESTION PAPER 2017- 18 SET - BEXERCISE - ACHIEVERS SECTION3videos
NSO QUESTION PAPER 2017- 18 SET - B
- BOOK - SCIENCE OLYMPIAD FOUNDATION CHAPTER - NSO QUESTION PAPER 2018- 19 SET - BEXERCISE - ACHIEVERS SECTION1videos
NSO QUESTION PAPER 2018- 19 SET - B
Similar Questions
Knowledge Check
- Question 1 - Select One
The distance-time graph of a moving vehicle is as shown in the figure.
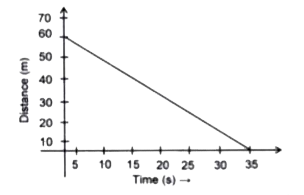 AThe speed of the vehicle is increasing with time.BThe speed of the vehicle is decreasing with time.CThe final speed of the vehicle is zero.DGraph is not possible.
 - Question 2 - Select One
The distance-time graph of an object shown in figure 2.E2.
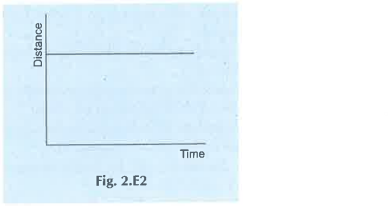
The objectAis at restBmoves with a constant speedCmoves with a constant velocityDmoves with a constant acceleration - Question 3 - Select One
The distance- time graph of a body is as shown in the figure. The part of the graph that represent the unifrom speed of the body is
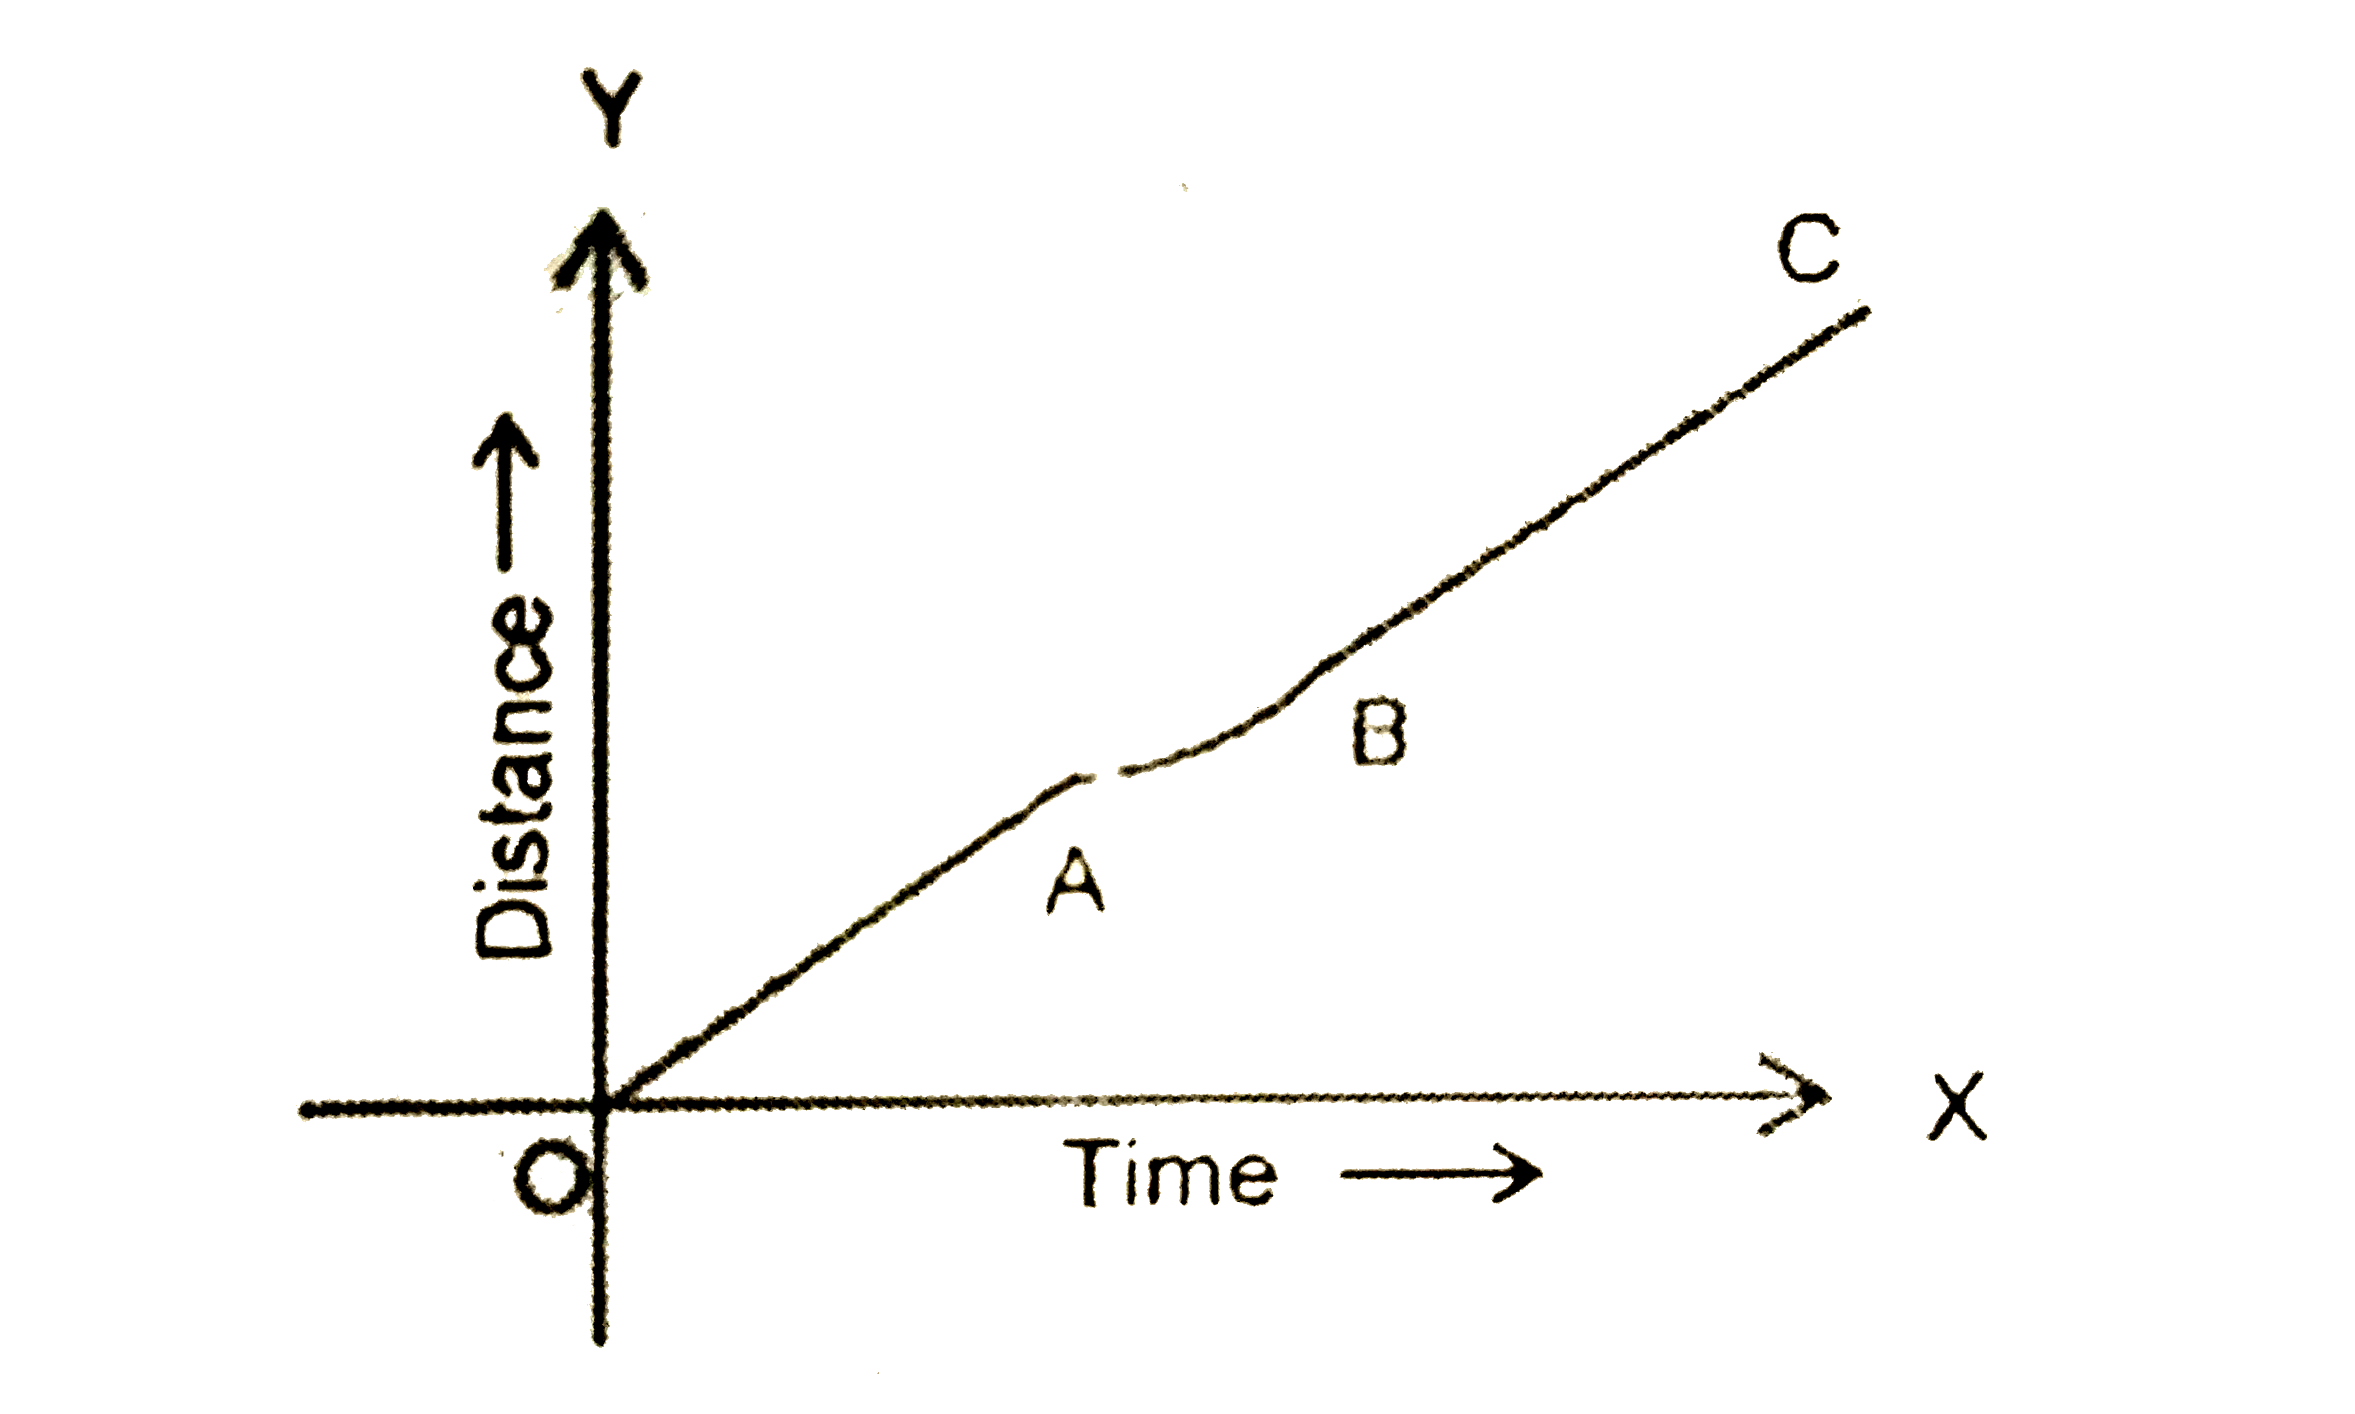 AOABABCBCDBoth OA and BC
The speed verses time graph for a particle is shown in the figure. The distance travelled (in m) by the particle during the time interval t = 0 to t = 5 s will be __________
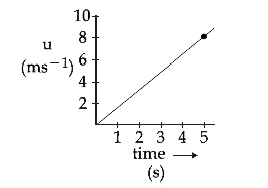 View Solution
The distance- time graph of a body is as shown in the figure. The part of the graph that represent the unifrom speed of the body is
 View Solution
Distance versus time graph of an object is as shown in the figure. The average speed of the object is _____ ms−1
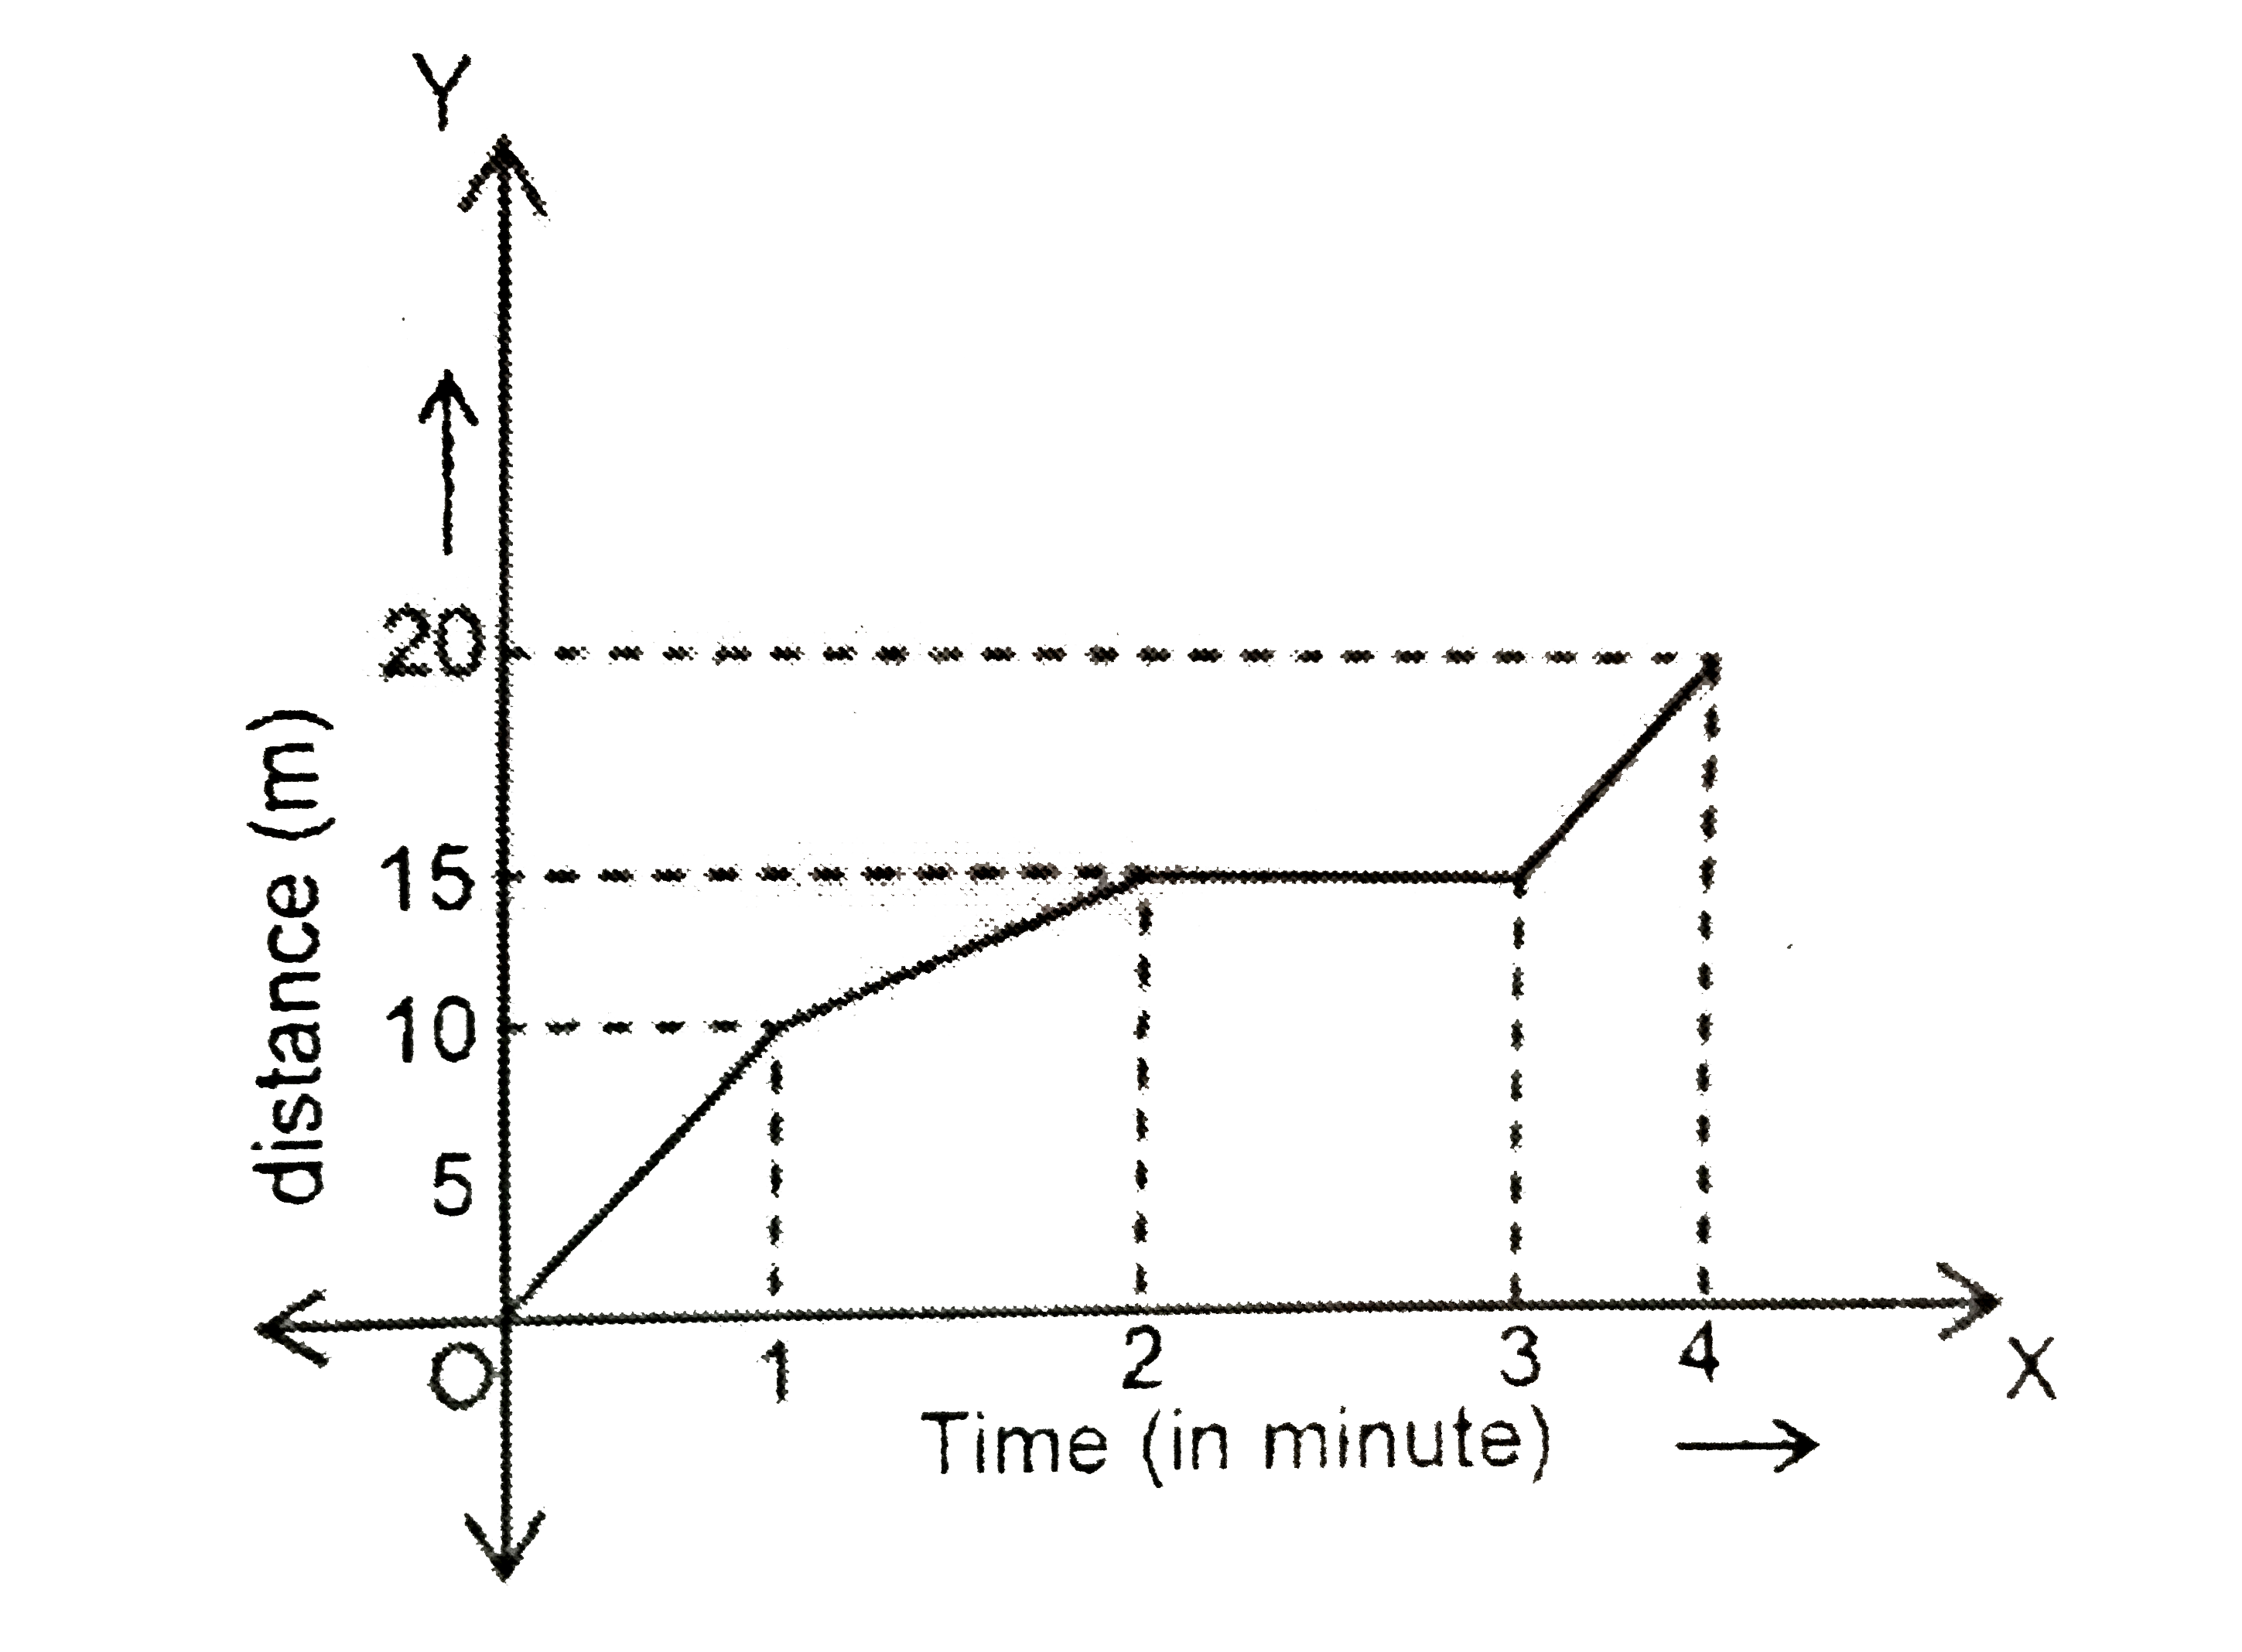 View Solution
Distance versus time graph of an object is as shown in the figure. The average speed of the object is _____ ms−1
 View Solution
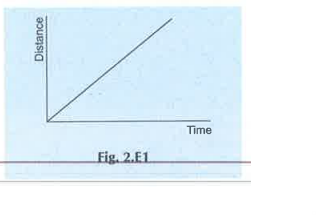
The distance-time graph of an object moving in a fixed direction is shown in figure 2.E1.
The objectView Solution


