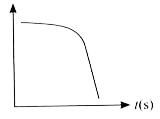
A speed-time (v-t) graph of an v(ms−1) object is shown in the figure. Which of the following best describes the graph?
The object travels at decreasing acceleration.
The object travels at constant deceleration.
The object travels at increasing deceleration.
The object travels at decreasing deceleration
The correct Answer is:C
From the given graph, speed of the object decreases with time. Rate of decreasing velocity (speed) increases with the time, so the object travels with increasing deceleration.
Topper's Solved these Questions
Similar Questions
Knowledge Check
Which of the following cannot be speed (v) - time (t) graph?
A B
B C
C D
D
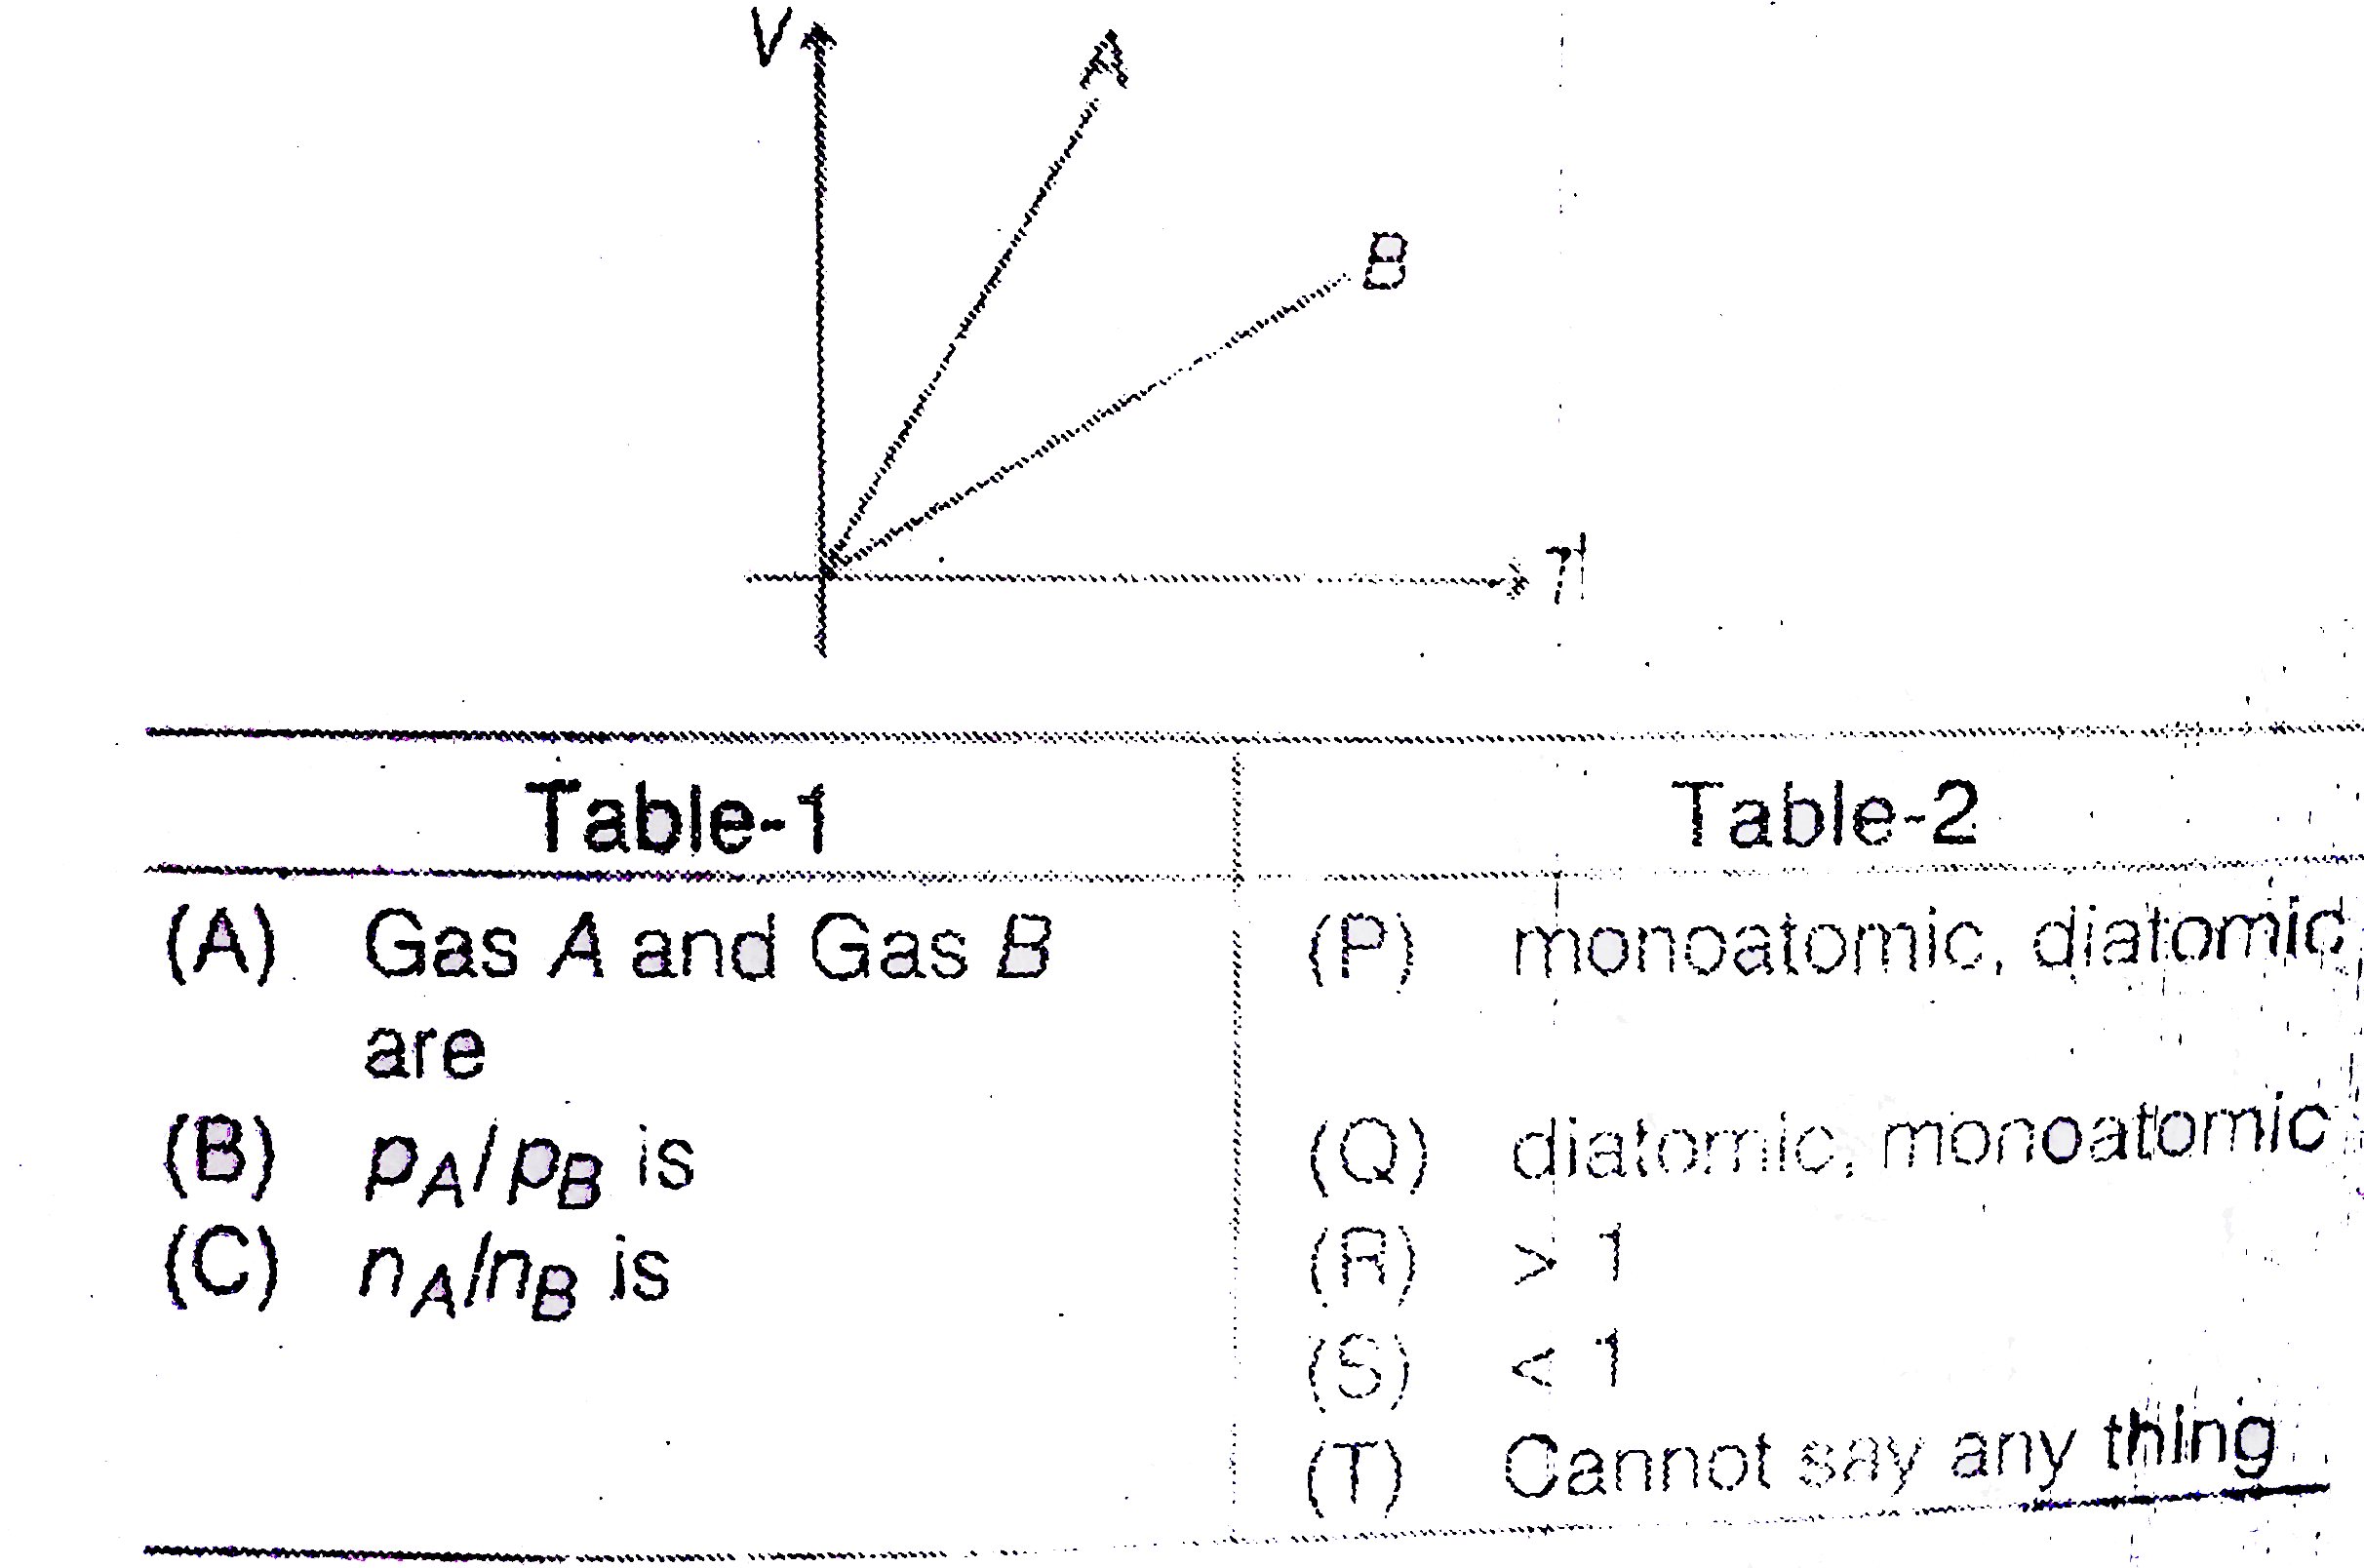
In the V-T graph shown in the figure match the following columns.
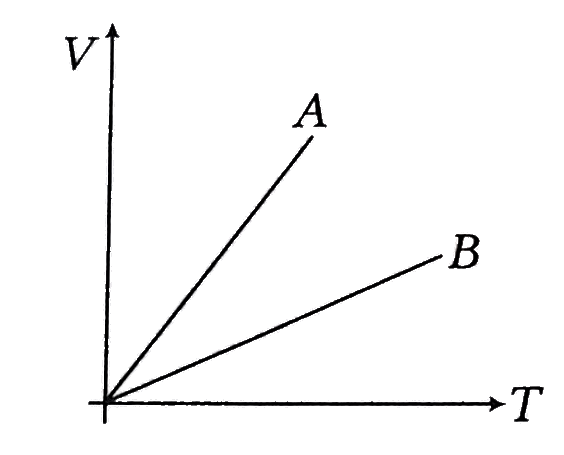
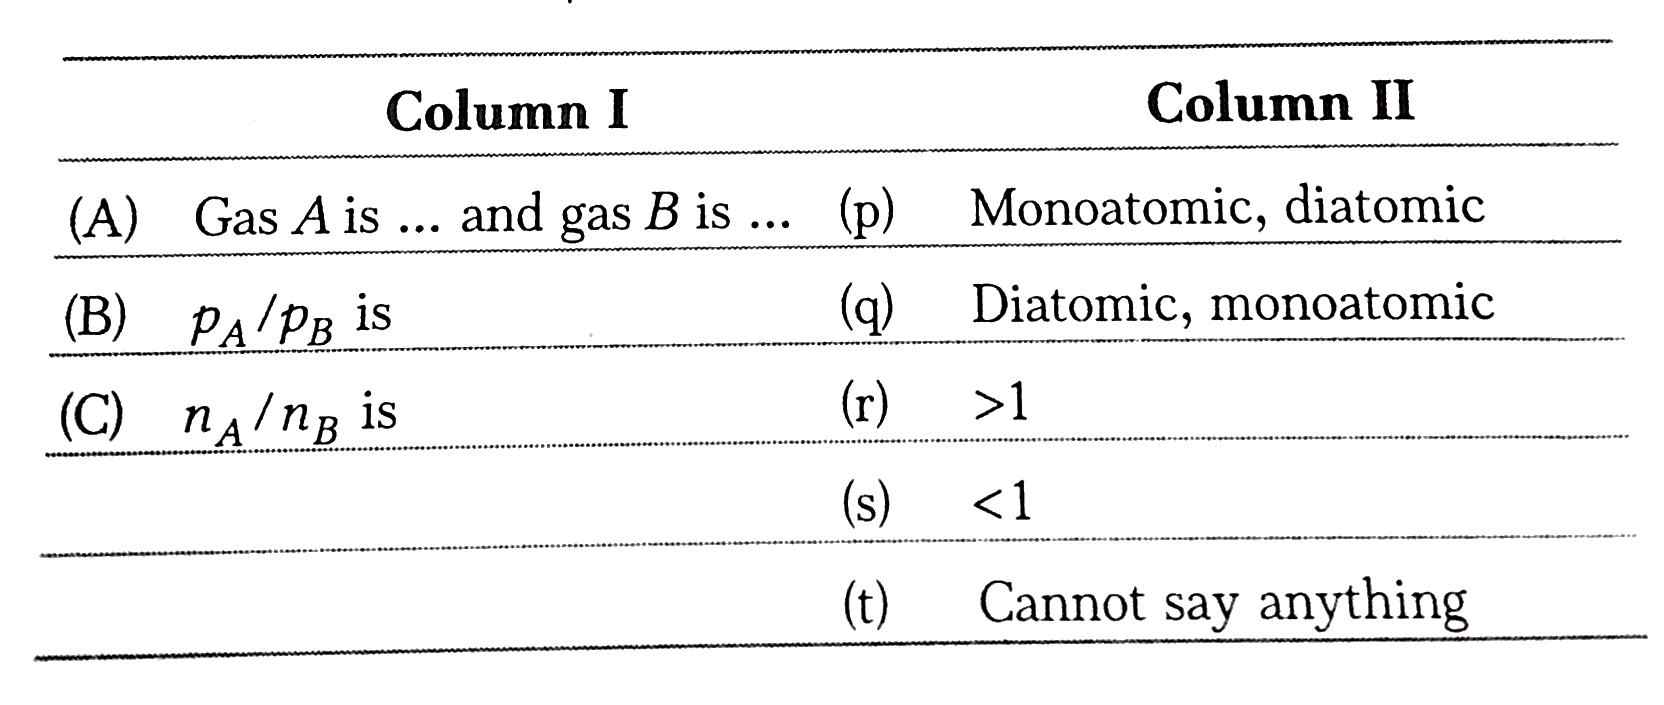
View SolutionIn the V-T graph shown in the figure match the following columns.


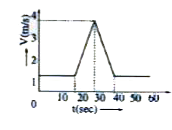
View SolutionVelocity-time (v-t) graph for a moving object is shown in the figure. Total displacement of the object during the time interval when there is non-zero acceleration and retardation is

View SolutionVelocity -time (v-t) graph for a moving object is shown in the figure .Total displacement of the object during the time interval when there is non-zero acceleration and reatardation is
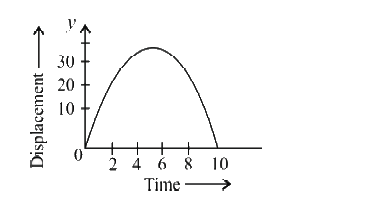
View SolutionThe displacement-time graph of a moving object is shown in figure. Which of the velocity-time graphs shown in figure could represent the motion of the same body ?
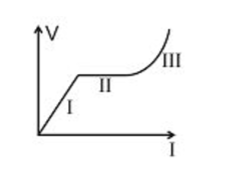
View SolutionVoltage V v/s I graph is shown in the figure.
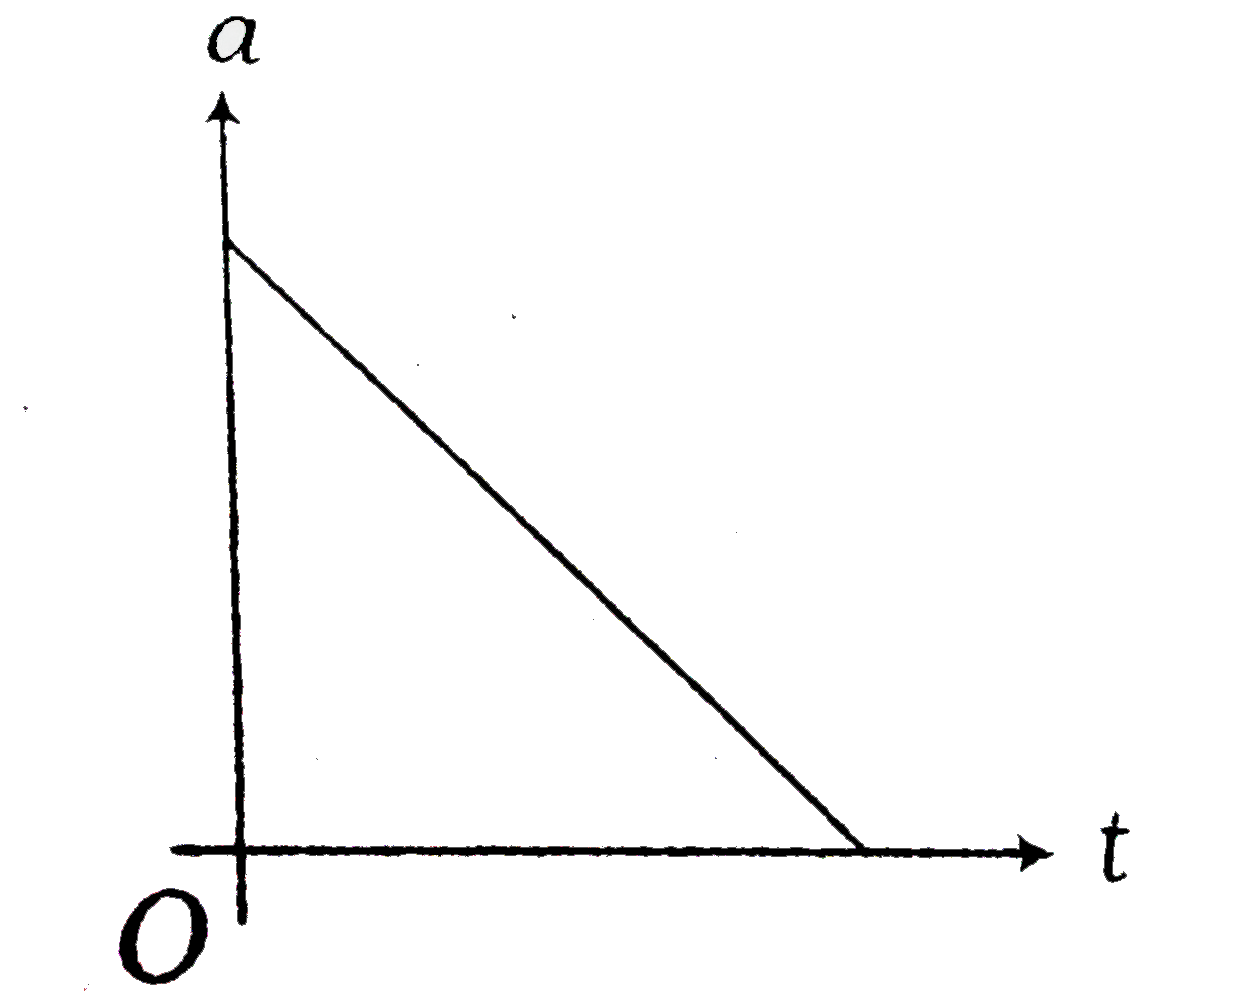
View SolutionThe acceleration (a)-time(t) graph for a particle moving along a straight from rest is shown in figure. Which of the following graph is the best representation of its velocity (v) with time (t) ?
View Solution

