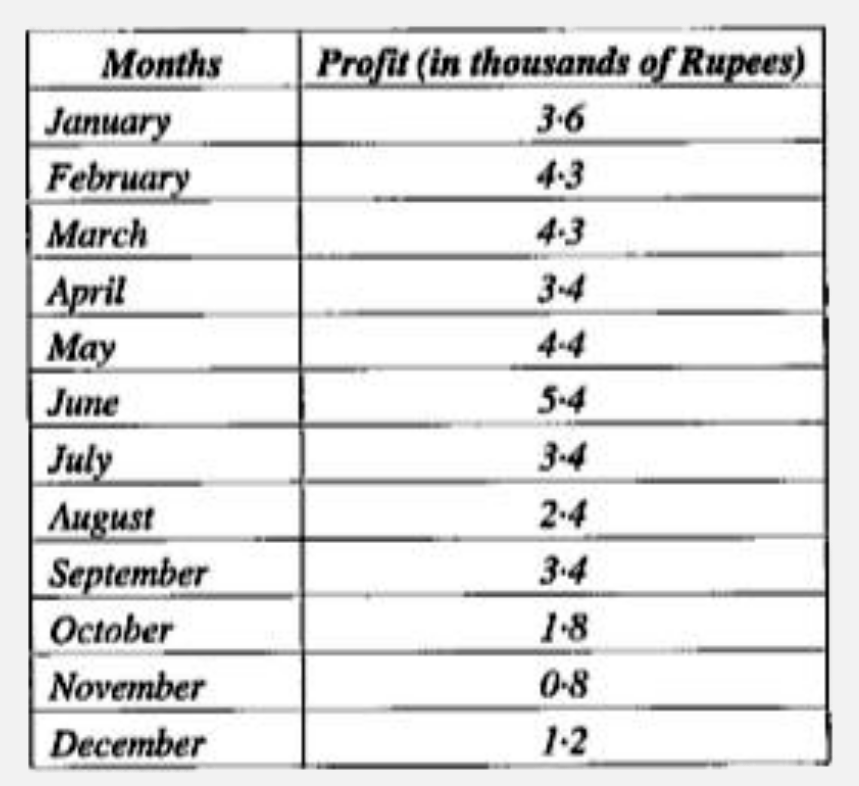
The profit of a soft drink firm (in thousand of rupees) during each month of the year is as given below:

Calculate the 4-monthly moving averages and plot these and the original data on a graph sheet.
The correct Answer is:4-monthly averages are 3.9,4.1,4.375,4.15,3.9,3.65,2.75,2.1,1.8. Moving average centred are 4.0,4.2375,4.2625,4.025,3.775,3.2,2.425,1.95.
Topper's Solved these Questions
Similar Questions
The profit of a soft drink firm (in thousands of rupees) during each month of the year is as given below:

Calculate the four monthly moving averages .
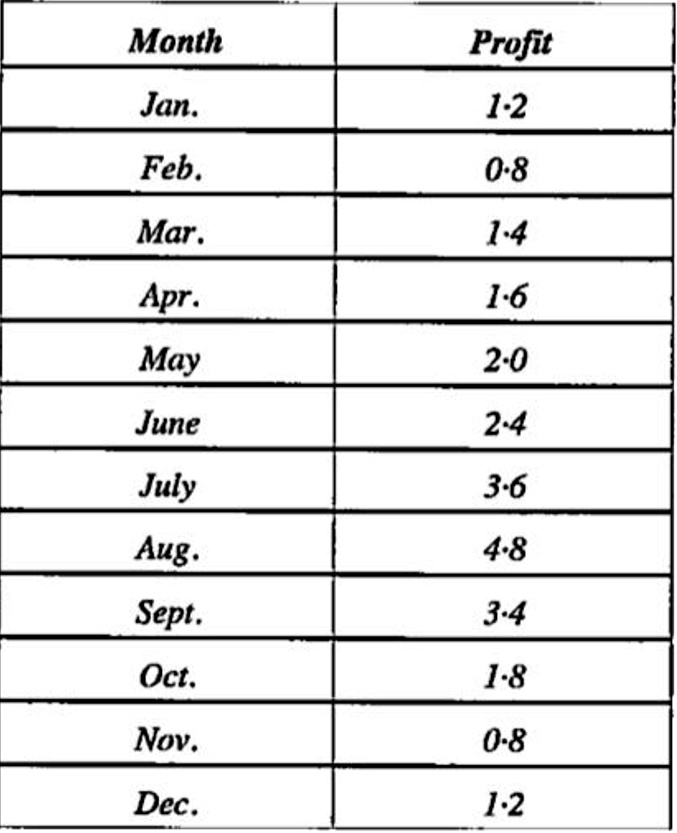
View SolutionThe profits of a paper bag manufacturing company (in lakhs of rupees) during each month of a year are :

Calculate the four monthly moving averages.
View SolutionThe quarterly profits of a small scale industry (in thousands of rupees) is as follows:

Calculate four quarterly moving averages. Display these and the original figures graphically on the same graphs sheet.
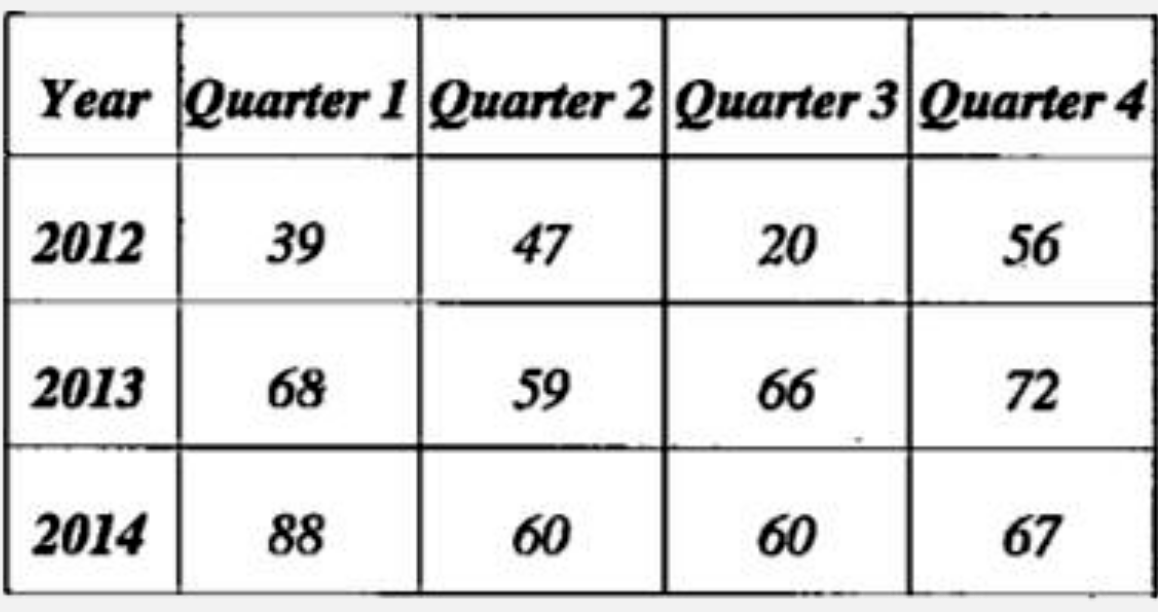
View SolutionThe table below gives details of the electricity generated in kilowatt hours in each quarter for the years 2012 to 2014

Calculate the four-quarterly moving averages and display these and the original figures on the same graph .
View SolutionThe profit of a soft drink firm (in lakhs of rupees) during each month of the year is as given below.
MonthsProfit (in Lakhs Rupees)January42February40March39April35May41June32July40August50September52October56
Calculate the four monthly moving averages and the original data on a graph sheet.
View SolutionThe table given below shows the number of visitors (in hundreds) to a certain exhibition over a period of two weeks:

Calculate 6-day moving averages and illustrate these and original information on the same graph using the some scales.
View SolutionThe following table gives the number of failures of commercial industries in a country during the year 1975 to 1990

Draw a graph illustrating these figures. Calculate the 4 yearly moving averages and plot them on the same graph.
View SolutionThe following table gives the numbers of failures of commercial industries in a country during the years 2000 to 2015.

Draw a graph illustrating these figure.
Calculate the 4 yearly moving averages and plot them on the same graph.
View SolutionThe averge number , in thousands , of working hours lost in strikes each year of the period 2000-2009 was as under

. Calculate the three - yearly moving averages .
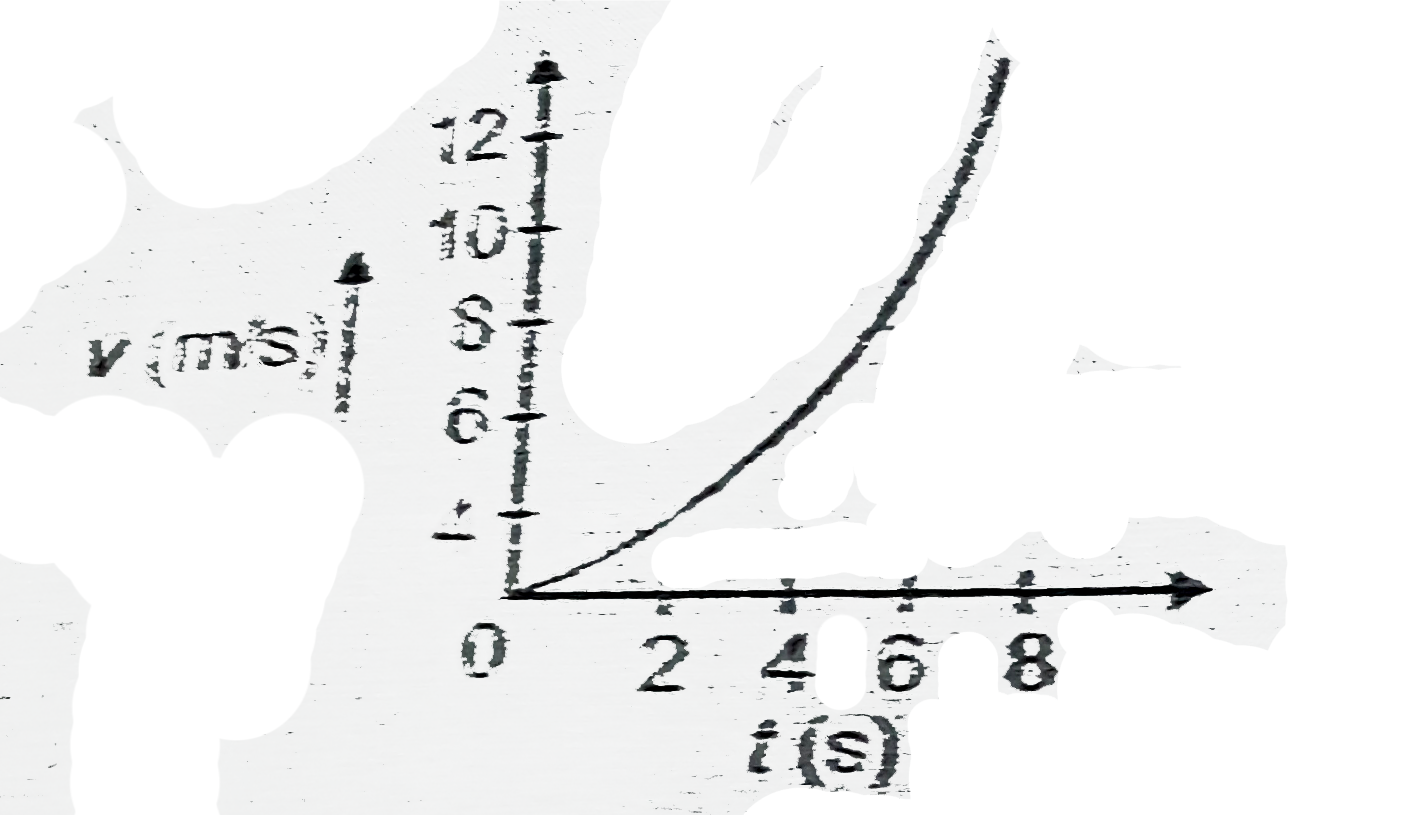
View SolutionThe velocity-time graph of an object is given below. Calculate the average acceleration of the object in the time interval of 4 s to 6 s.

View Solution
