This table shows the number of students in a school getting at least a grade C in mathematics for the years 1994 to 2001.
(i) Represent this data as a time series.

The correct Answer is:The set of data has been smoothed out. The trend increasing. The number is increasing but might be because the school is getting bigger.
Topper's Solved these Questions
- MOVING AVERAGEBOOK - ICSECHAPTER - MOVING AVERAGEEXERCISE - CHAPTER TEST
5 Videos
- MOVING AVERAGEBOOK - ICSECHAPTER - MOVING AVERAGEEXERCISE - CHAPTER TEST
5 Videos
- MODEL TEST PAPERS 01BOOK - ICSECHAPTER - MODEL TEST PAPERS 01EXERCISE - Section C
8 Videos
- PARABOLABOOK - ICSECHAPTER - PARABOLAEXERCISE - CHAPTER TEST
8 Videos
Similar Questions
Knowledge Check
The table given below shows the number of students who have taken admission in school A and B from the years 2010 to 2015.
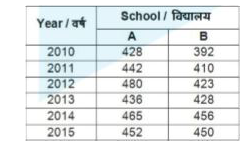
The difference between the number of students in both schools is maximum in which year?Aa)2010Bb)2012Cc)2014Dd)2015The table given below shows the number of students who have taken admission in school A and B from the years 2010 to 2015.
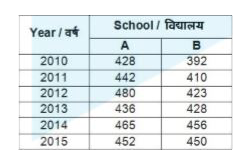
Across all the years, for how many years, the number of students in school A was less than the average number of students in school B?A0B1C2D3The table given below shows the number of students who have taken admission in school A and B from the years 2010 to 2015.
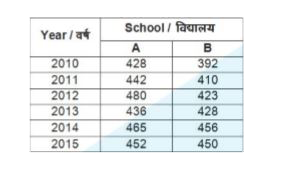
What is the average difference of number of students in school A and B in the given period?Aa)24Bb)27Cc)96Dd)144
The following table shows the favourite sports of 250 students of a school. Represent the data by a bar graph.
View SolutionThe following table shows the estimated sectoral real growth rates (percentage change over the previous year) in GDP at factor cost.
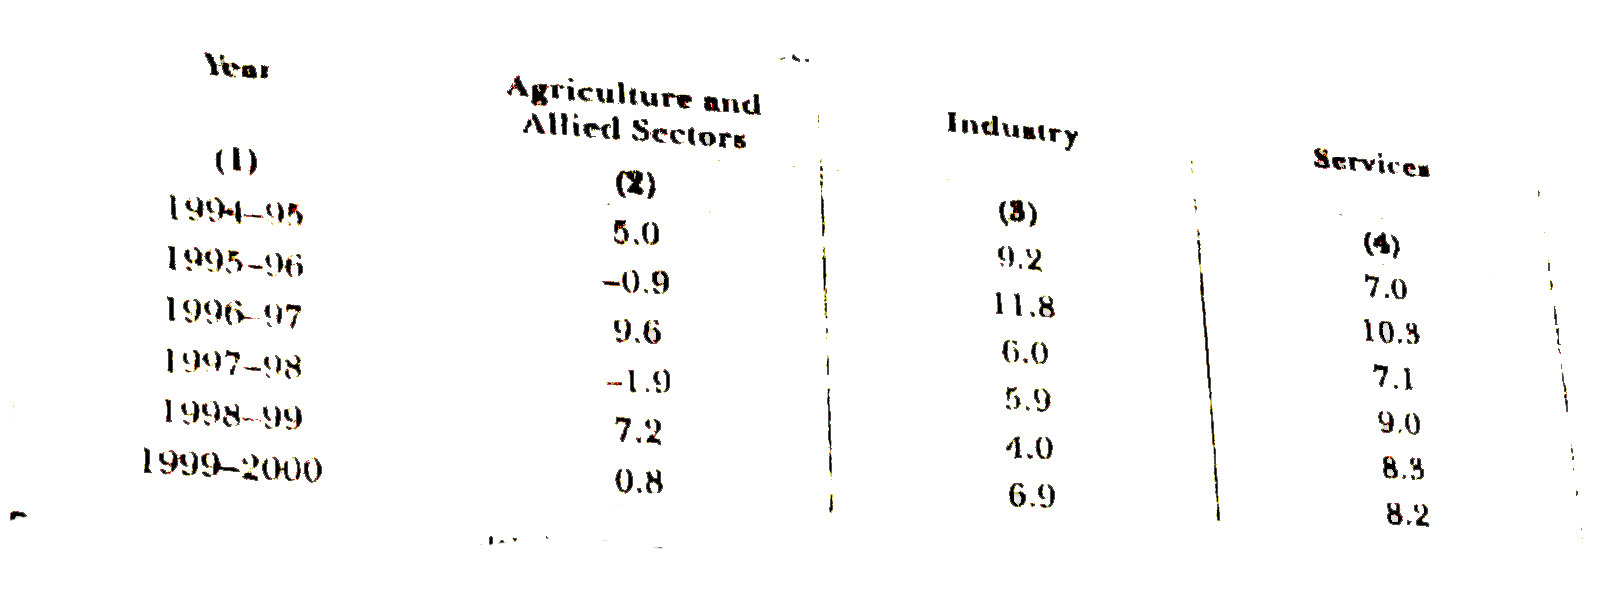
Represent the data as multiple time series graph.
View SolutionThe following table shows the interest of students of a school in different games :

Represent the data by using a simple bar diagram.
View SolutionThe pie-chart given below shows the number of students enrolled in a school in different activities. Total number of students in the school is 1200. Study the chart and answer the questions.
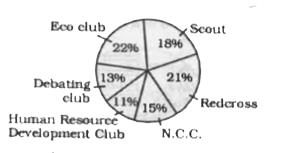
How many students are enrolled in N.C.C. activities ?
View SolutionFollowing table shows the number of students studying in four different schools in four years. Studying the table carefully and answer the questions that follow
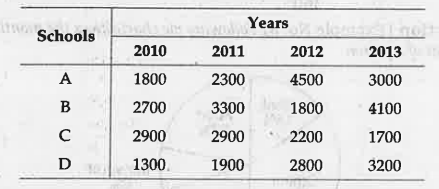
What is the total number of students studying in all the four schools together in the year 2012?
View Solution
