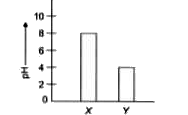
The pH level of precipitation at two places X and Y was found to be as shown in graph. Which of the following can you deduce from it?
Marble statues at place X can be seen yellowing.
Plants at place Y can be seen to have burnt yellow looking leaves.
At place X there is higher consumption of fossil fuels.
At place Y renewable energy sources are fastly replacing the use of conventional energy sources.
The pH level of rainwater (precipitation) at place Y is around 4 that means rainwater is acidic at place Y. As an impact of acid rain at place Y we can find yellowing of marble statues and plants with burnt leaves. It also indicates that use of fossil fuels (conventional energy sources) is much higher at place Y than place X.
Topper's Solved these Questions
Similar Questions
Knowledge Check
The two pie charts show the market share of different companies which produces TV and Refrigerator (noth) in the first quarter of 2005-06.
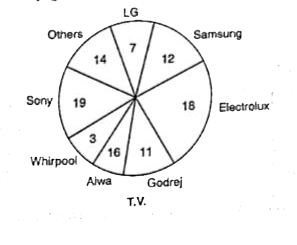
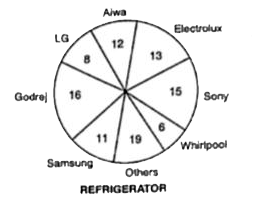
Which of the following cann't be deduced from the given data :AThe angular difference between Samsung TV and Electrolux refrigerator is 3.6∘.BSony is the market leader in the TV and Refrigerator segment combined.CFor every ₹100 turnover of Whirlpool Refrigerator, the difference in the turnover of Electrolux and Samsung Refrigerator is ₹33.34 crore.Dnone of the aboveWhich of the following can be used to precipitated lead salt
AK2CrO4BKICdil. H2SO4DAllFrom v−t graph shown in figure. We can draw the following conclusions
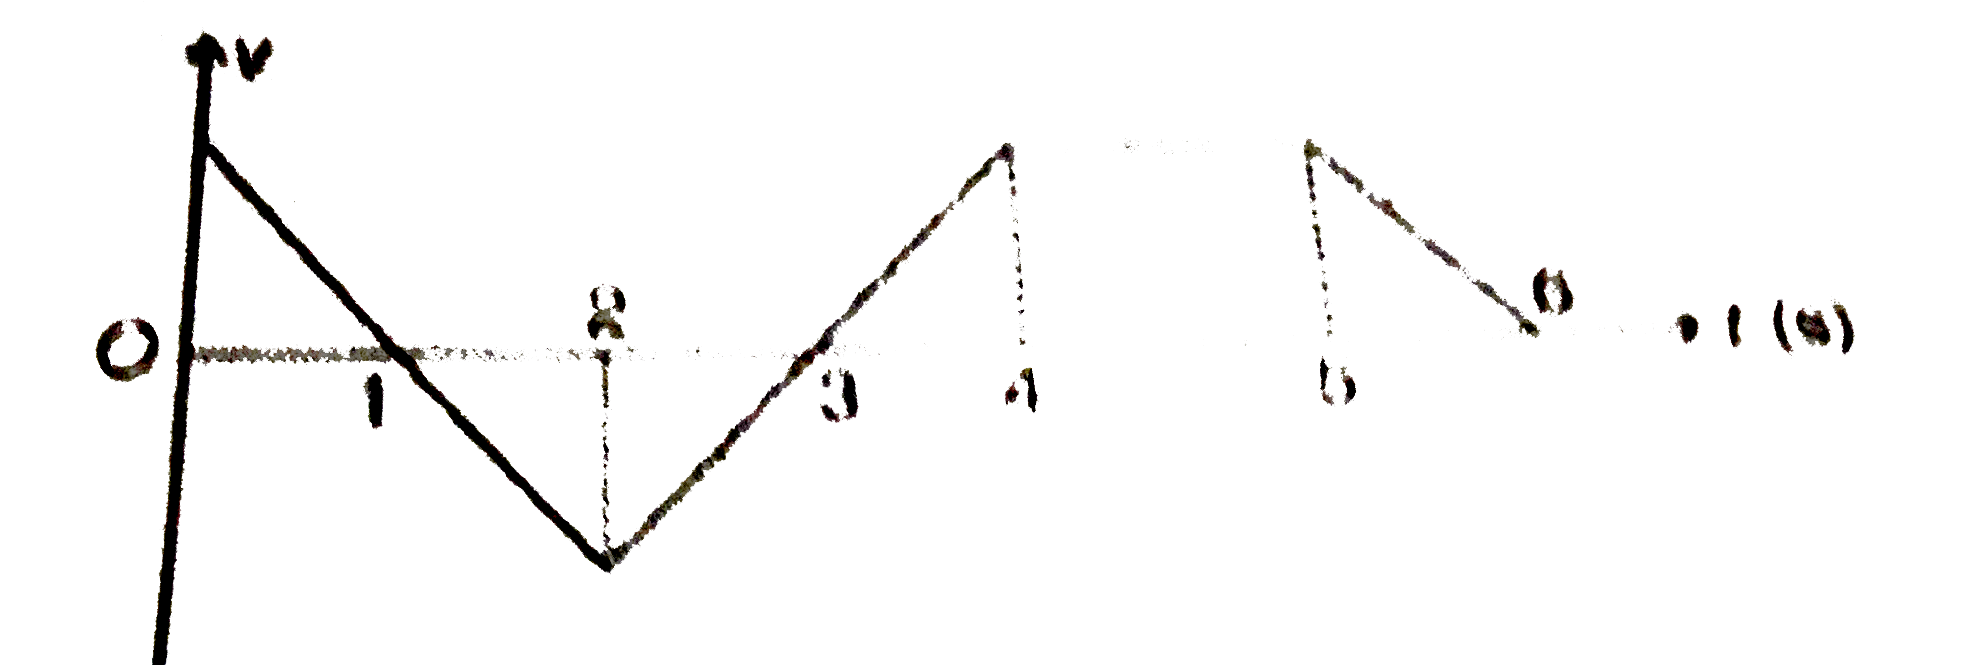 Abetween t=1s to t=2s speed of particle is decreasingBbetween t=2s to t=3s speed of particle is increasingCbetween t=5s to t=6 acceleration of particle is negativeDbetween t=0 to t=4s particle changes its directioin of motion twice
The graph of y=f(x) is as shown ,Which of the following is/are CORRECT?
View SolutionWhich of the following is the graph of y=|sinx|sinx
View SolutionIf the graph intersects Y-axis below the X-axis then which of the following can be valid?
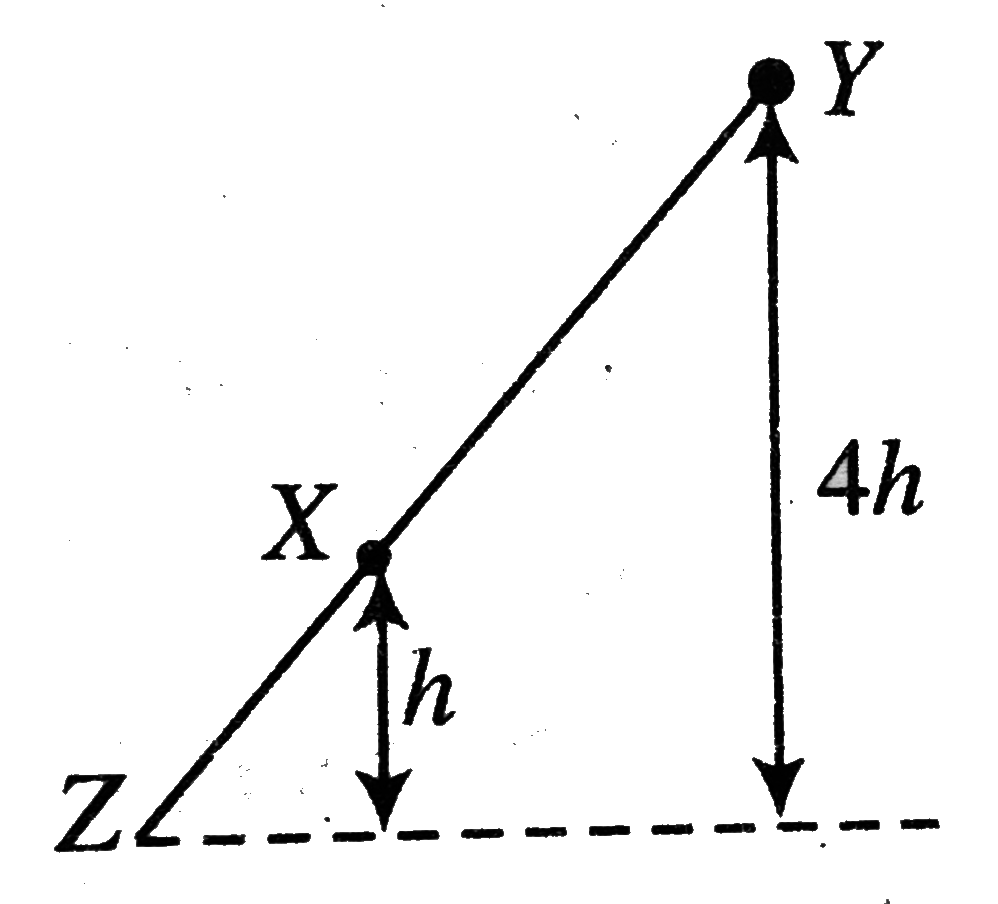
View SolutionTwo wheels A and B are released from rest from points X and Y respectively on an inclined plane as shown in the figure. Which of the following statement(s) is/are incorrect?
View SolutionThe distribution of molecular kinetic energy at two temperature is as shown in the following graph:

Which is the following concluison is/are correct?
View Solution
