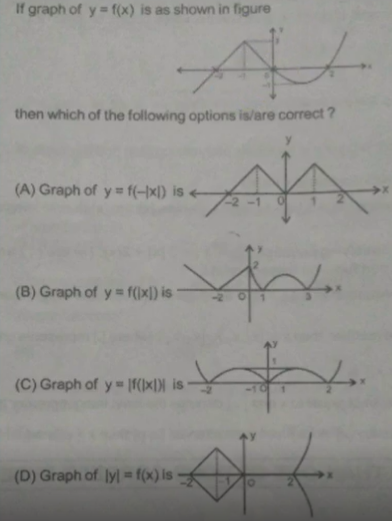
The graph of y=f(x) is as shown ,Which of the following is/are CORRECT?
Step by step video & image solution for The graph of y = f(x) is as shown ,Which of the following is/are CORRECT? by Maths experts to help you in doubts & scoring excellent marks in Class 12 exams.
Updated on:21/07/2023Similar Questions
Knowledge Check
The graph of y=f(x) is shown below.
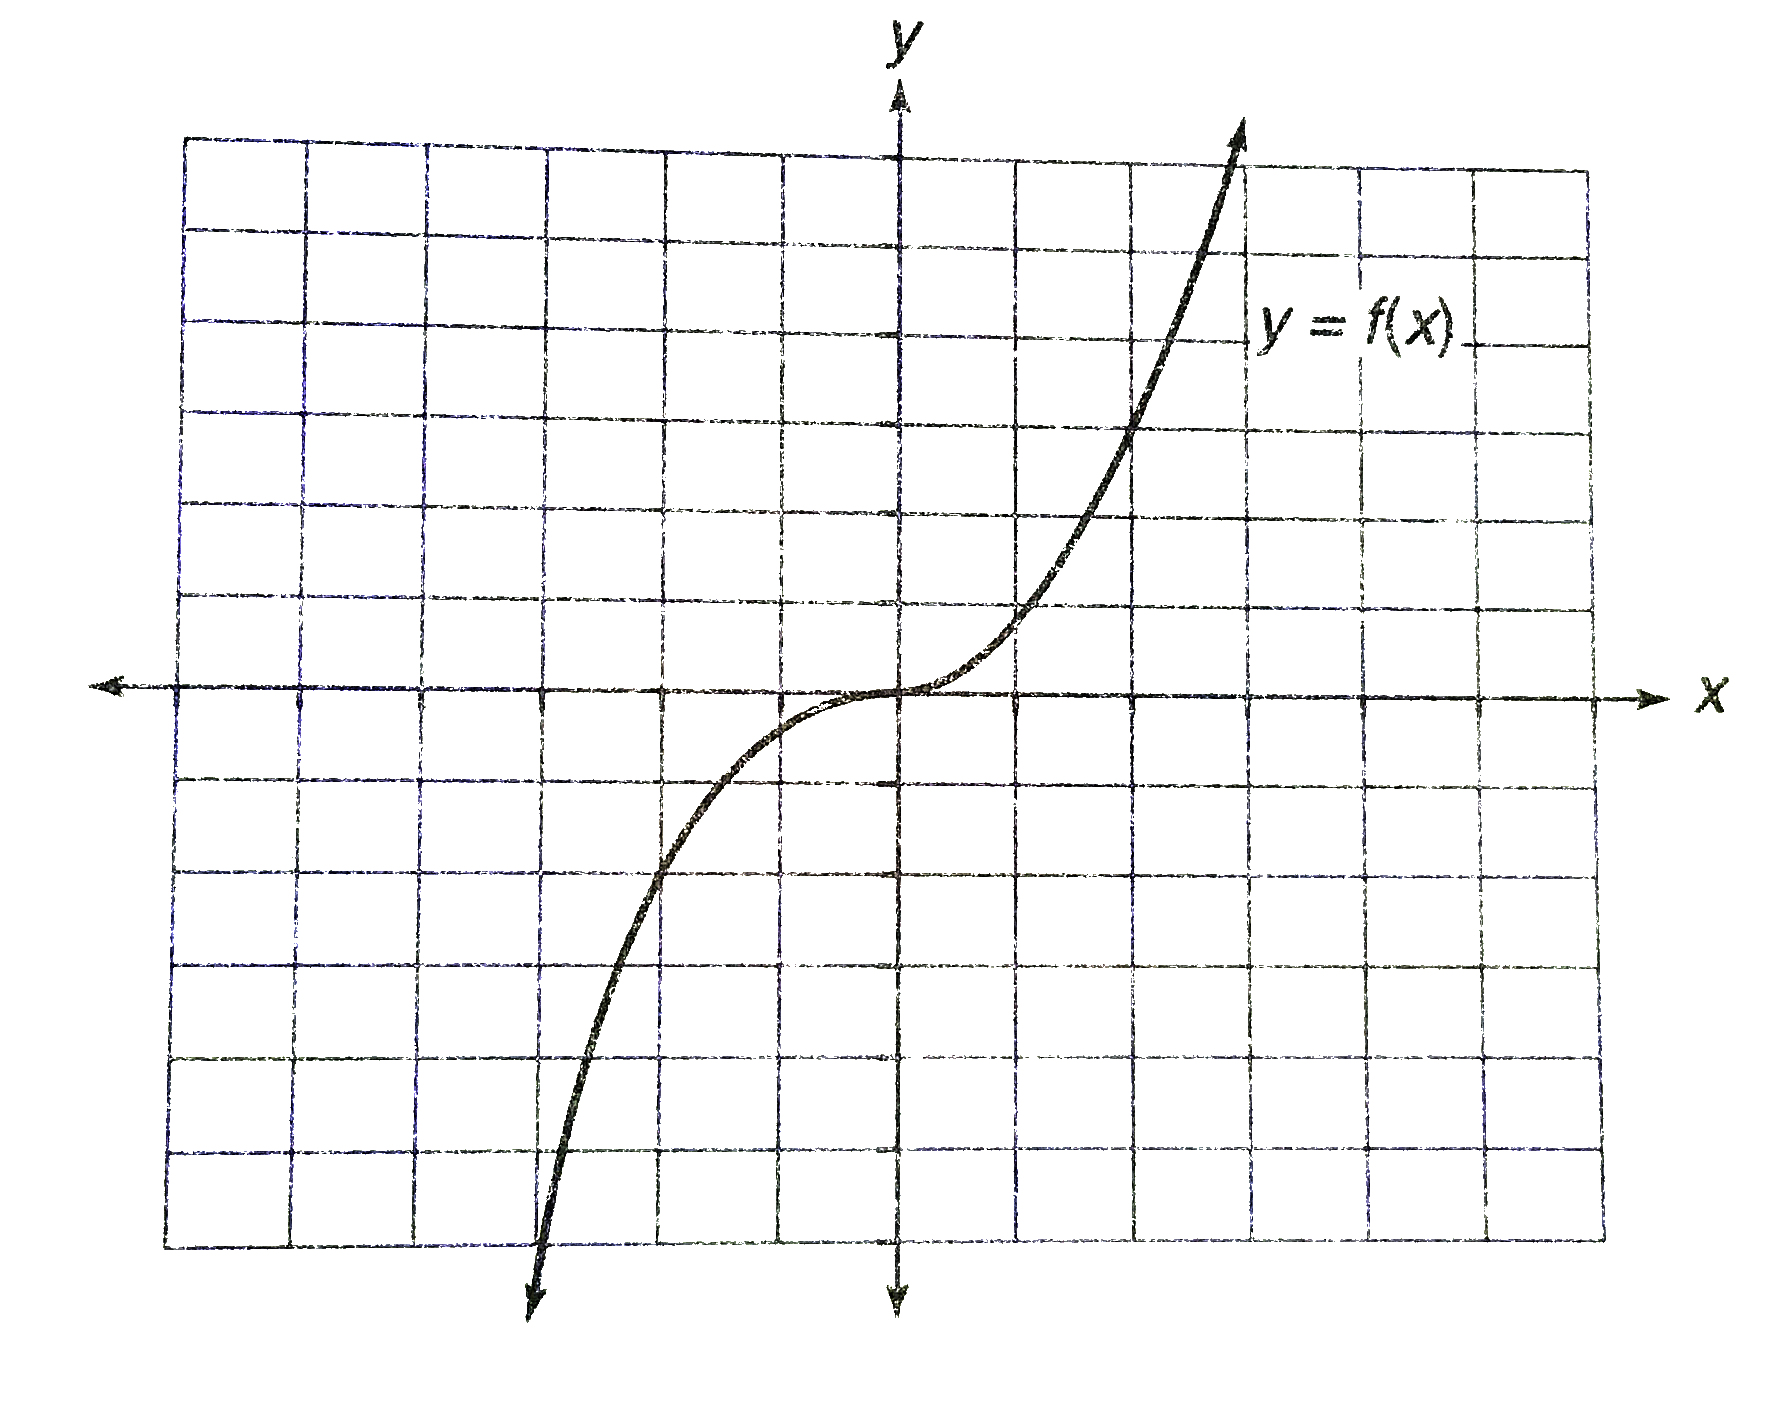
Which of the following could represents the graph of y=f(x−2)+1?A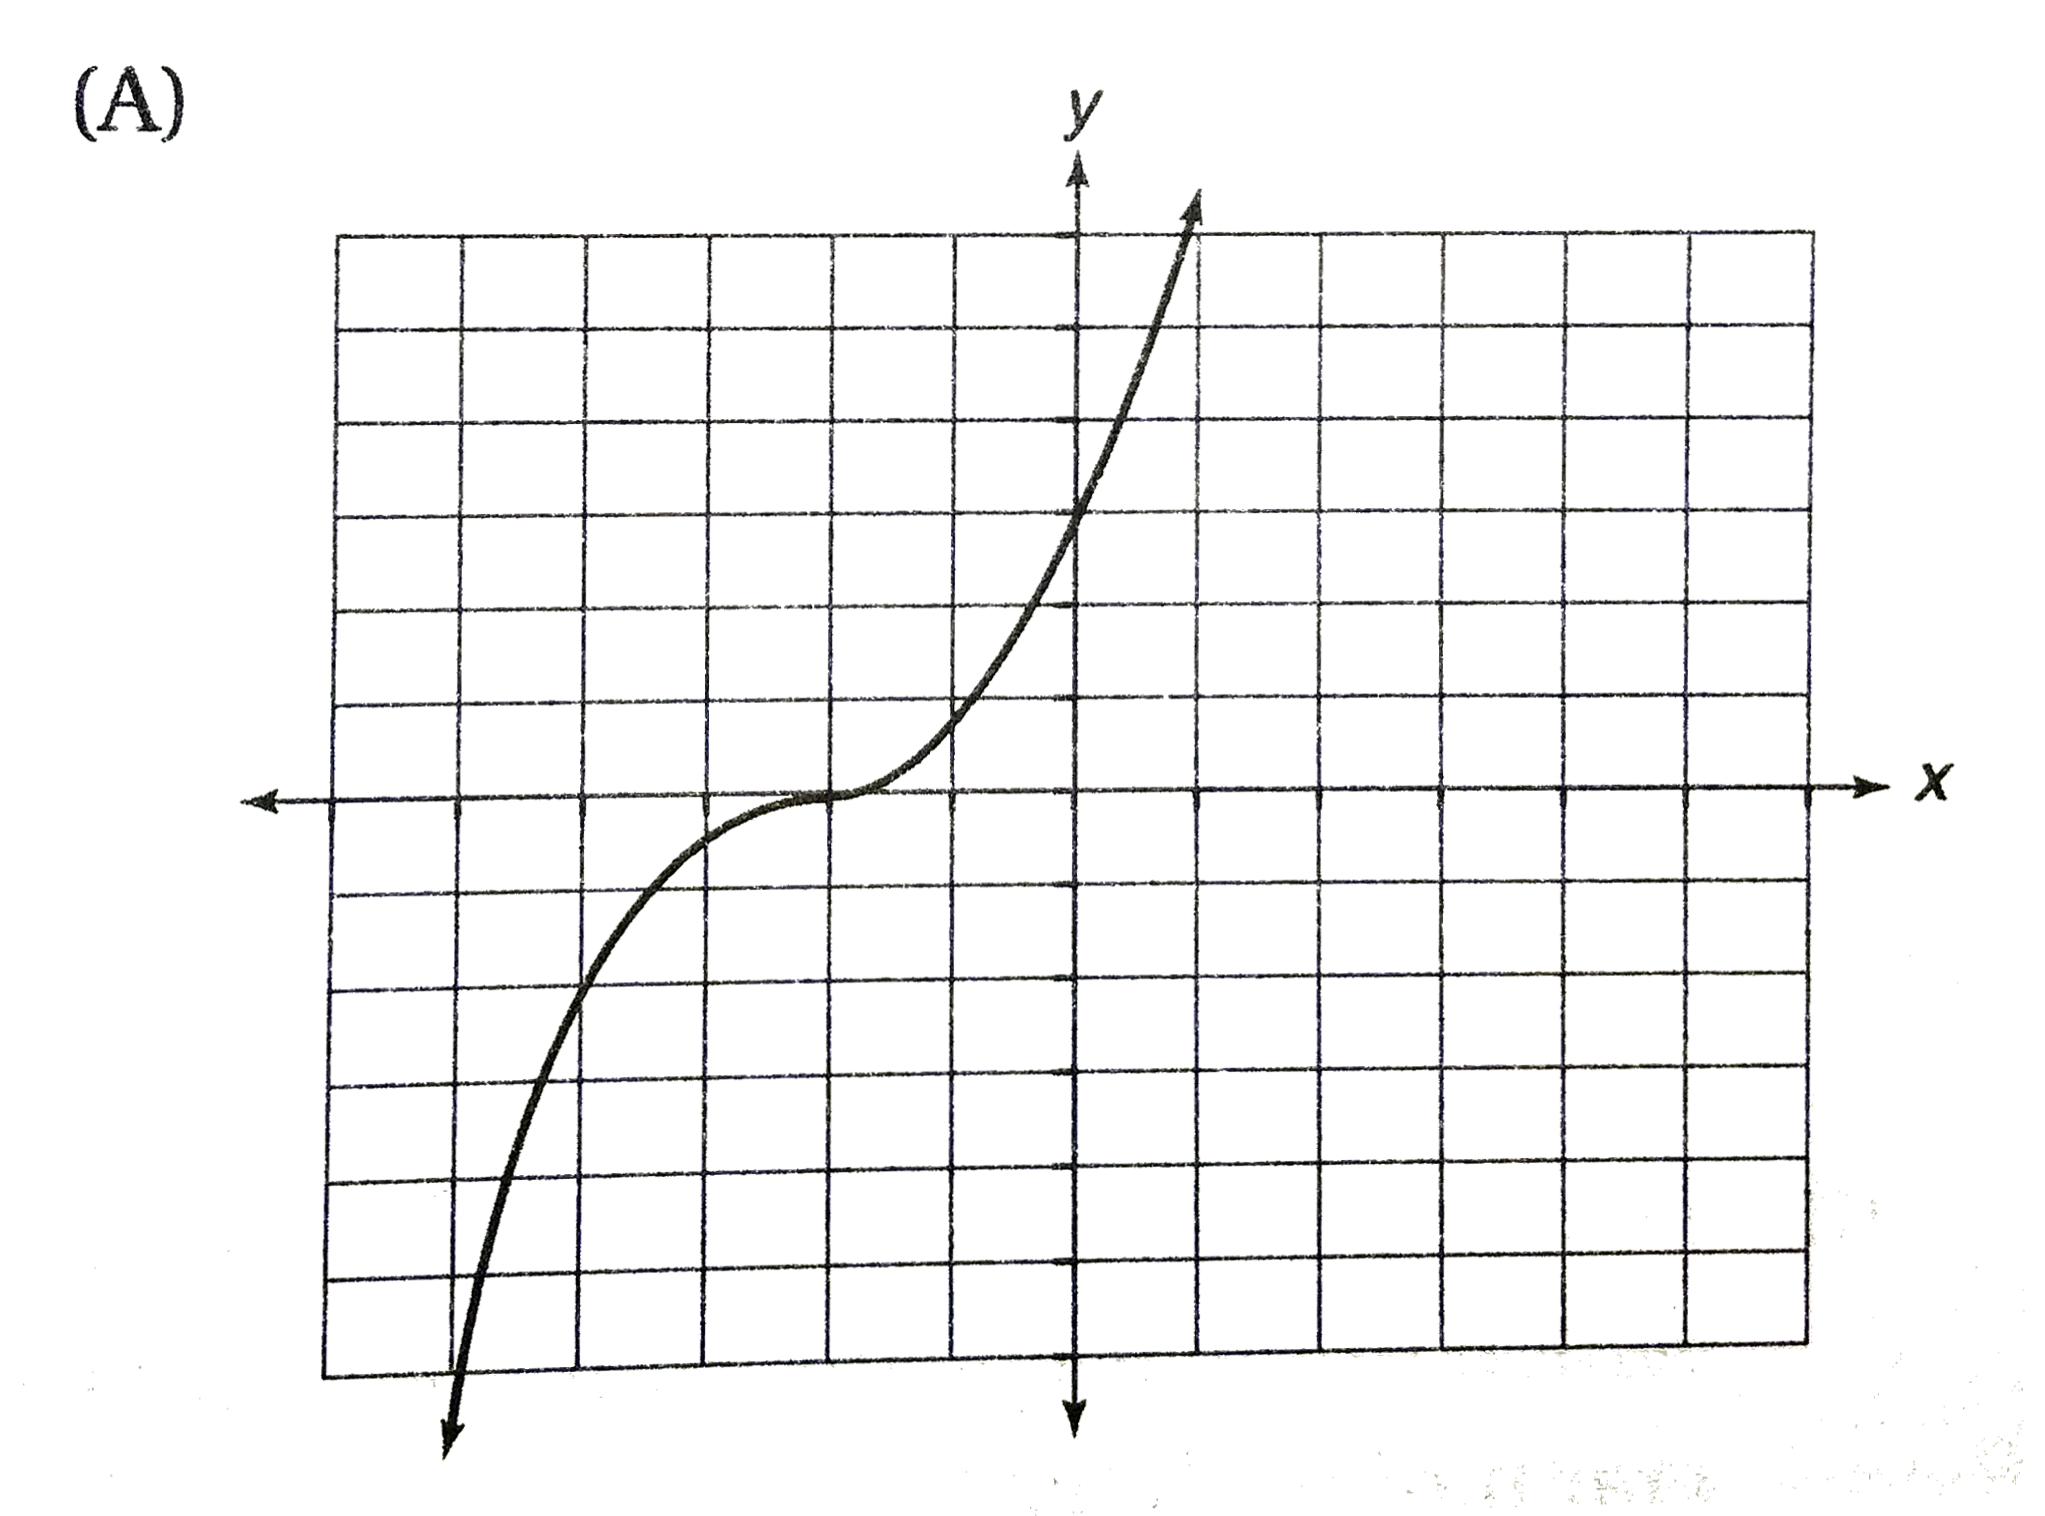 B
B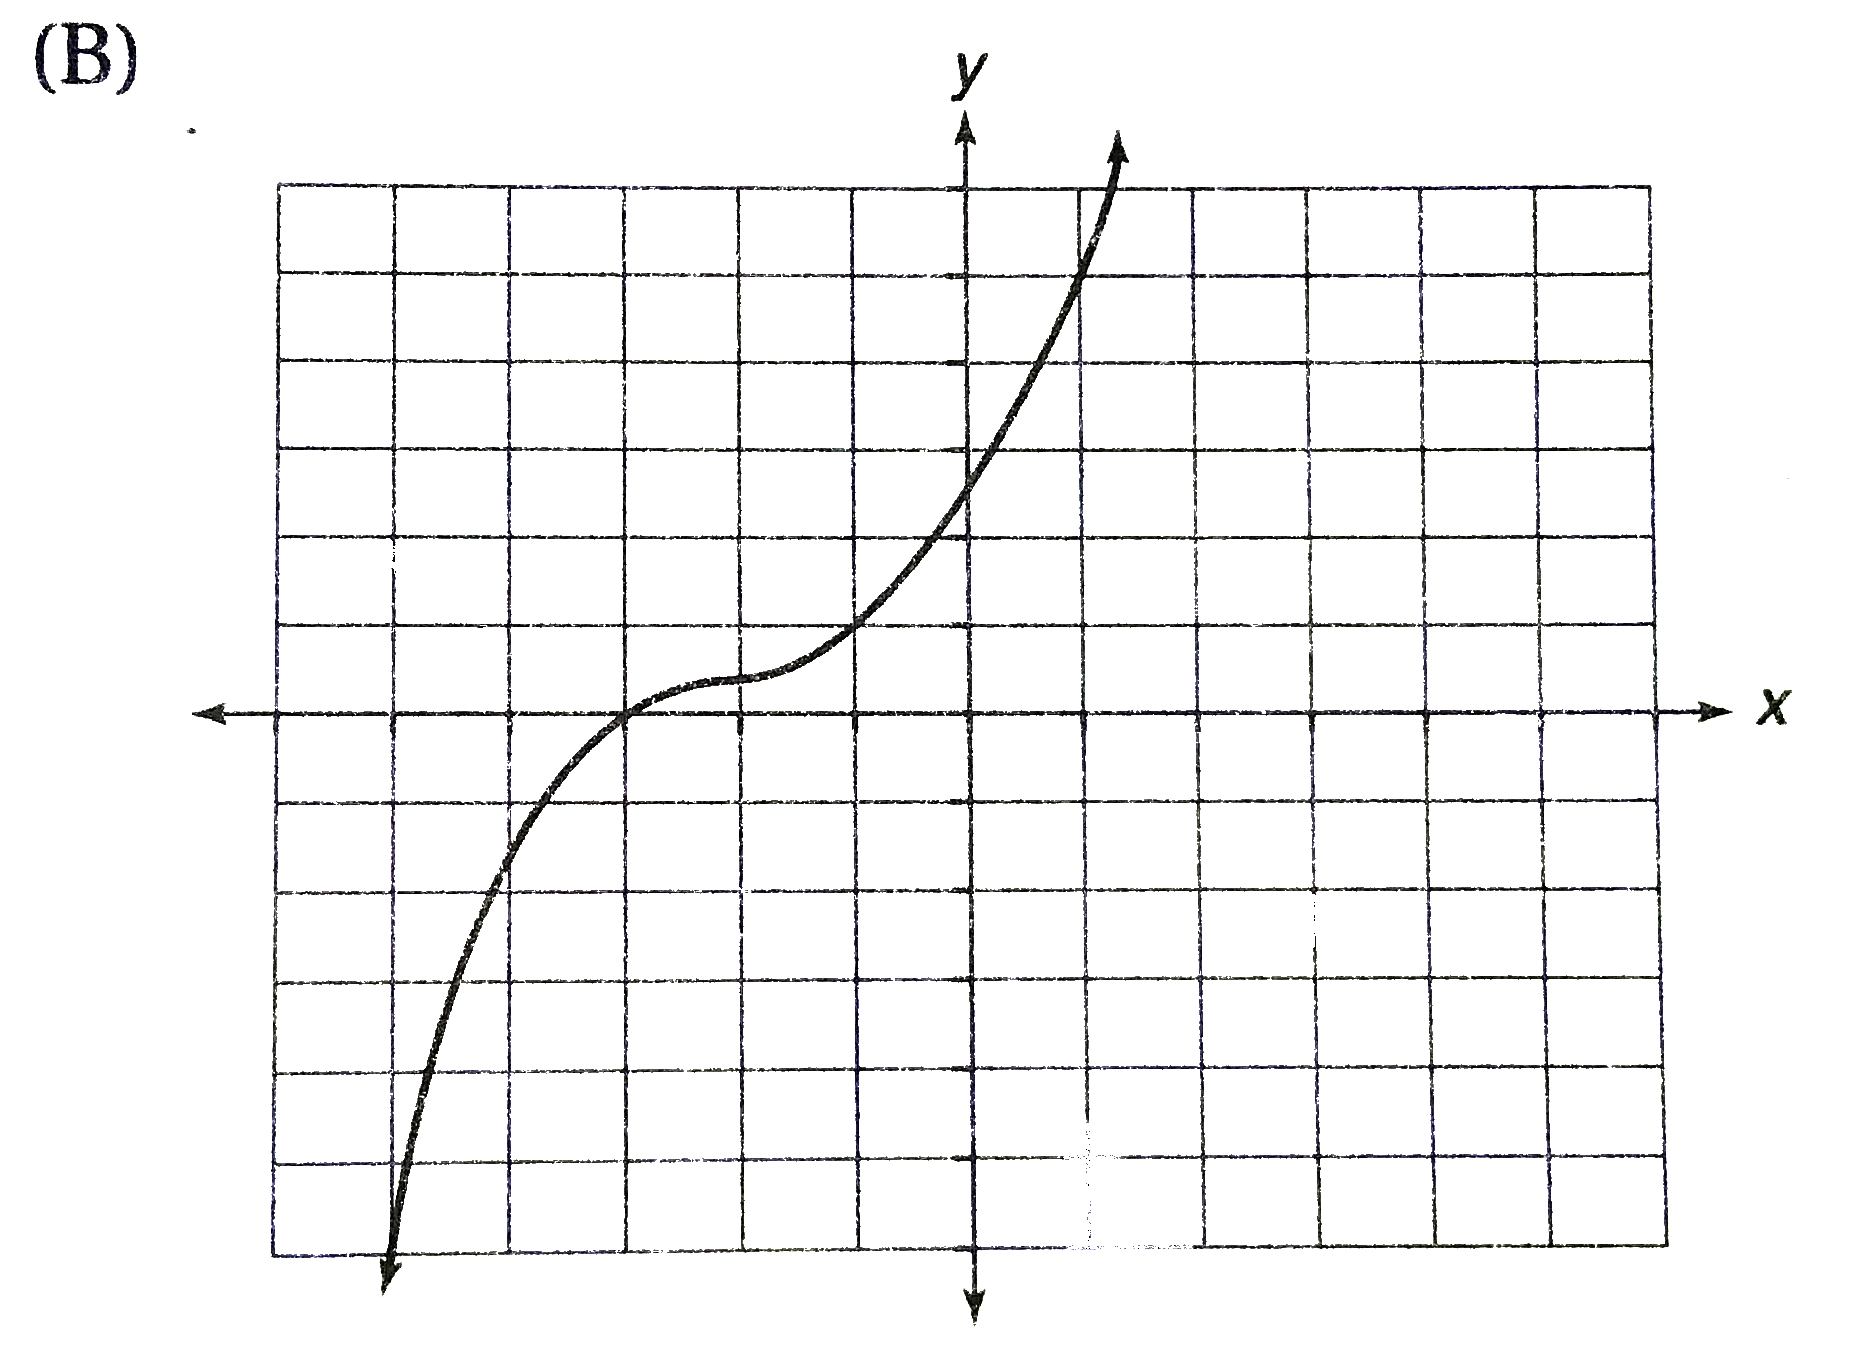 C
C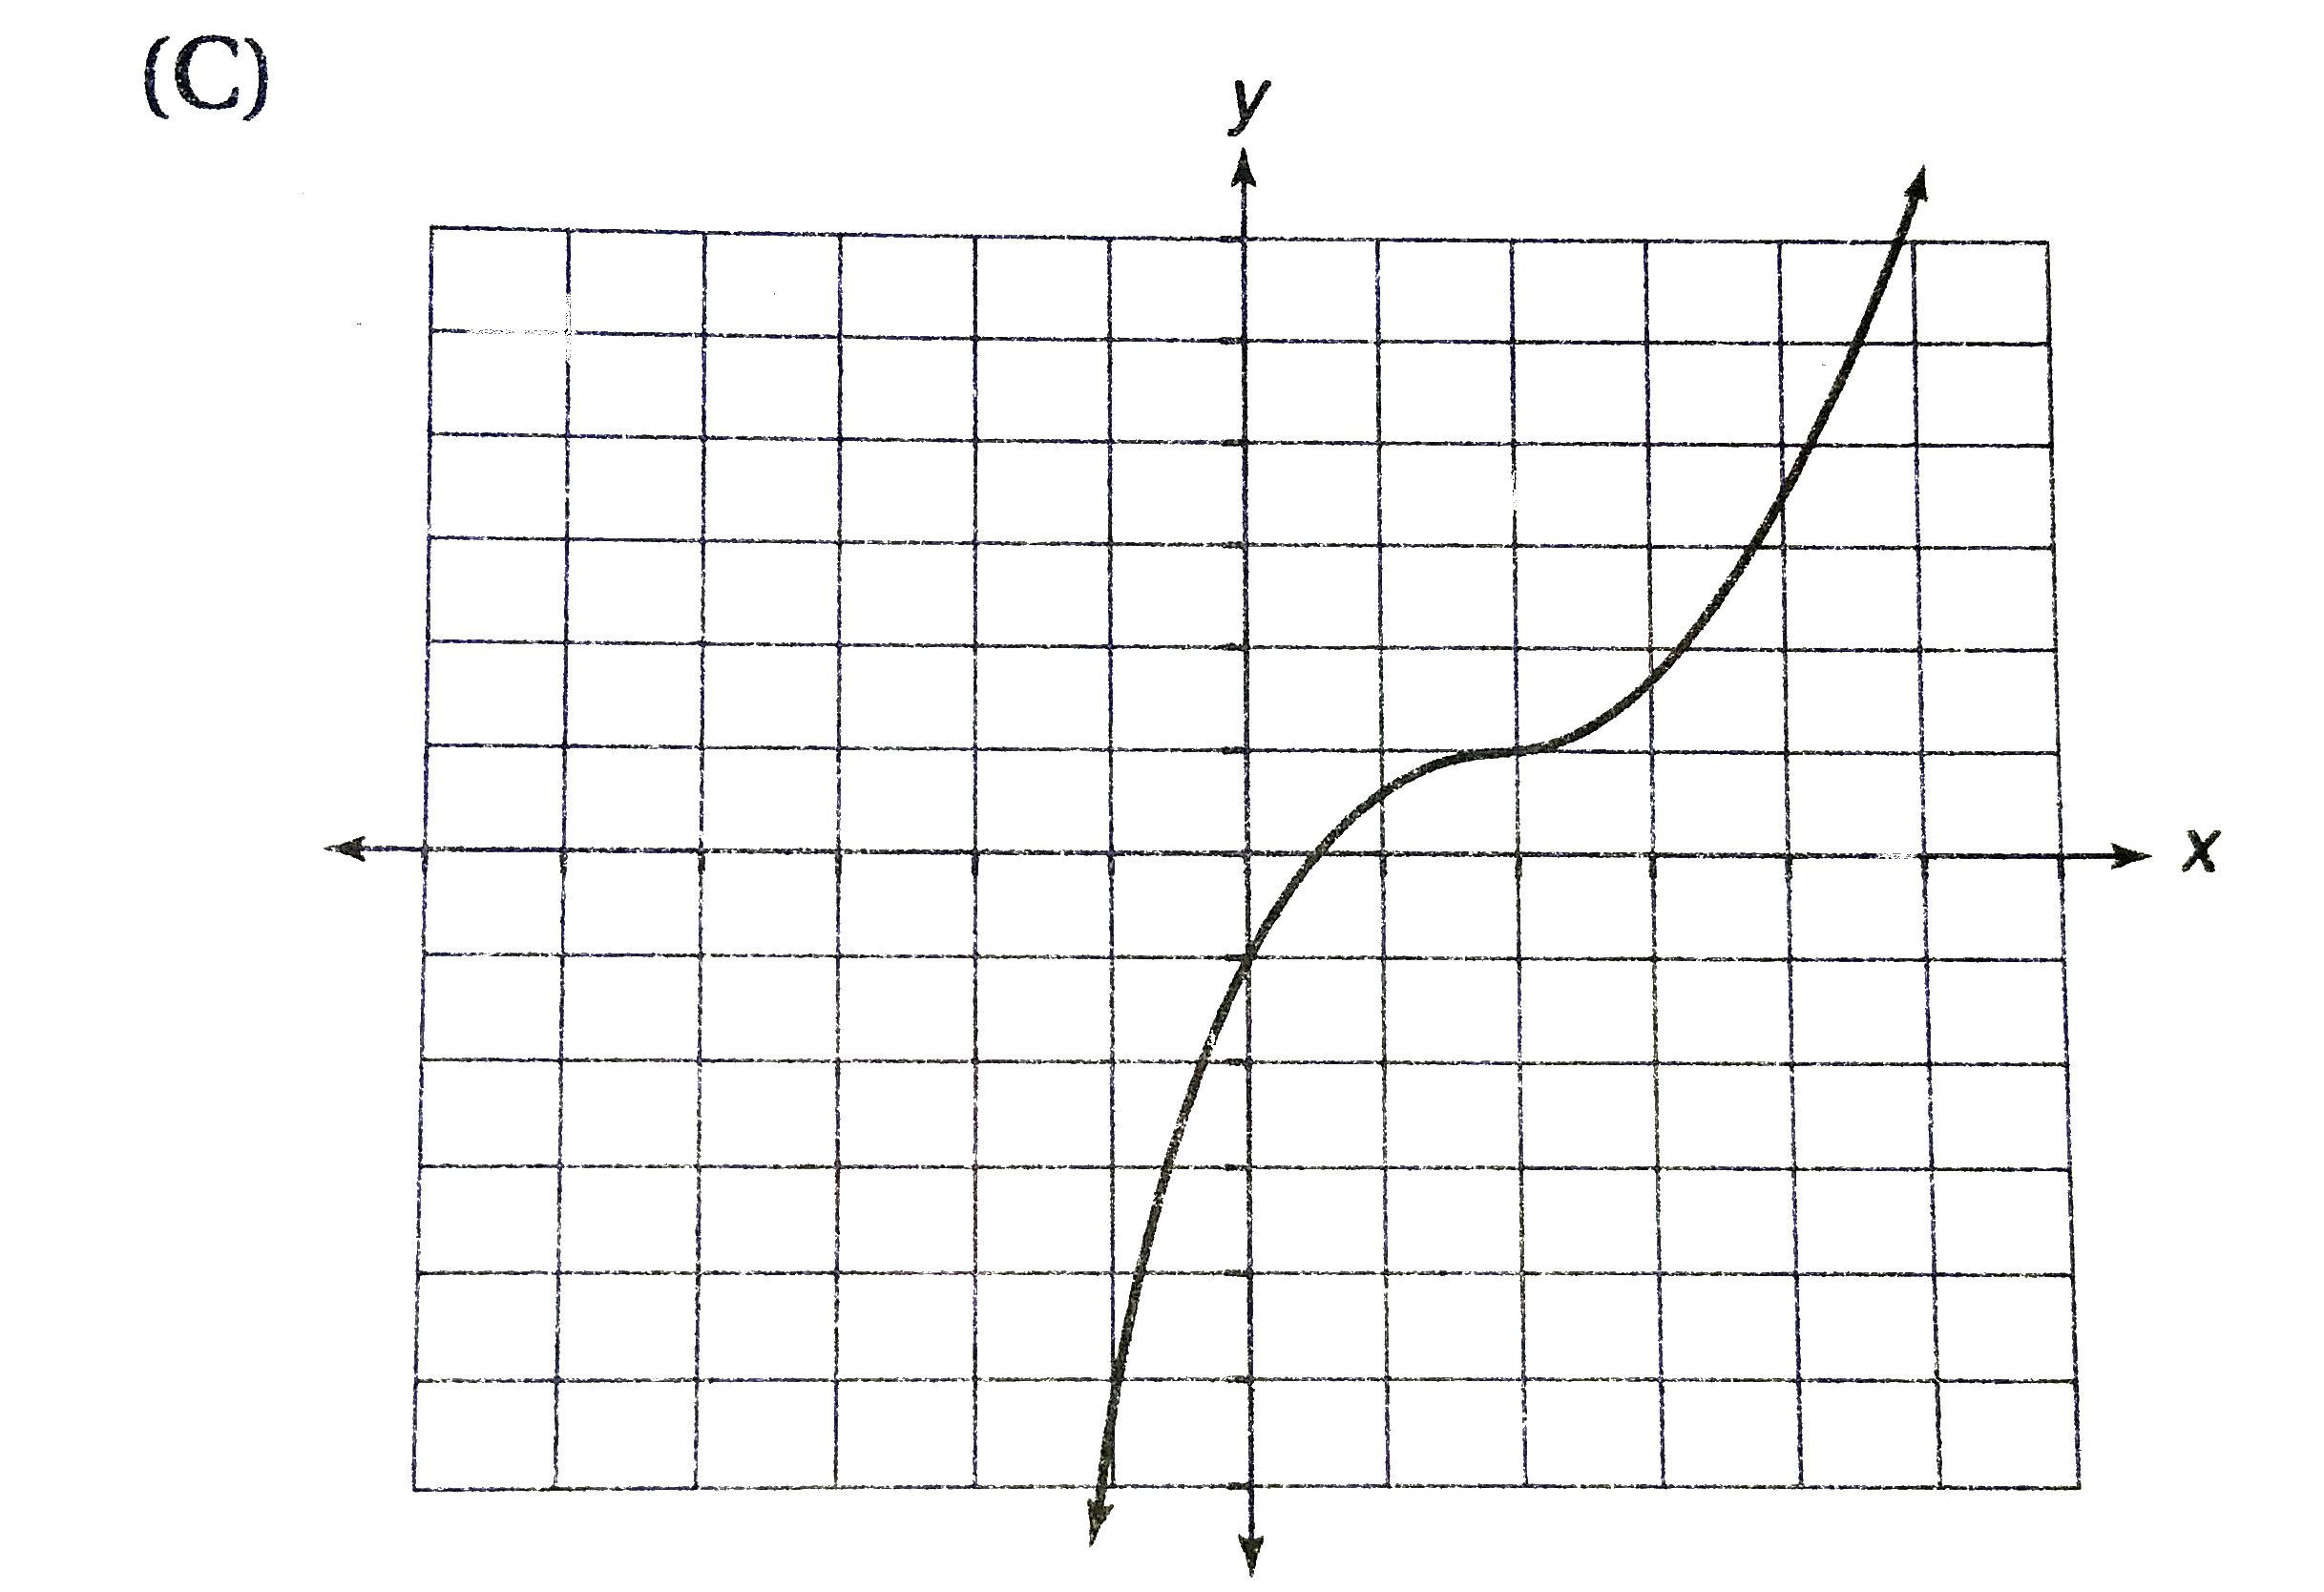 D
D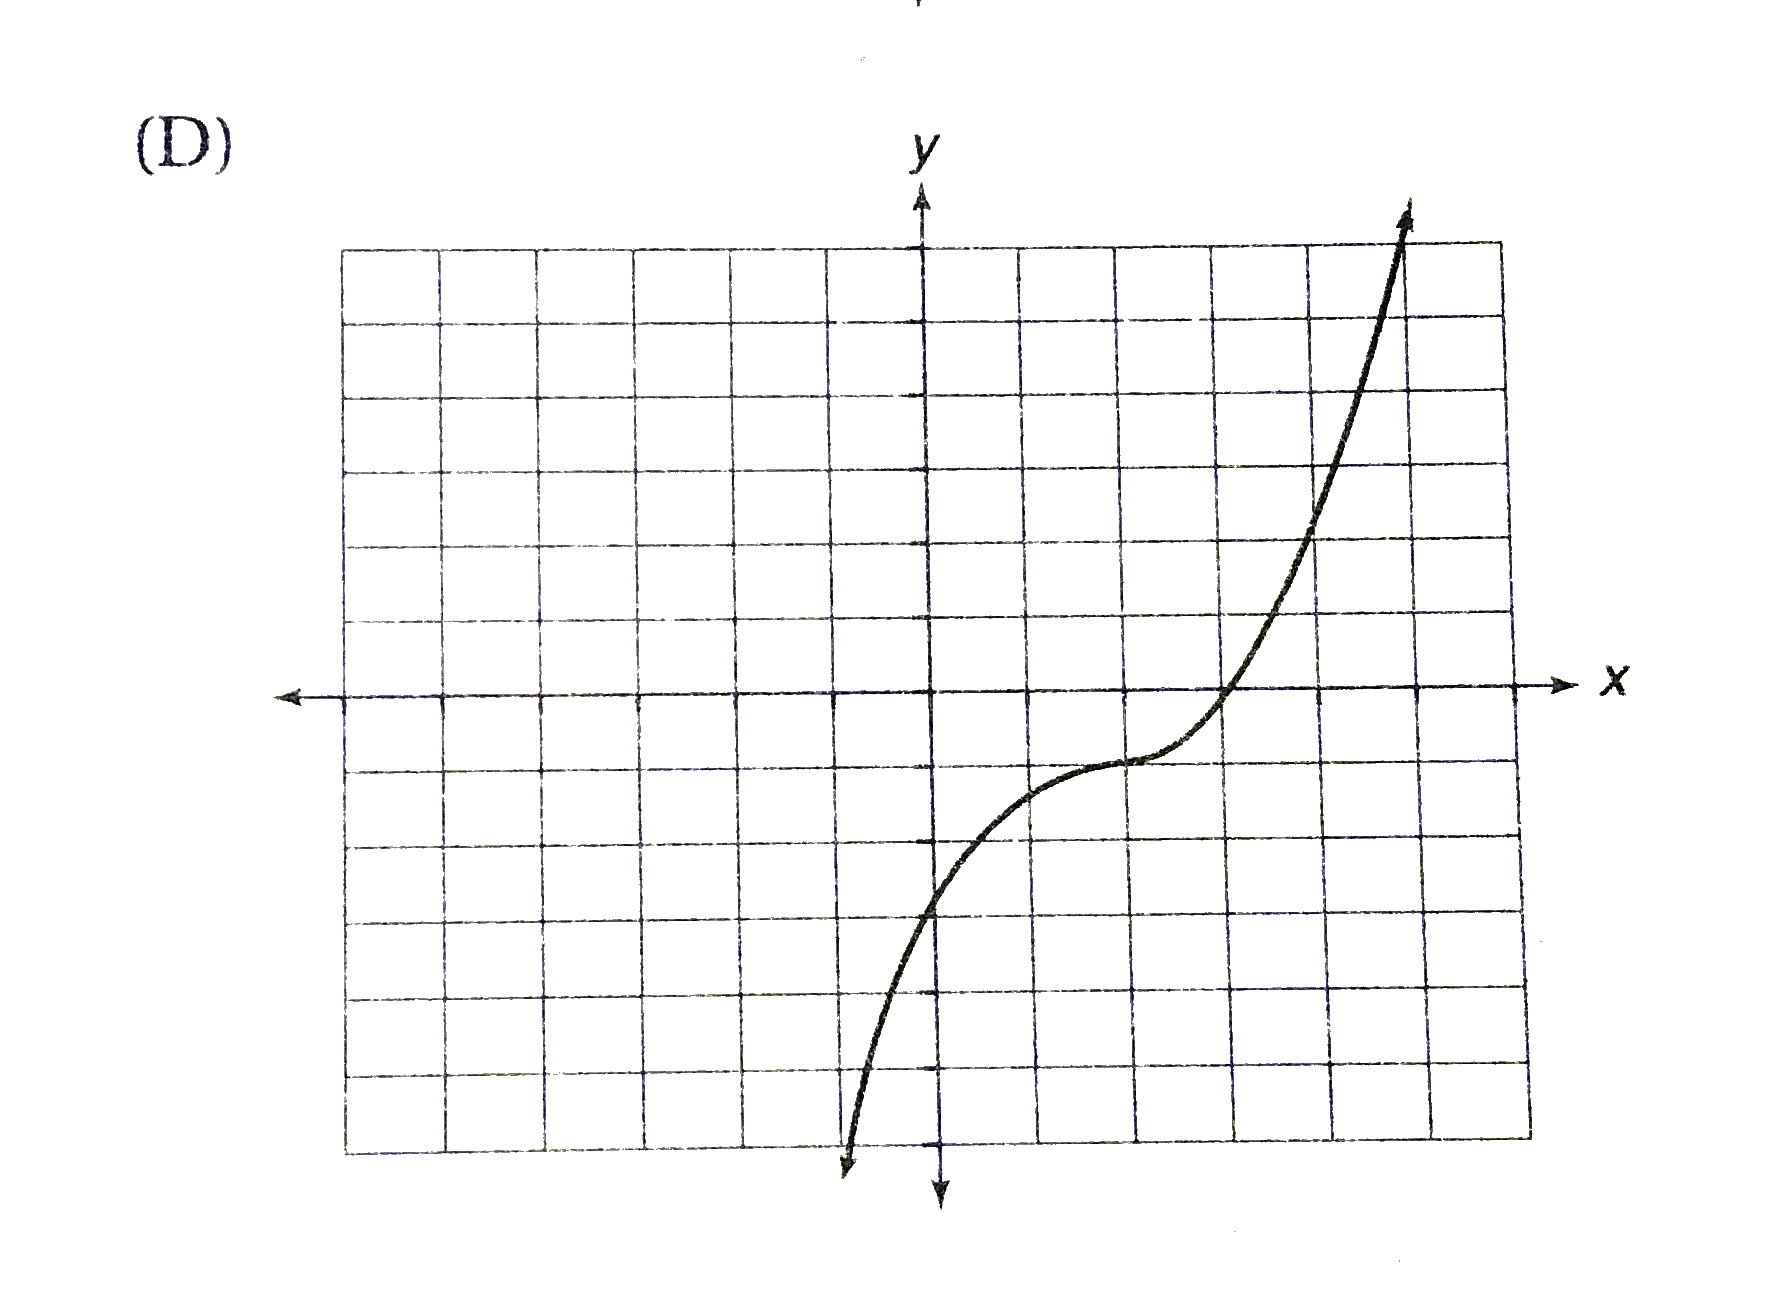
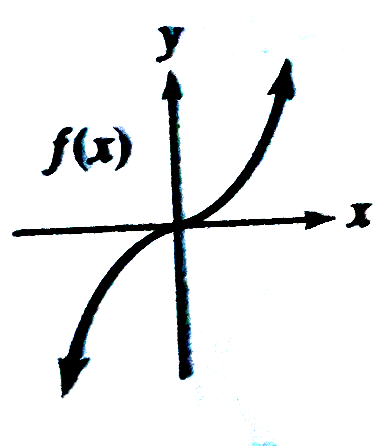
The graph of f(x) is shown above , Which of the following represents the graph of f(x-3) ?A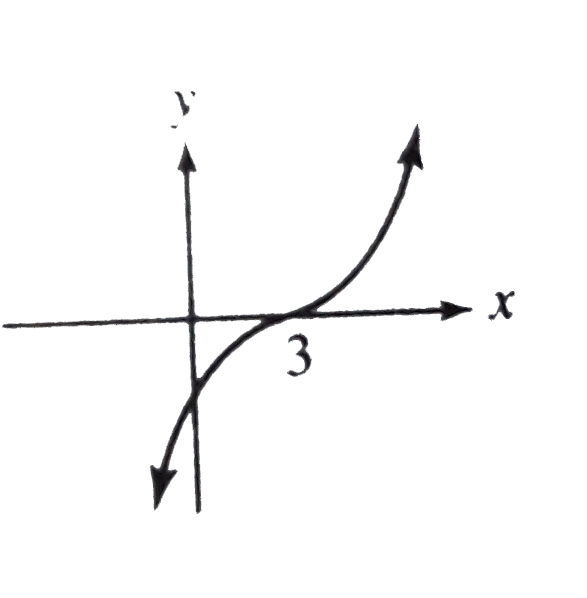 B
B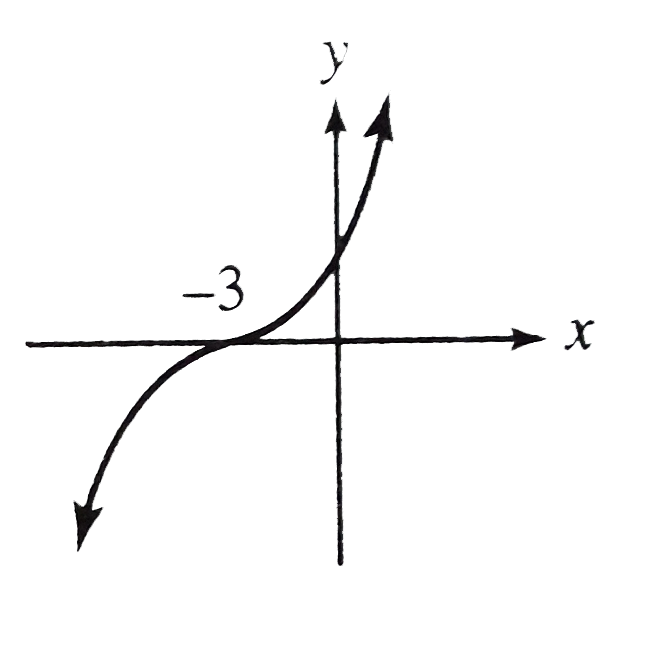 C
C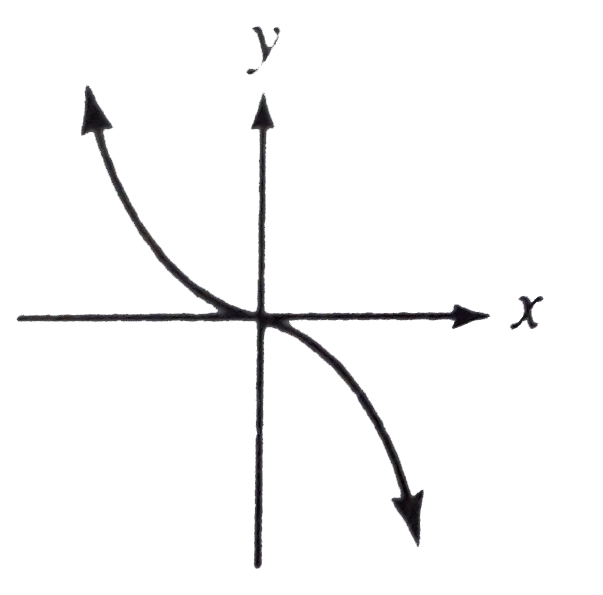 D
D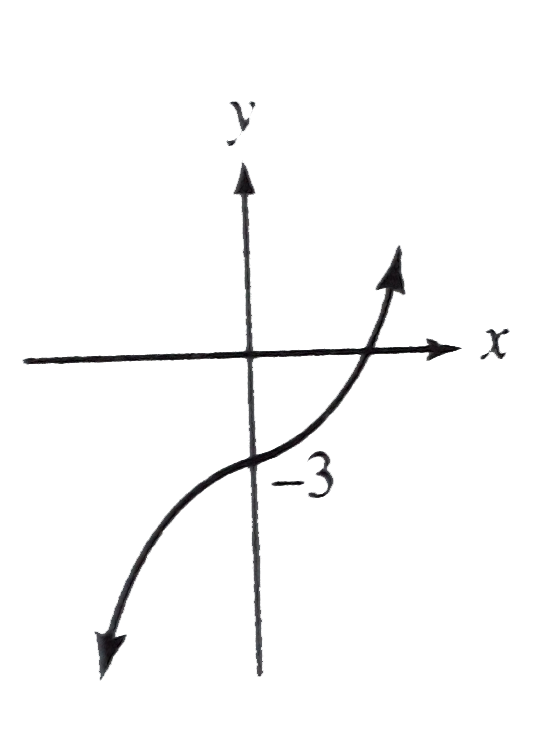
The graph of y=f(x) is as shown in the following figure.
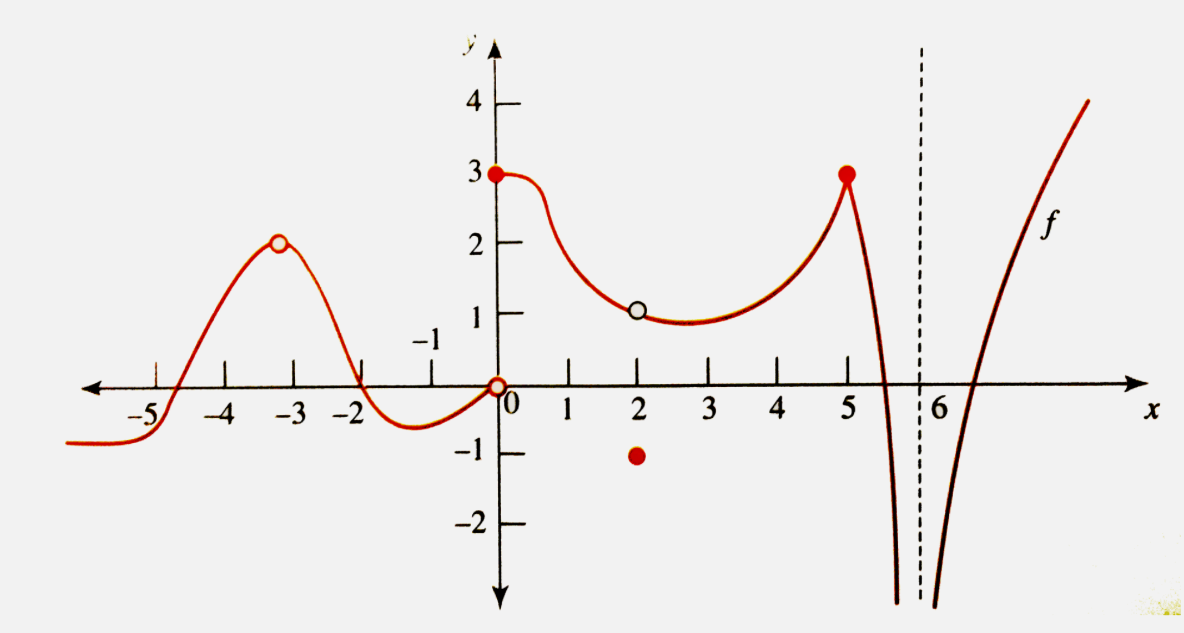
Identify the points of discontinuity and give the reason for the same.
View SolutionIf graph of y= f(x) is as shown in figure, then which of the following options is/are correct?
View SolutionThe graph of y =g(x) =f(X) is as shown in the following figure analyse this graph and answer the following question
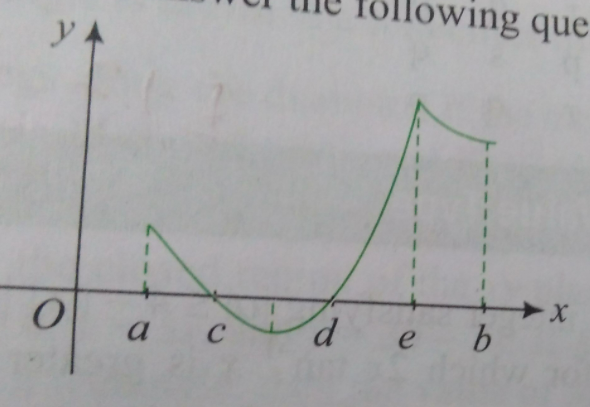
Number of points of inflectionn the graph of y = f(x) for a<x<b has
View SolutionThe graph of y=f(x) is as shown in the following figure. Draw the graph of y=[f(x)].
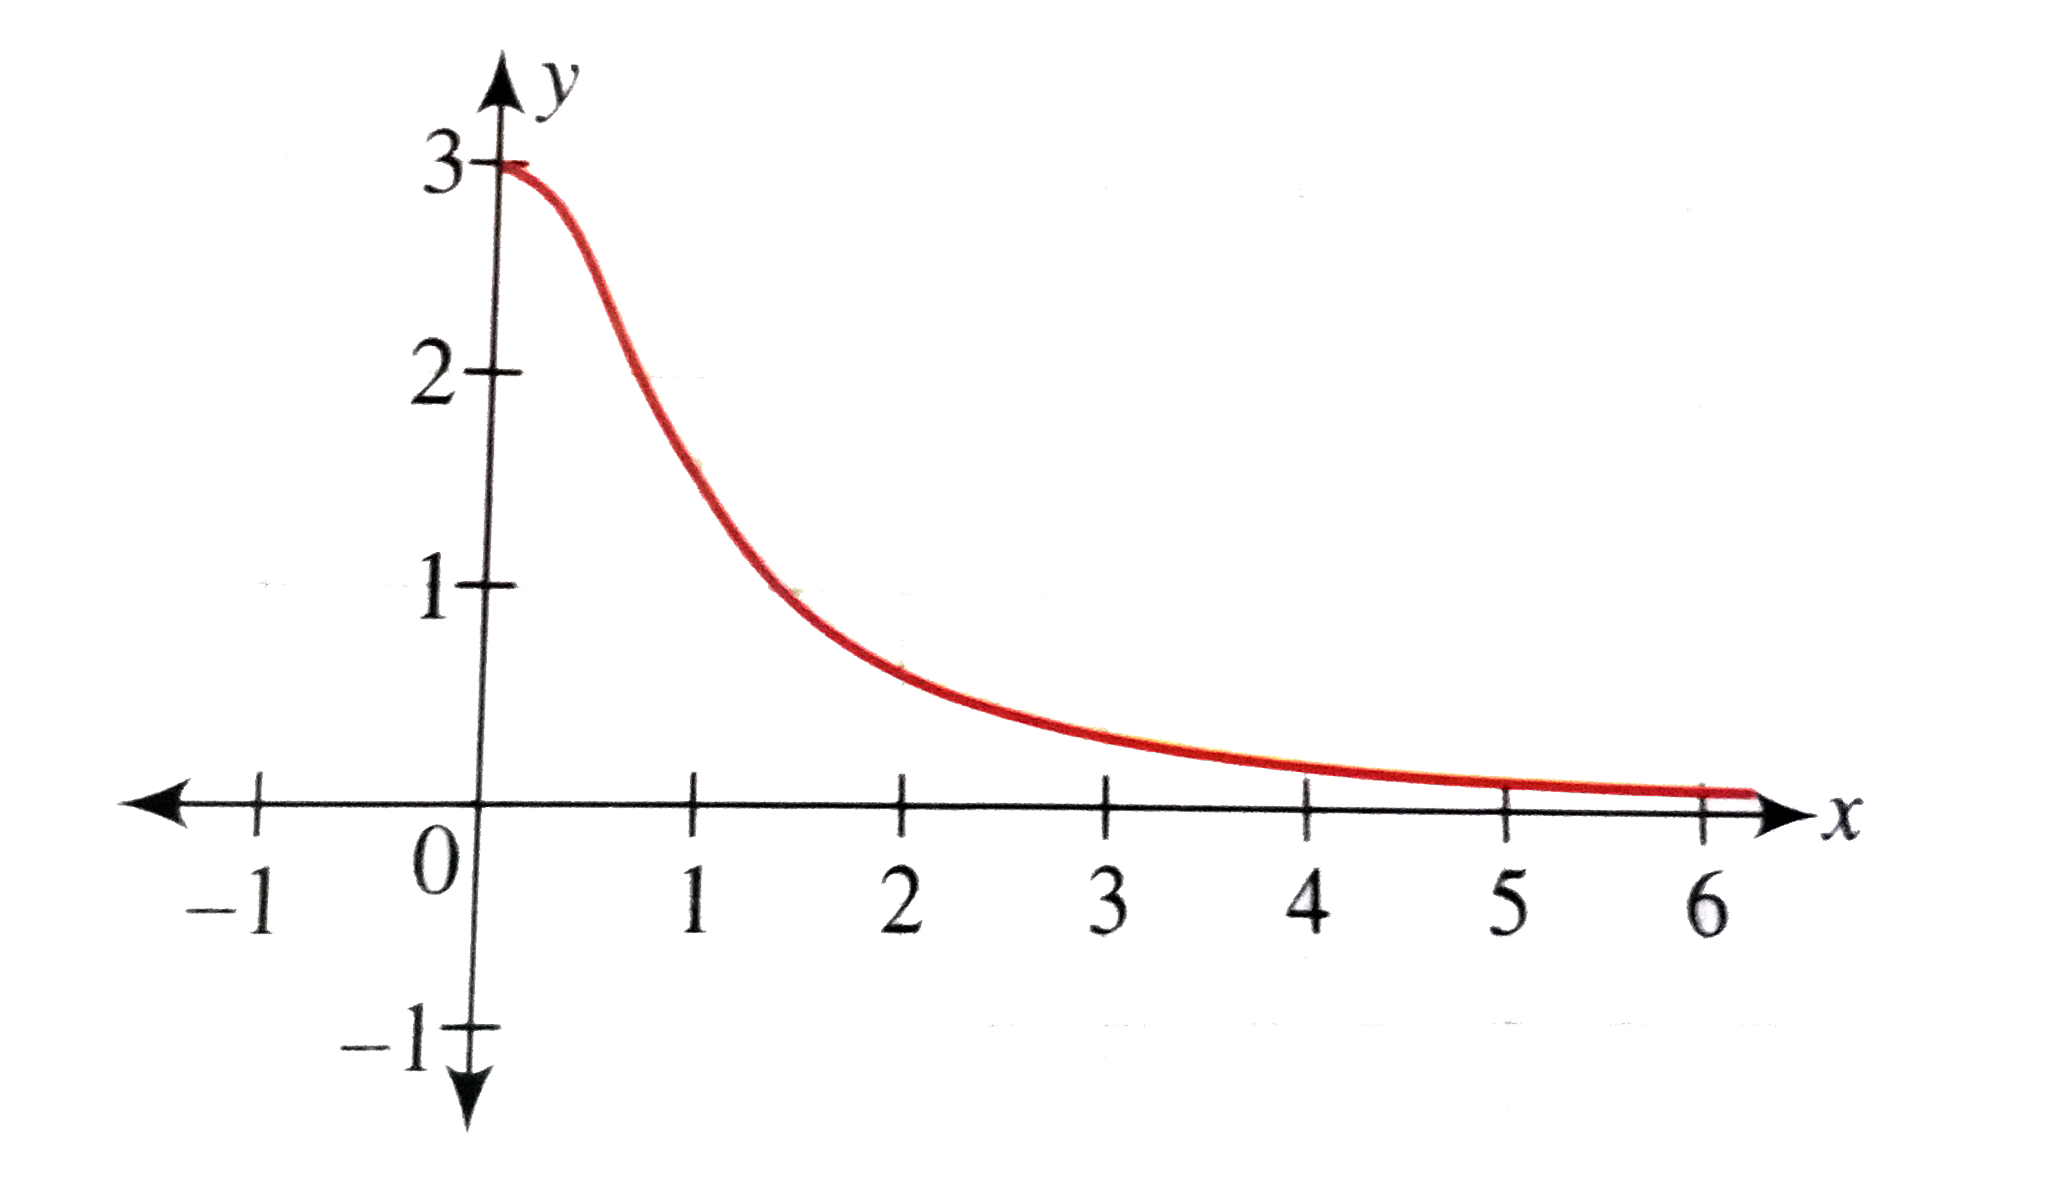
View SolutionThe graph of y=f(x) is as shown in the following figure. Draw the graph of y=[f(x)].

View SolutionThe graph of y=|f(x)| is as shown in the following figure Fig Graph of y=f(x) may be a, b, c d is fig
View Solution
