The figure below shows a circuit and its input voltage Vi as function time t

Assuming the diodes to be ideal, which of the following graphs depicts the output voltage v0 as function of time t


The correct Answer is:A
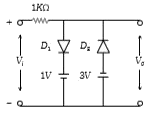
V0=Vi when no current flow through 1kΩ for negative values of Vi
D1 is in reverse bias i.e. Off (always)
D2 is in reverse bias upto 3V
From 0 to −3V, Vi=V0
From −3 to −4V, V0=−3V
For positive values of Vi
D1 is in reverse bias upto 1V
D2 is in reverse bias (always)
From 0 to IV , Vi=V0
From 1 to 4V , V0=1V
So, correct graph is (a).
Topper's Solved these Questions
- BOOK - ERRORLESSCHAPTER - ELECTRONICSEXERCISE - NCERT Based Questions (Junction Transistor)29videos
ELECTRONICS
- BOOK - ERRORLESSCHAPTER - ELECTRONICSEXERCISE - NCERT Based Questions (Digital Electronics)23videos
ELECTRONICS
- BOOK - ERRORLESSCHAPTER - ELECTRONICSEXERCISE - Assertion & Reason26videos
ELECTRONICS
- BOOK - ERRORLESSCHAPTER - ELECTRON, PHOTON, PHOTOELECTRIC EFFECT & X -RAYEXERCISE - ASSERTION & REASON27videos
ELECTRON, PHOTON, PHOTOELECTRIC EFFECT & X -RAY
- BOOK - ERRORLESSCHAPTER - ELECTROSTATICSEXERCISE - ASSERTION & REASON25videos
ELECTROSTATICS
Similar Questions
Knowledge Check
- Question 1 - Select One
The figure below shows a circuit and its input voltage vi as function of time t.
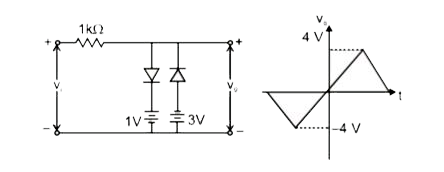
Assuming the diodes to be ideal, which of the following graphs depicts the output voltage v0 as function of time t ?A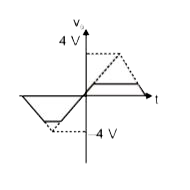 B
B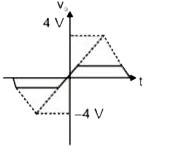 C
C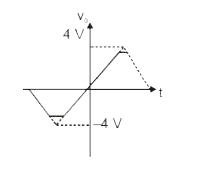 D
D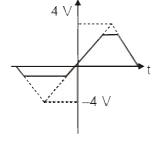
- Question 2 - Select One
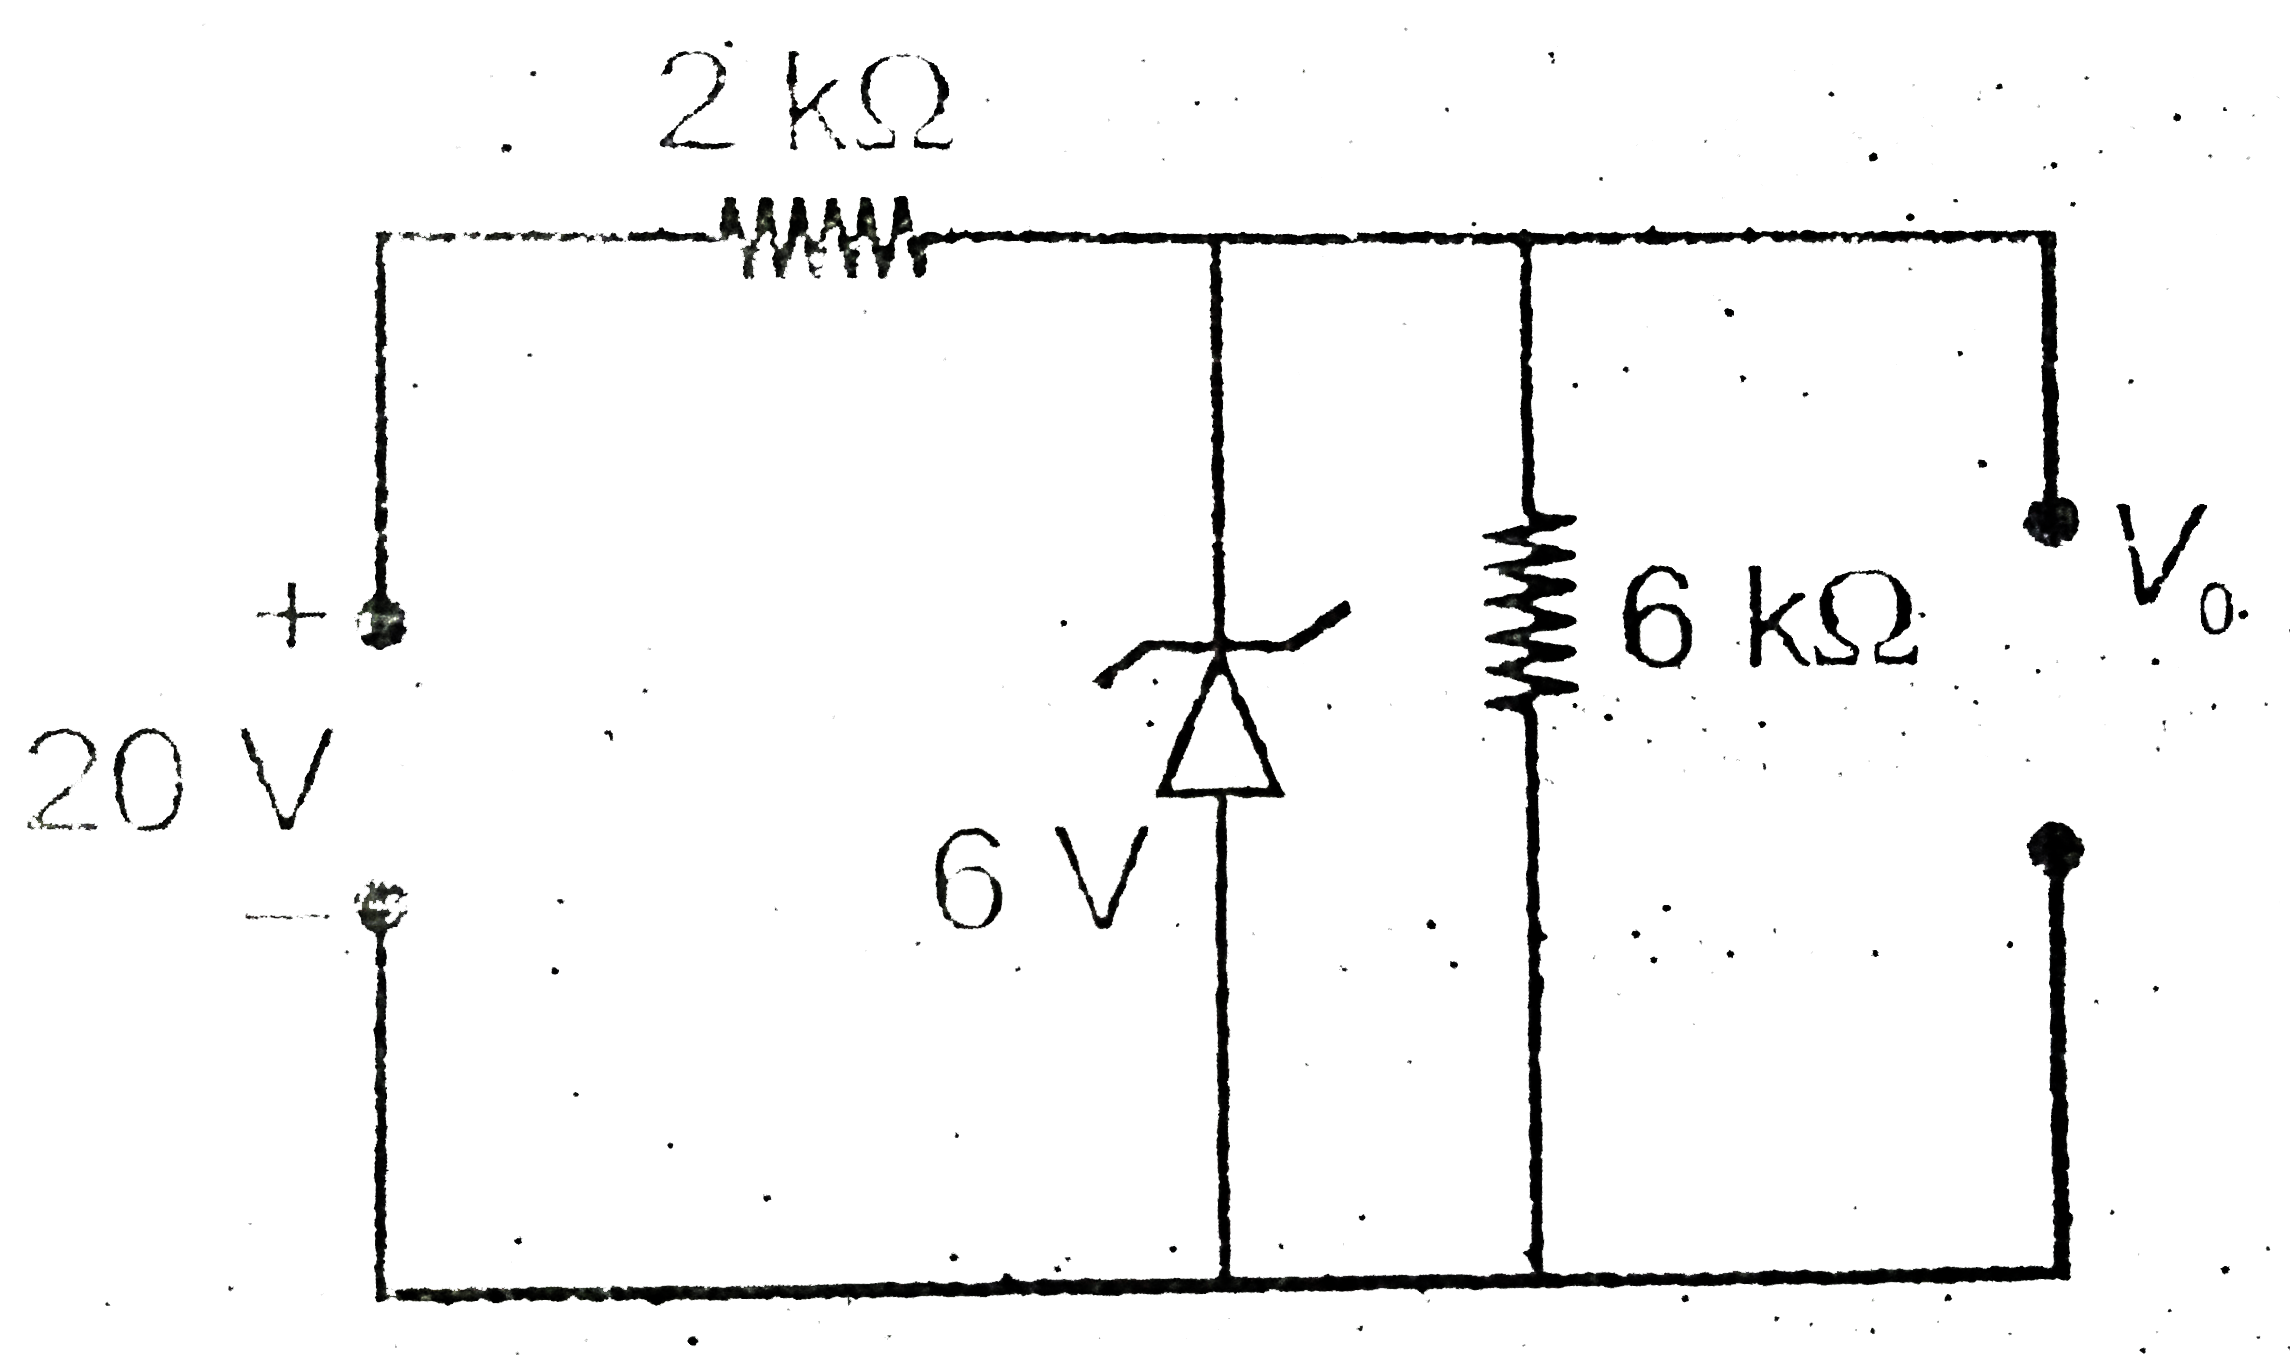
In the circuit shown in figure, Voltage V0 is
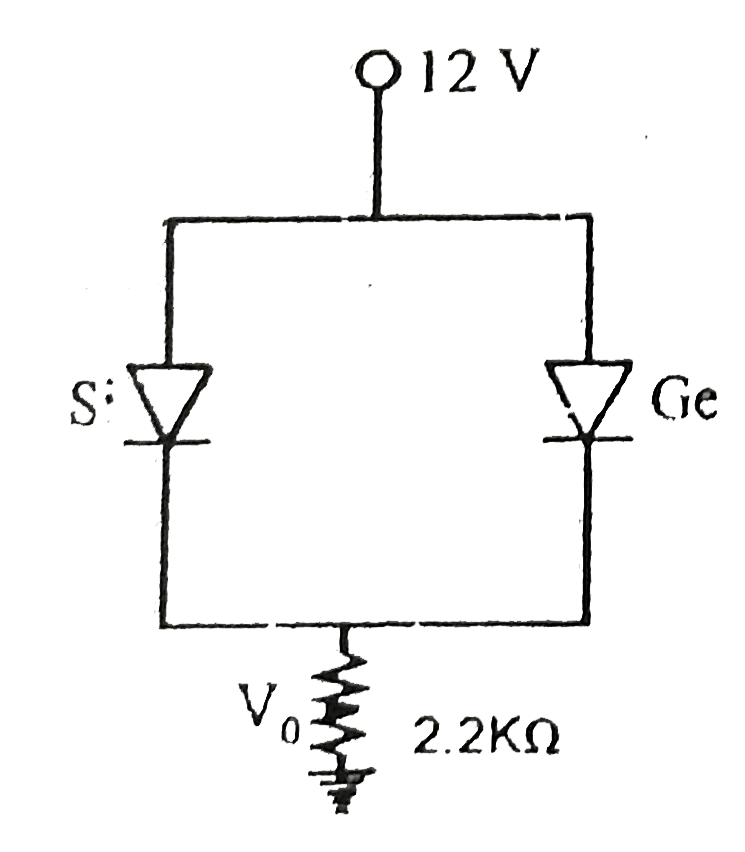 A11.7 voltB11.3 voltC0DNone
 - Question 3 - Select One
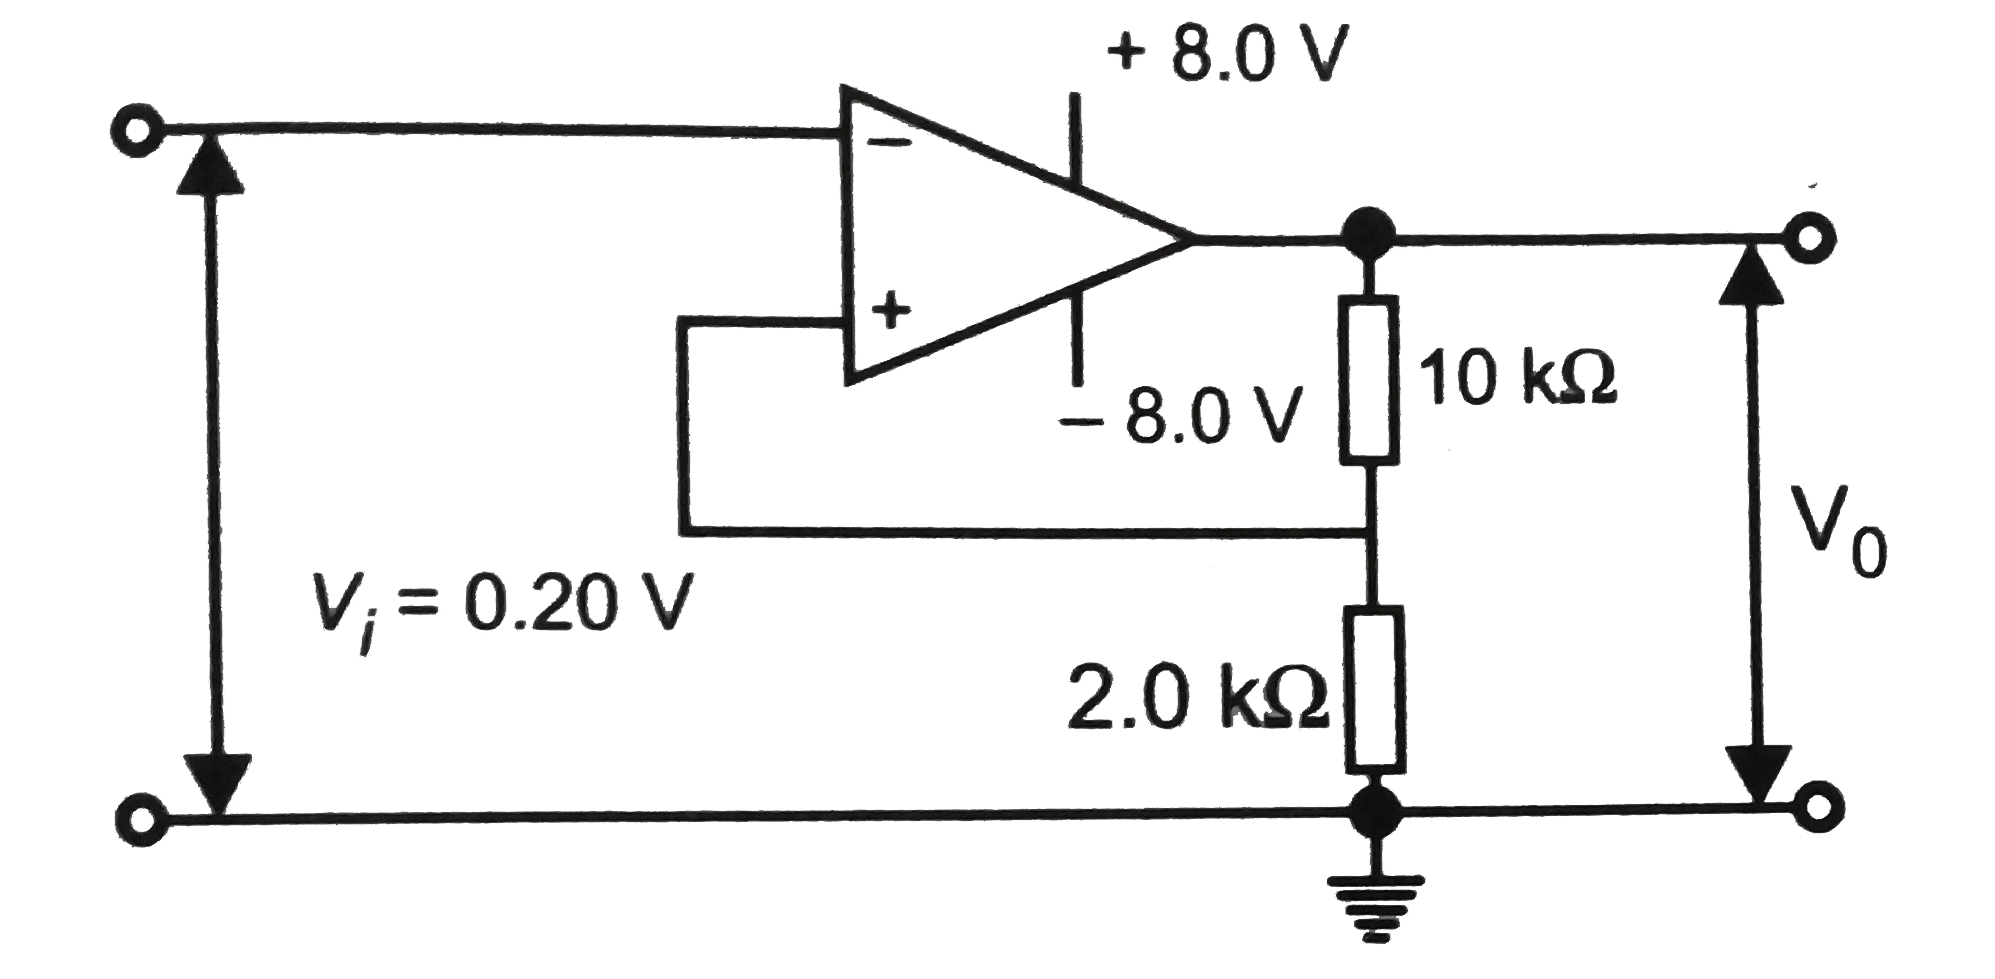
In the circuit shown in figure the maximum output voltage V0 is
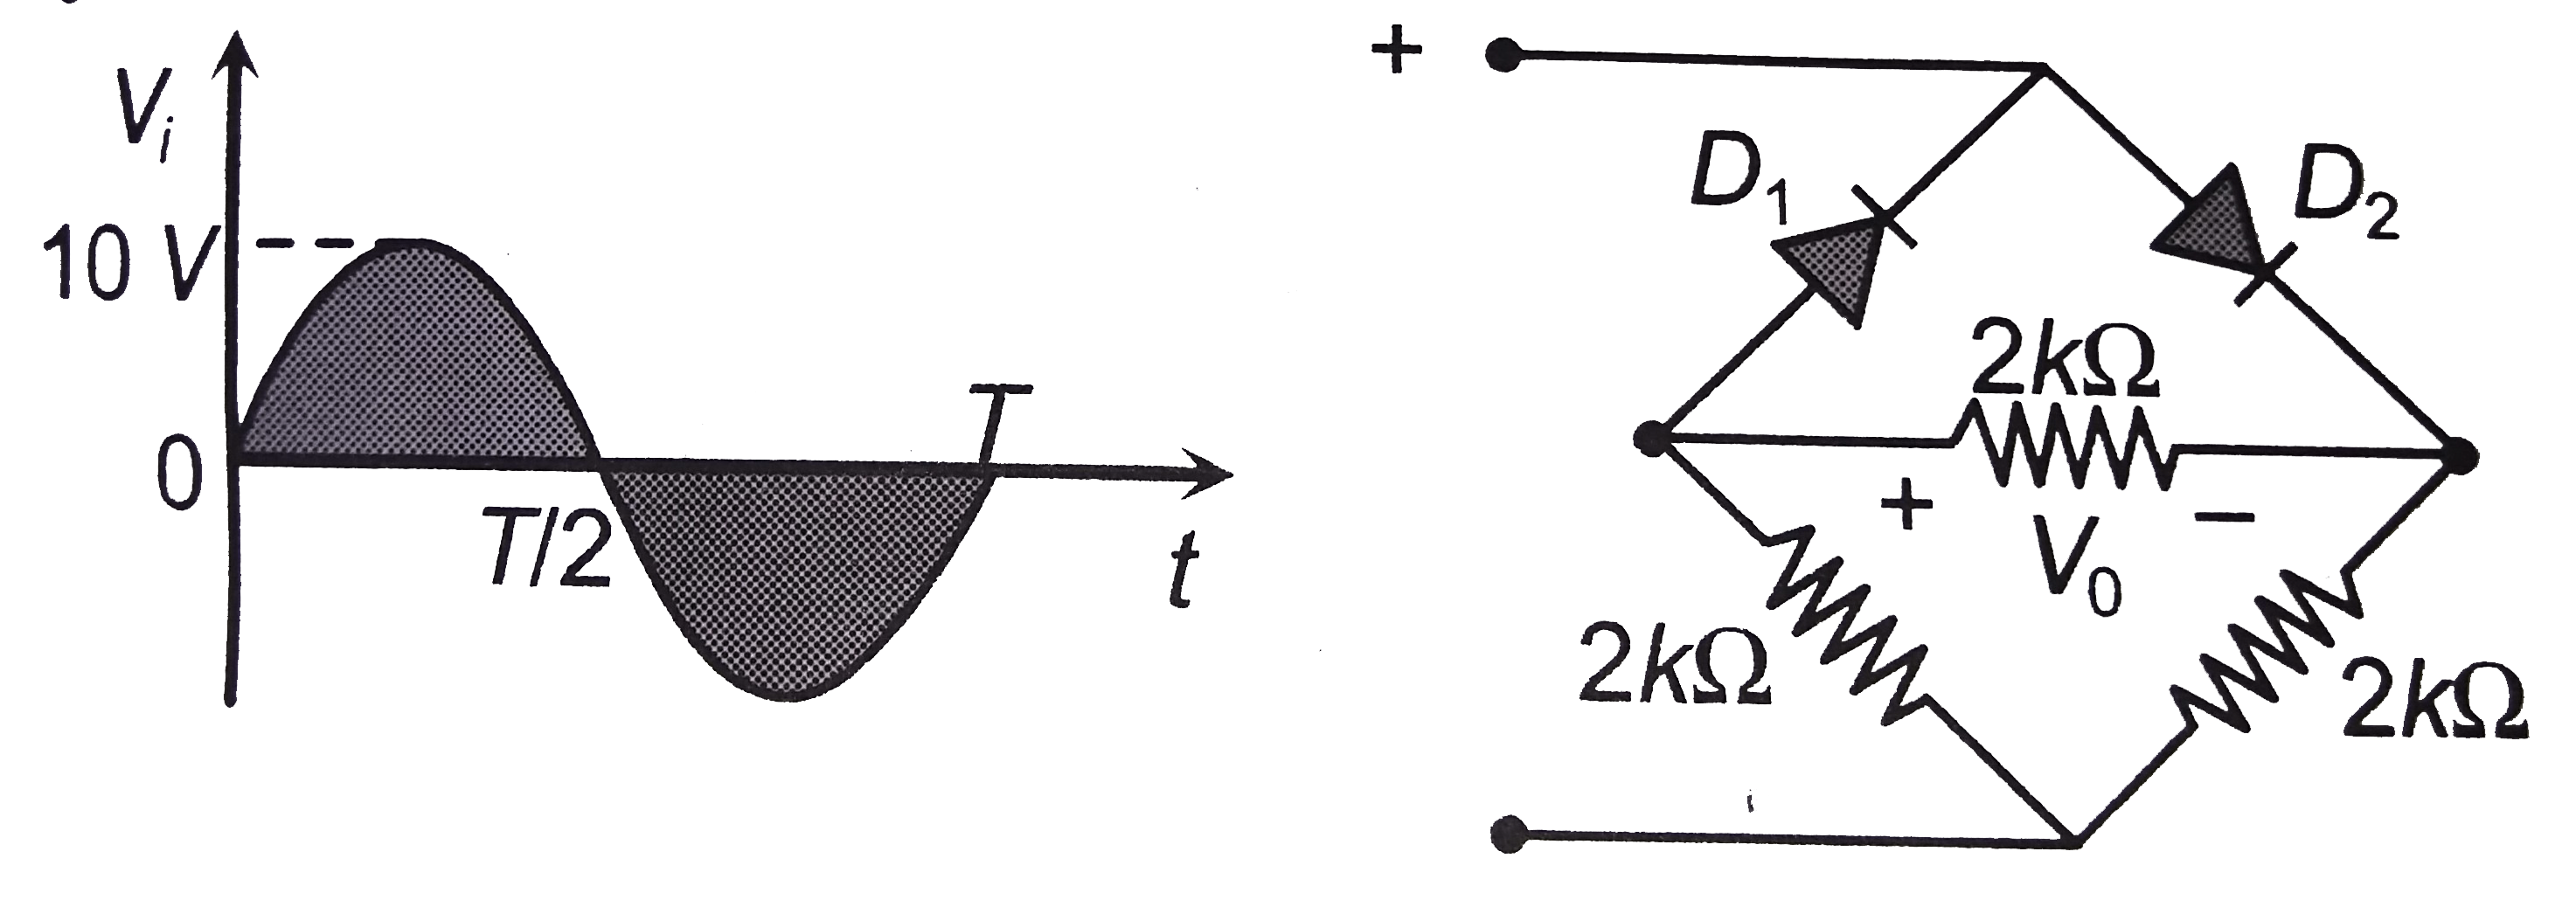 A0VB5VC10VD5√2V
The graph between the current and the time for an inductance coil is shown below. Which of the following graph show the voltage-time variation-
 View Solution
In the figure, D is an ideal diode and an alternating voltage of peak value 10 volts si connected as input V1. Which of the following figures represents the correct waveform of output voltage V0 ?
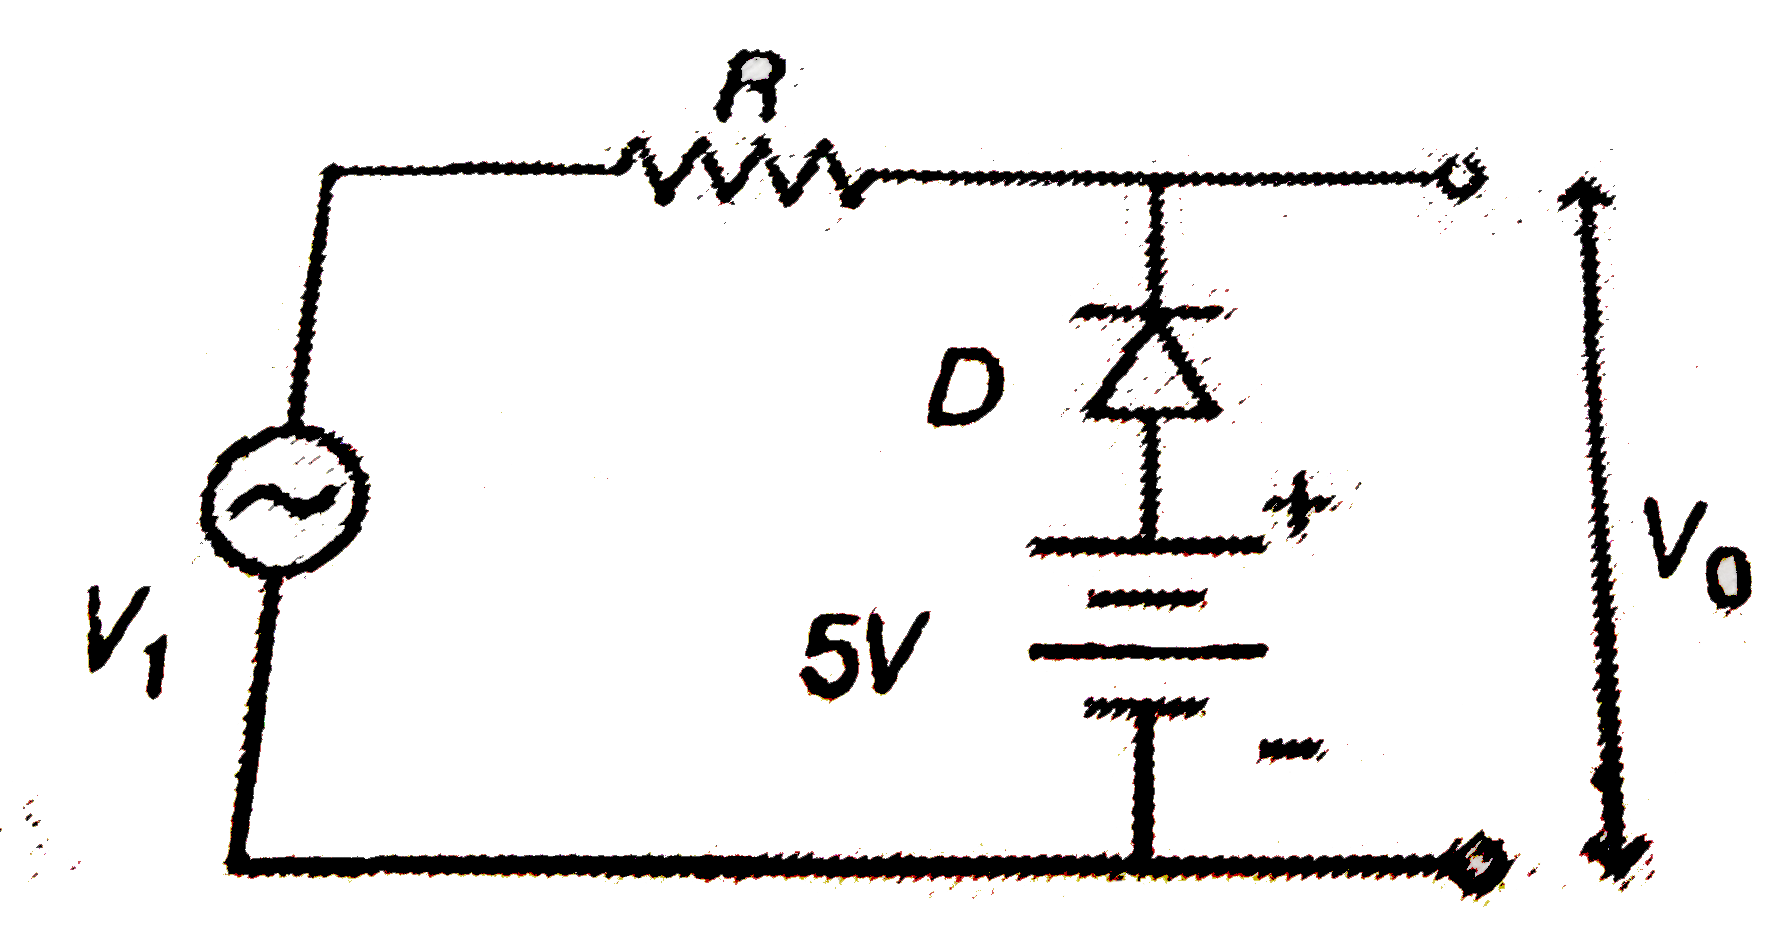 View Solution
If the input voltage Vi to the circuit below is given by Vi(t)=Acos(2πft), the output voltage is given by Vo(t)=Bcos(2πft+ϕ)-

Which one of the following four graphs best depict the variation of ϕ vs f ?View SolutionWhich of the following shows the velocity (v) - time (t) graph for a falling apple?
View SolutionFor a RLC series circuit , phasors of current i and applied voltage V=V0sinωt are shown in diagram at t=0, which of the following is/are CORRECT?
View Solution


