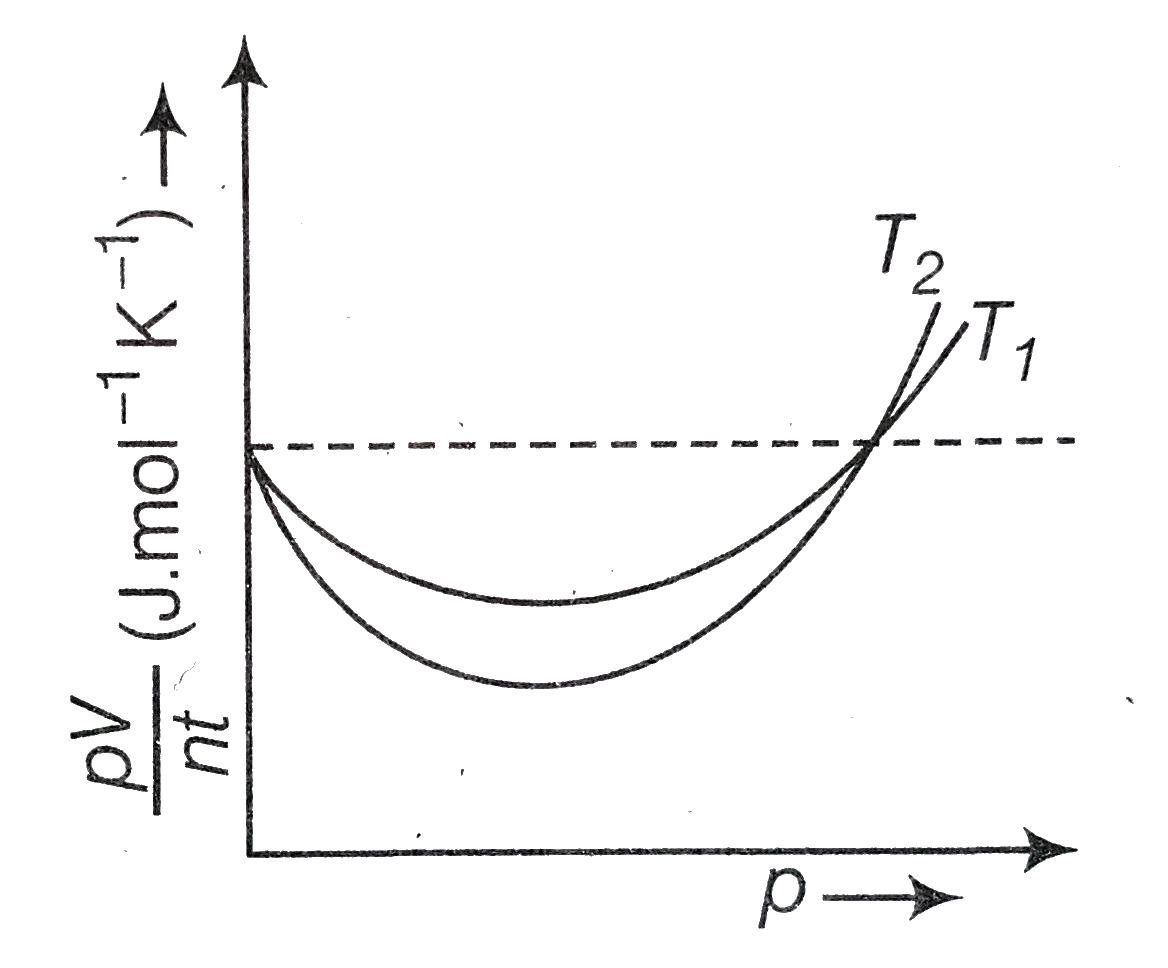
The figure below shows the plot of PVnT versus P for oxygen gas at two different temperatures

Read the following statements concerning the above curves:
(i) The dotted line comesponds to the ideal gas behaviour
(ii) T1>T2
(iii) The value of PVnT at the point where the curves meet on the y-axis is the same for all gases
Which of the above statement is true
(i) only
(i) and () only
All of these
None of these
The correct Answer is:C
(i) PVnT = constant for dotted lines, i.e. behaves ideally.
(ii) At high temperature, deviation of the gas is less and at low temperature the deviation of gas is more i.e. T1>T2
(iii) Since, two curves intersect at dotted line, so the value of PVnT at that point on the y-axis is same for all gases.
Topper's Solved these Questions
- BOOK - ERRORLESSCHAPTER - KINETIC THEORY OF GASES EXERCISE - ASSERTION AND REASON16videos
KINETIC THEORY OF GASES
- BOOK - ERRORLESSCHAPTER - KINETIC THEORY OF GASES EXERCISE - NCERT BASED QUESTIONS (Pressure and Energy)31videos
KINETIC THEORY OF GASES
- BOOK - ERRORLESSCHAPTER - GRAVITATIONEXERCISE - Assertion and Reason25videos
GRAVITATION
- BOOK - ERRORLESSCHAPTER - MOTION IN ONE DIMENSIONEXERCISE - ASSERTION AND REASON24videos
MOTION IN ONE DIMENSION
Similar Questions
Knowledge Check
- Question 1 - Select One
The figure shows the plot of PVnT vs P, for oxygen gas at two different temperatures then
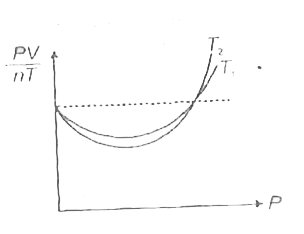 AT1>T2BT2>T1CT1=T2Dmay be (1) & (2)
 - Question 2 - Select One
The figure below shows the plot of PVnT versus P for oxygen gas at two different temperatures
Read the following statements concerning the above curves.
(i) The dotted line corresponds to the ideal gas behaviour
(ii) T1>T2
The value of pVnT at the point where the curves meet on the y-axis is the same for all gases Which of the above statements is true ?A(i) onlyB(i) and (ii) onlyCAll of theseDNone of these - Question 3 - Select One
All curves for real gases approach the ideal gas behaviour at
Alow pressure onlyBhigh temperatures onlyClow pressures and high temperaturesDhigh pressures and low temperatures
What is the nature of graph of PV versus P for a given mass of a gas at constant temperature?
View SolutionFigure shows plot of PV/T versus Pfor1.00×10−3 kg of oxygen gas at two different temperatures.
(i) What does the dotted plot signify?
(ii) Which is true . T1>T2orT1<T2?
(iii) What is the value of PV/T where the curves meet on the y-axis?_E01_262_Q01.png) View Solution
View SolutionIf lines T1andT2 are tangent to the curve y=x2−3x+2 at the points where the curve meets the X- axes , then
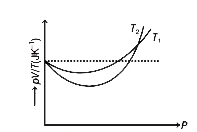
View SolutionThe figure shows the graph of pVT versus p for 2×10⁻⁴ kg of hydrogen gas at two different temperatures, where p,V andT represents pressure, volume and temperature respectively. Then, the value of pVT where the curve meet on the vertical axis, is
 View Solution
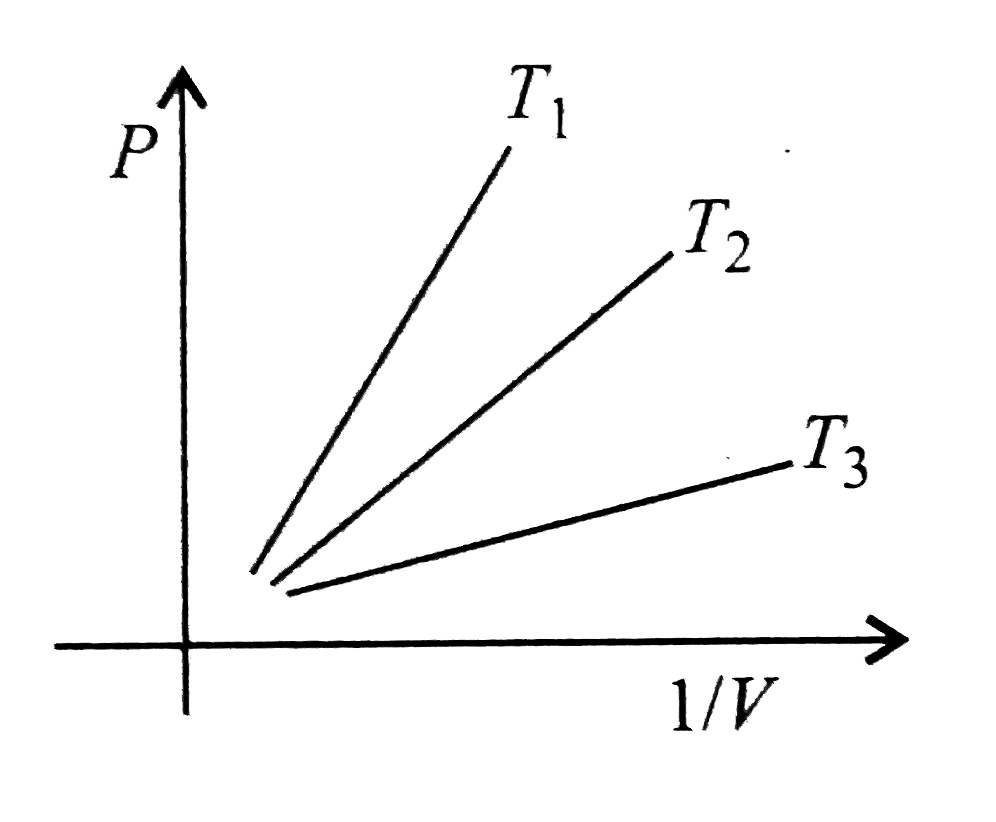
The curve drawn below shows the variations of P as a function of 1/V for a fixed mass and temperature of an ideal gas. It follows from the curve that:
 View Solution


