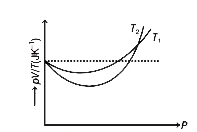
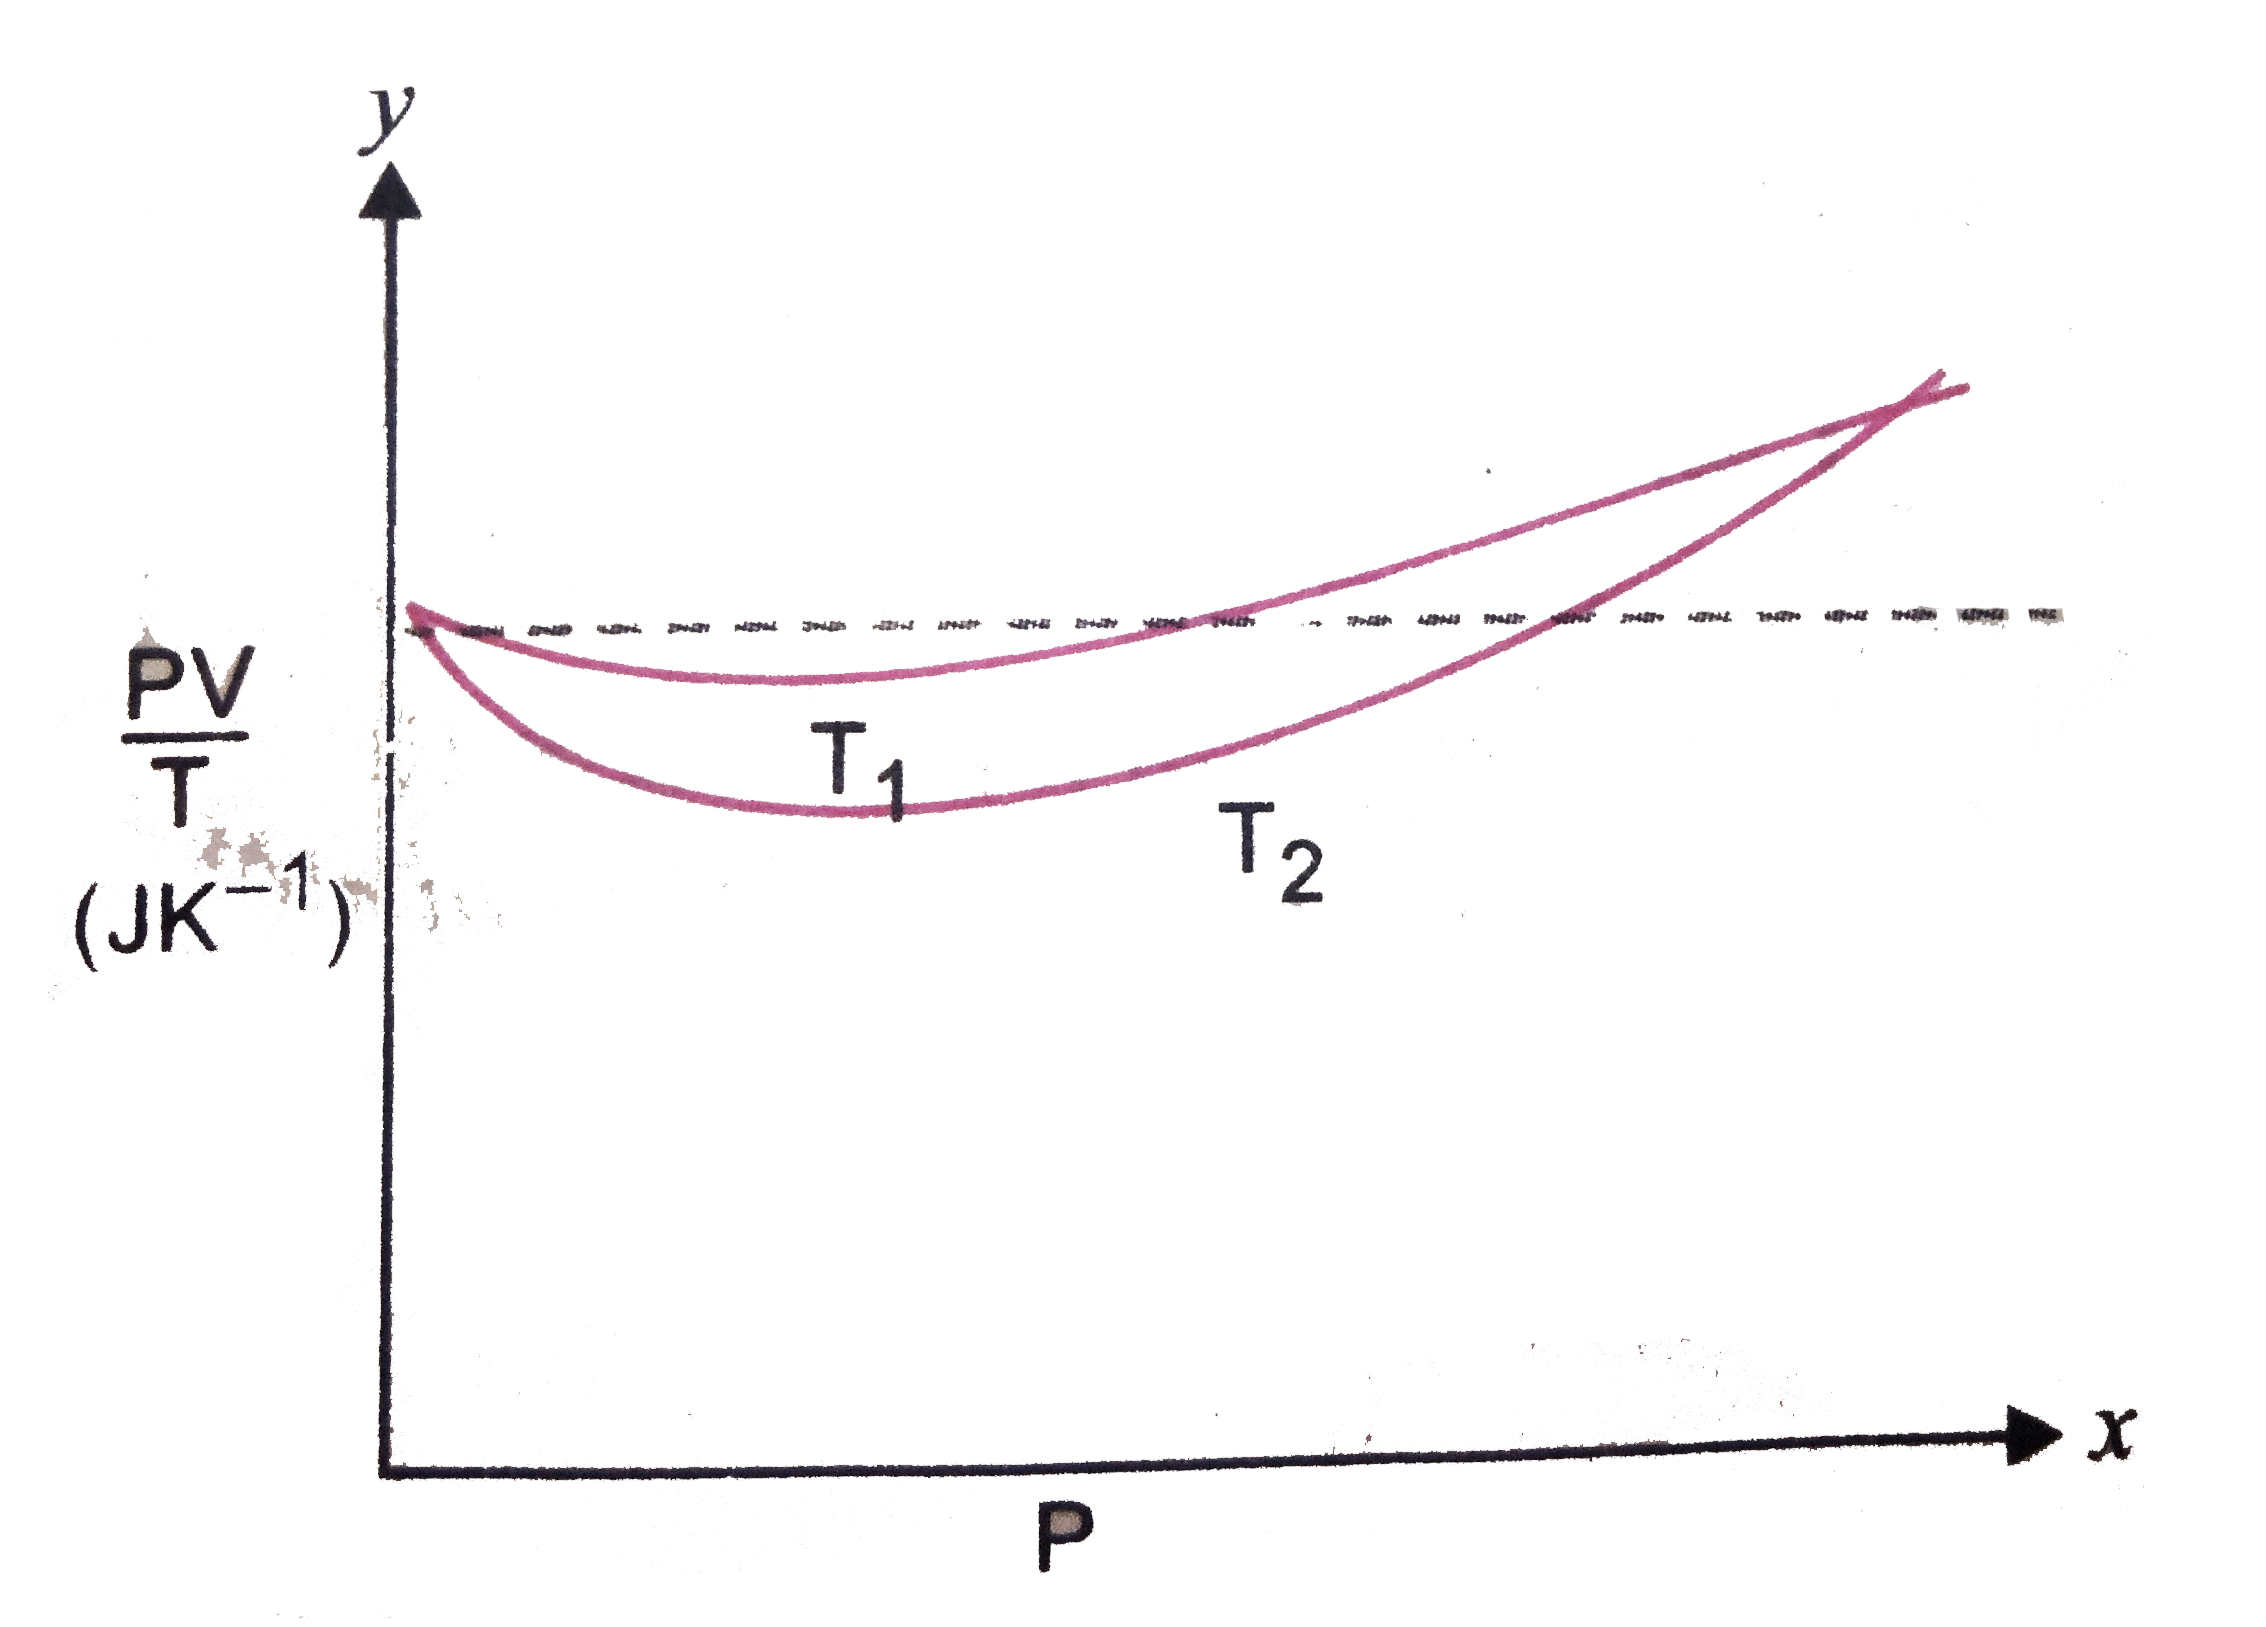
The figure shows the graph of pVT versus p for 2×10⁻⁴ kg of hydrogen gas at two different temperatures, where p,V andT represents pressure, volume and temperature respectively. Then, the value of pVT where the curve meet on the vertical axis, is

R5
2R3
R10
R15
The correct Answer is:A
Number of moles in 2×10⁻⁴kg
μ=mass of hydrogen in gramMolecules mass
=2×10−4×1032
=0.1 mole
∴pV=μRT
pVT=μR=0.1×R=R10
Topper's Solved these Questions
Similar Questions
Figure shows plot of PV/T versus Pfor1.00×10−3 kg of oxygen gas at two different temperatures.
(i) What does the dotted plot signify?
(ii) Which is true . T1>T2orT1<T2?
(iii) What is the value of PV/T where the curves meet on the y-axis?_E01_262_Q01.png) View Solution
View SolutionFig shows of PV/T versus P for 1.00×10⁻³kg of oxygen gas at two different temperatures.
(a) What does the dotted plot signify ?
(b) Which is true : T1<T2orT2<T1?
( c) What is the value of PV/T where the curves meet on the Y-axis ?
(d) If we obtained similar plot for 1.00×10⁻³kg of hydrogen, would we get the same value of PV/T at the point where the curves meet on the y-axis ? If not, what mass of hydrogen yield the same value of PV/T (for low pressure high temperature region of the plot) ? (Molecular mass of H=2.02u, of O=32.0u,R=8.31Jmol−1K−1
 View Solution
Knowledge Check
- Question 1 - Select One
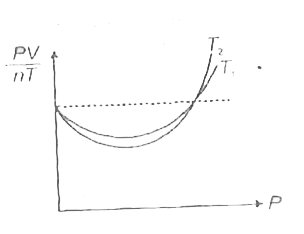
The figure shows the plot of PVnT vs P, for oxygen gas at two different temperatures then
 AT1>T2BT2>T1CT1=T2Dmay be (1) & (2)
 - Question 2 - Select One
If P,V,andT represent pressure, volume and temperature of the gas, the correct representation of Boyle's law is
AV∝1T (at constant P)BPV=RTCV∝1/P (at constant T)DPV=nRT - Question 3 - Select One
If P, V and T represent pressure, volume and temperature of the gas, the correct representation of Boyle's law is
AV∝1/P ( P is constant )BPV=RTCV∝1/P ( at constant T)DPV = nRT
The graph of (xm) vs P at two different temperature T1 and T2 is [where T1>T2]
View SolutionIf P,V,andT represent pressure, volume and temperature of the gas, the correct representation of Boyle's law is
View SolutionIf P, V, M, T and R are symbols of pressure, volume, molecular weight, temperature and Gas contstant, what is the equation of density of ideal gas
View SolutionWhat is the nature of graph of PV versus P for a given mass of a gas at constant temperature?
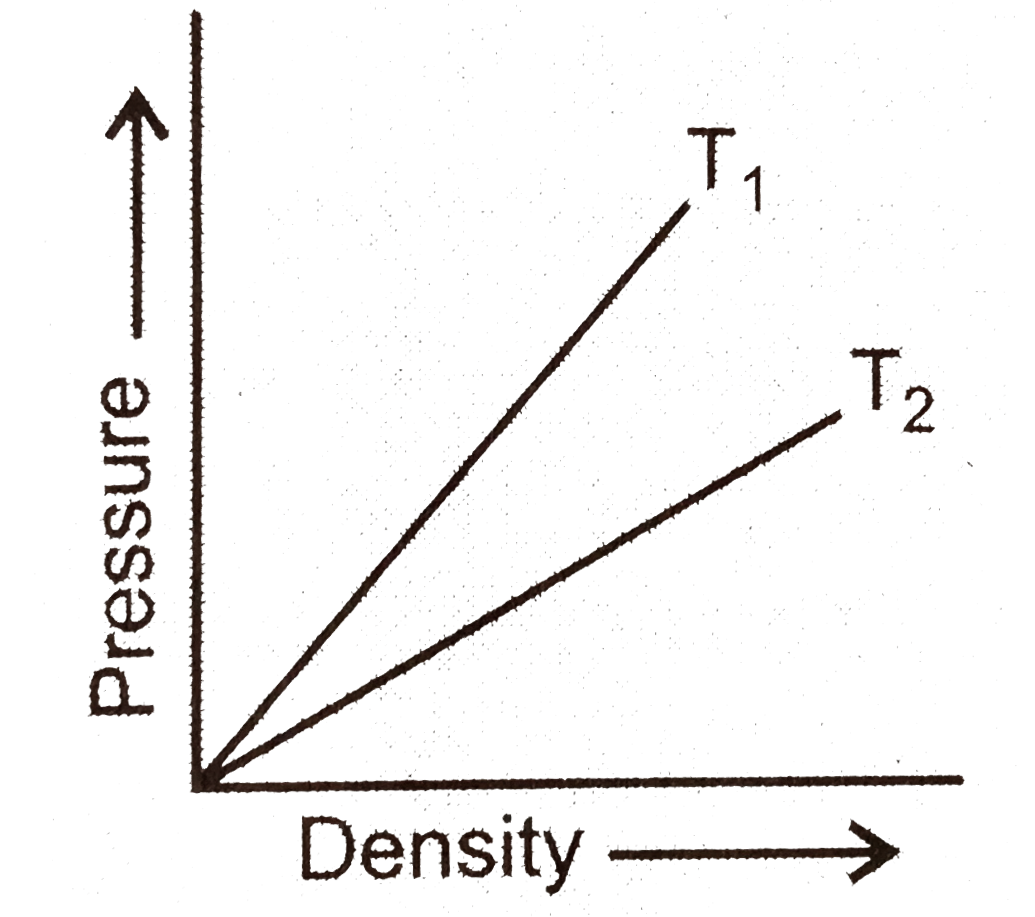
View SolutionFigure shows graphs of pressure versus density for an ideal gas at two temperatures T1 and T2 Which is correct ?
 .View Solution

