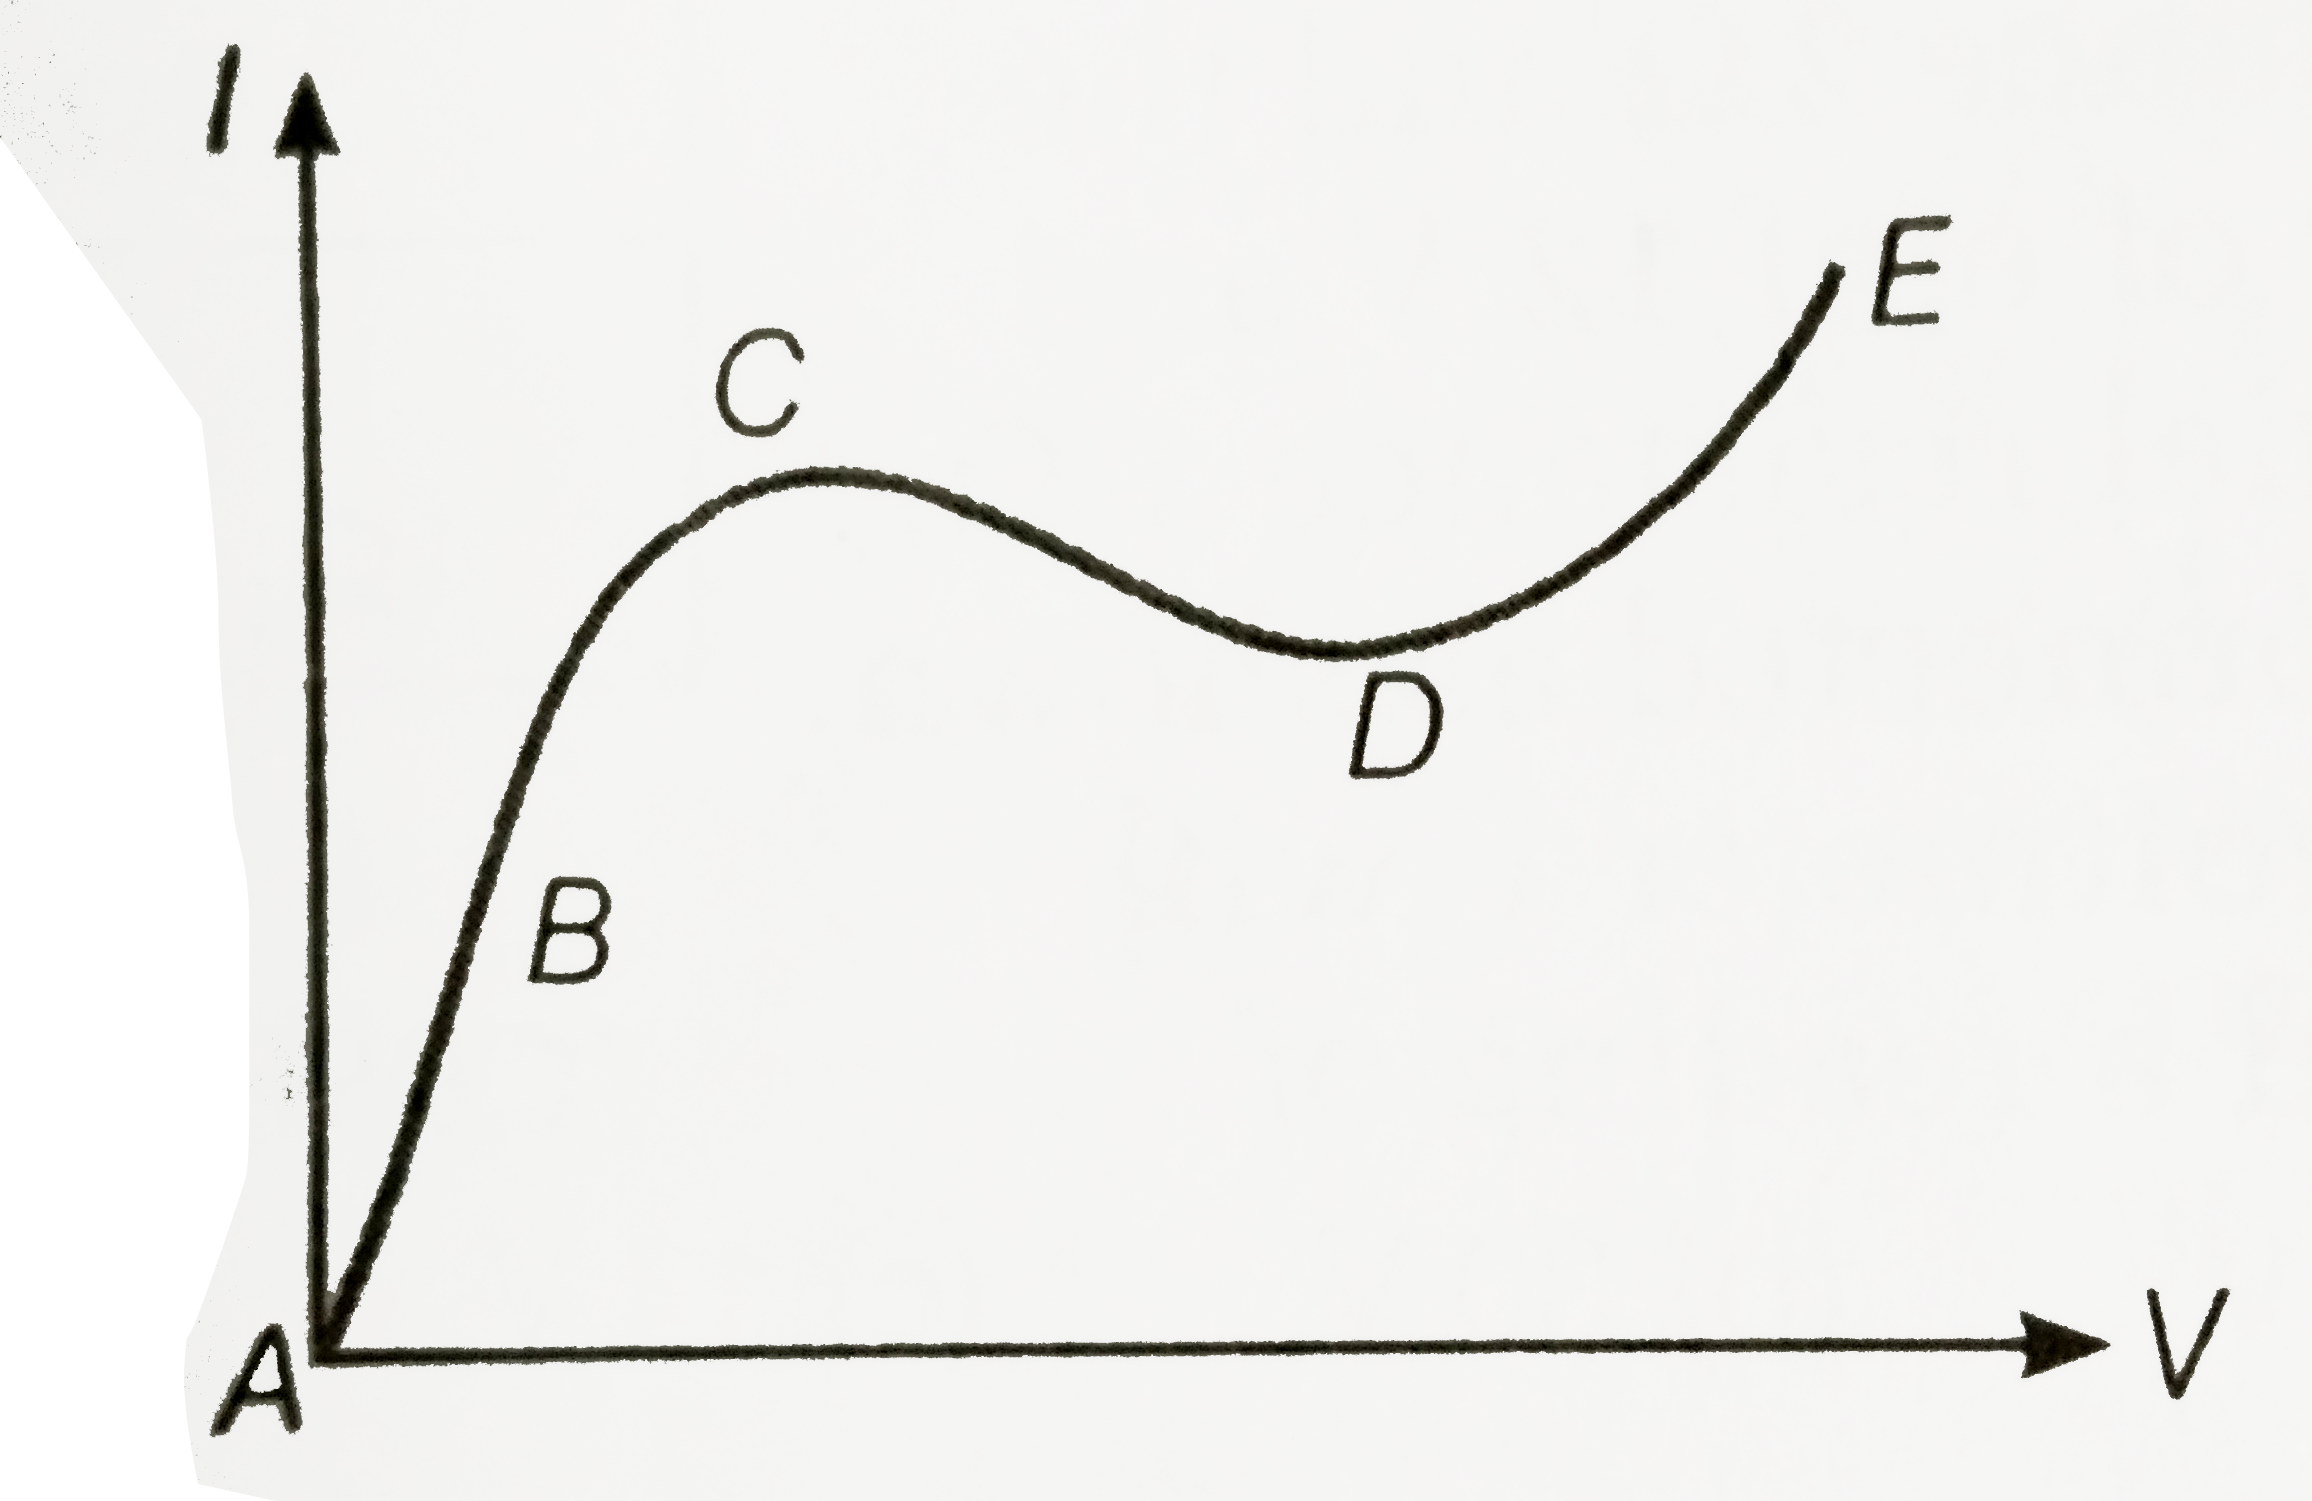
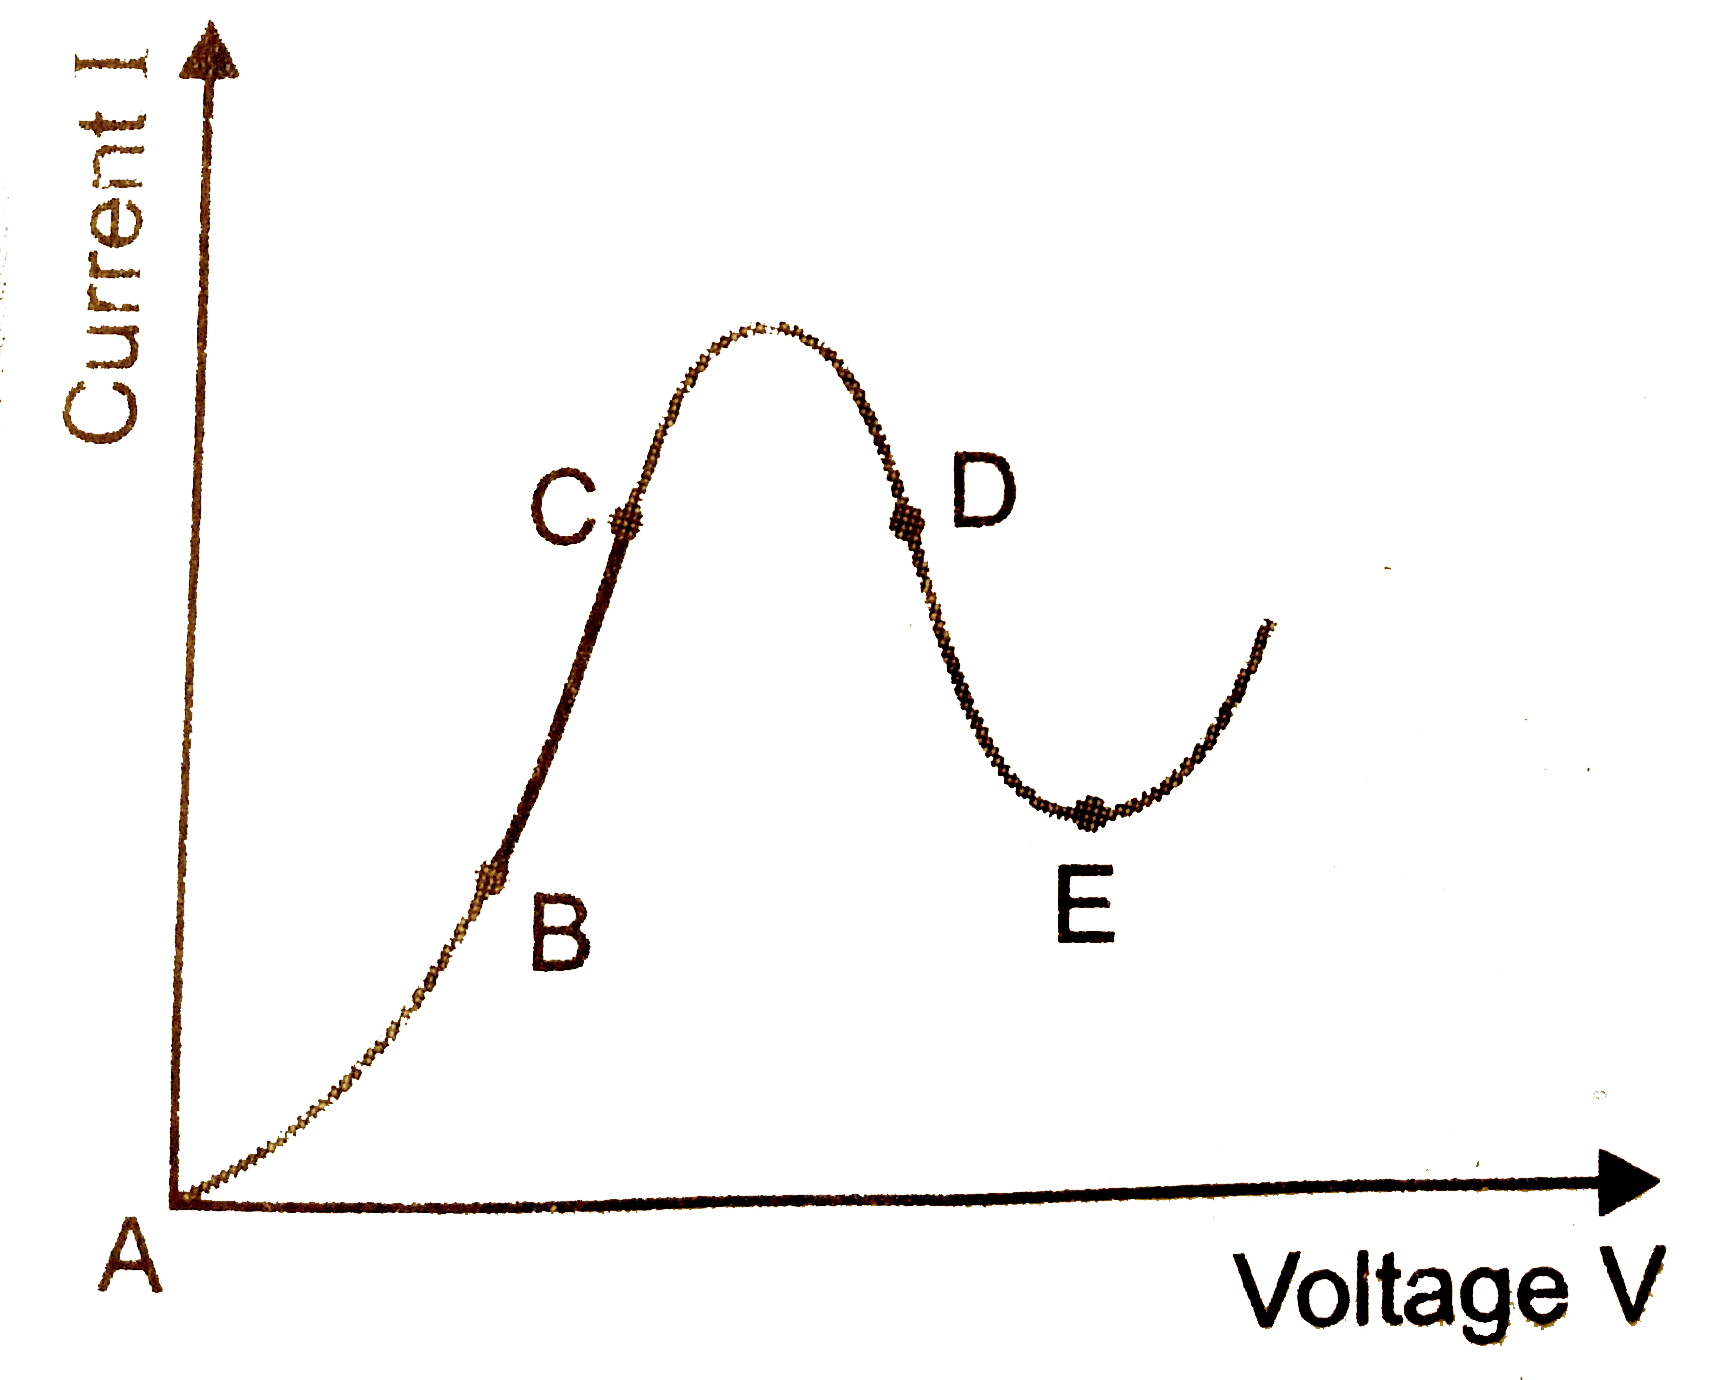
From the given between current I and voltage V shown in figure , indentify the portion corresponding to negative resistance
AB
BC
CD
DE
The correct Answer is:C
For CD portion, slope is −ve, hence resistance of C D part is −ve.
Topper's Solved these Questions
- CURRENT ELECTRICITYBOOK - ERRORLESSCHAPTER - CURRENT ELECTRICITYEXERCISE - ASSERTION AND REASON
26 Videos
- CURRENT ELECTRICITYBOOK - ERRORLESSCHAPTER - CURRENT ELECTRICITYEXERCISE - NCERT BASED QUESTIONS (HEATING EFFECT OF CURRENT)
67 Videos
- ATOMIC AND NUCLEAR PHYSICSBOOK - ERRORLESSCHAPTER - ATOMIC AND NUCLEAR PHYSICSEXERCISE - Assertion and Reason
23 Videos
- ELECTROMAGNETIC INDUCTIONBOOK - ERRORLESSCHAPTER - ELECTROMAGNETIC INDUCTIONEXERCISE - ASSERTION & REASON
20 Videos
Similar Questions
Knowledge Check
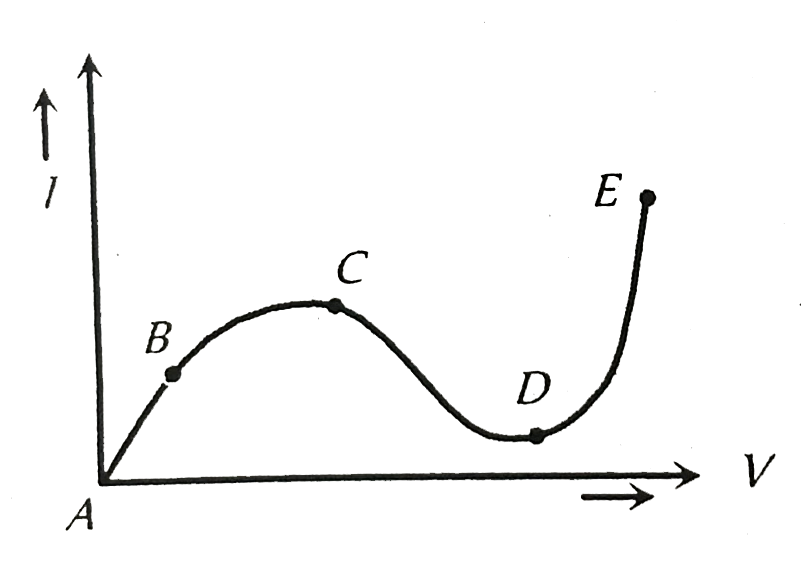
From the graph between current I and voltage V shown below, identify the portion corresponding to negative resistanc
 AABBBCCCDDDE
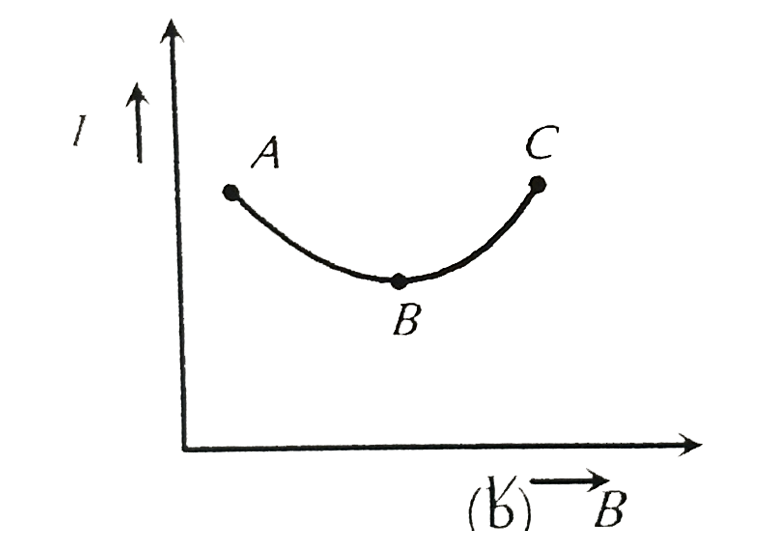
Resistance as shown in figure is negative at
 AABBCCDNone of these
The current-voltage graph of a device is shown in figure. The resistance is negative in region.
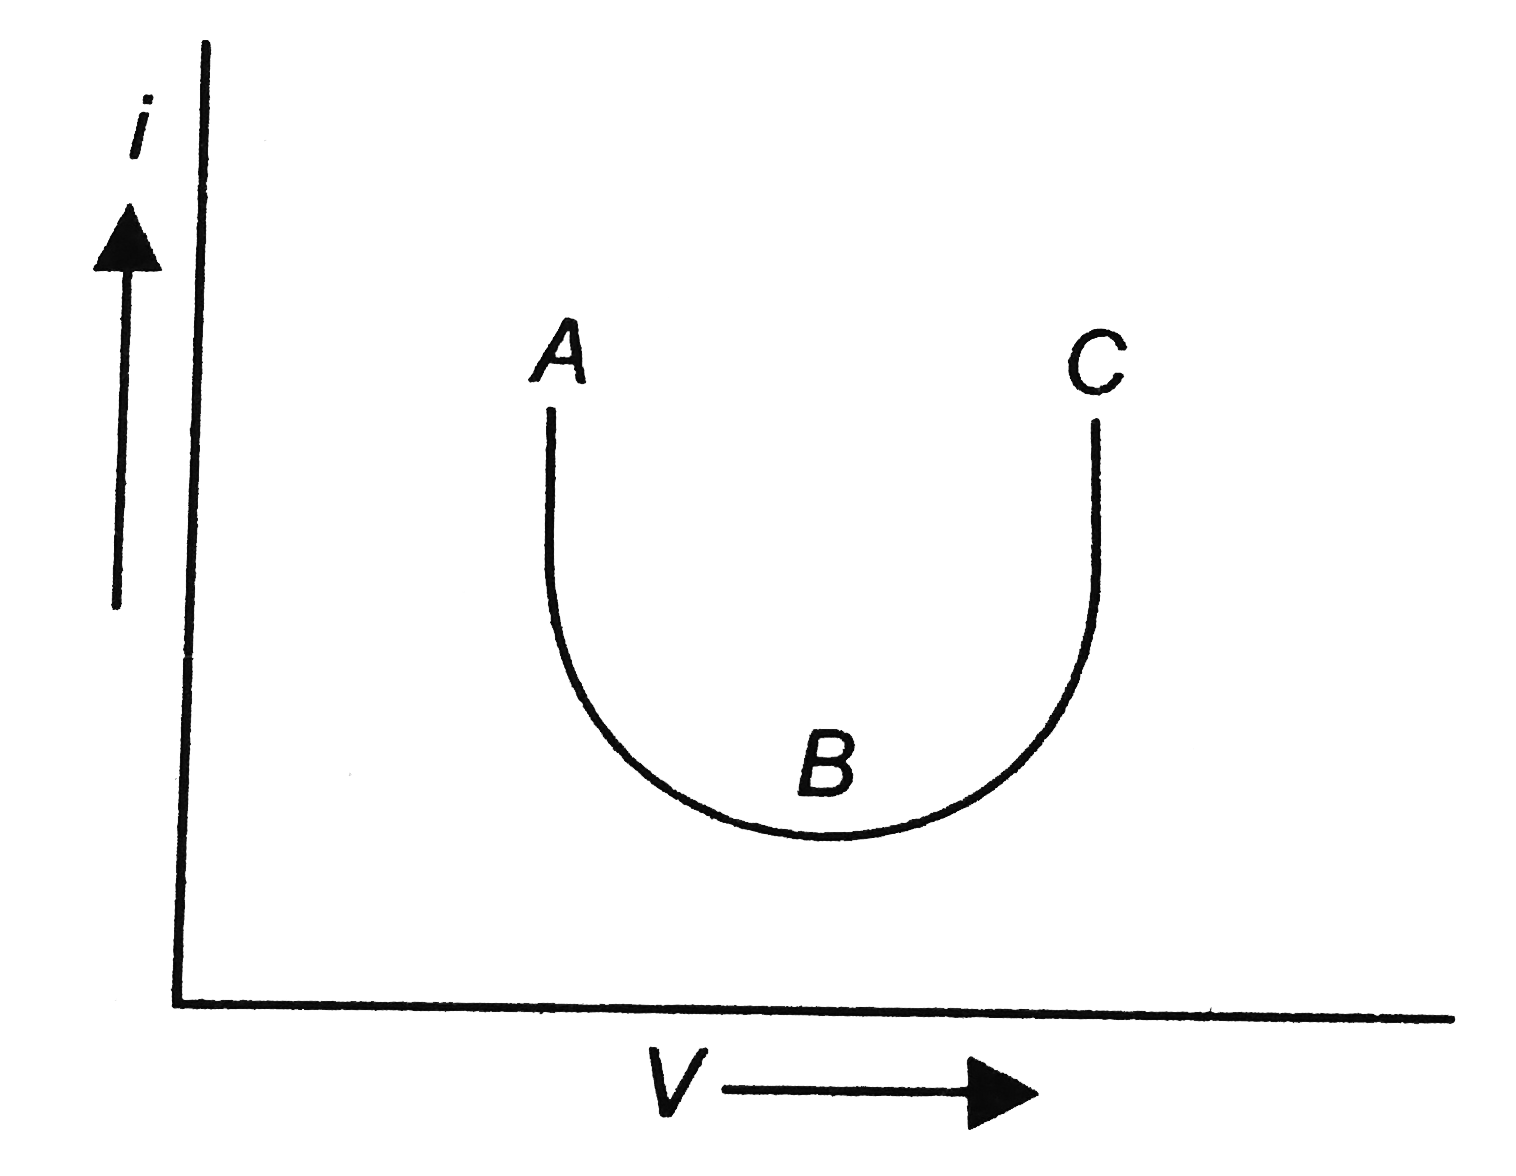 AABBBCCABCDNone of these
Find the current I & voltage V in the circuit shown.
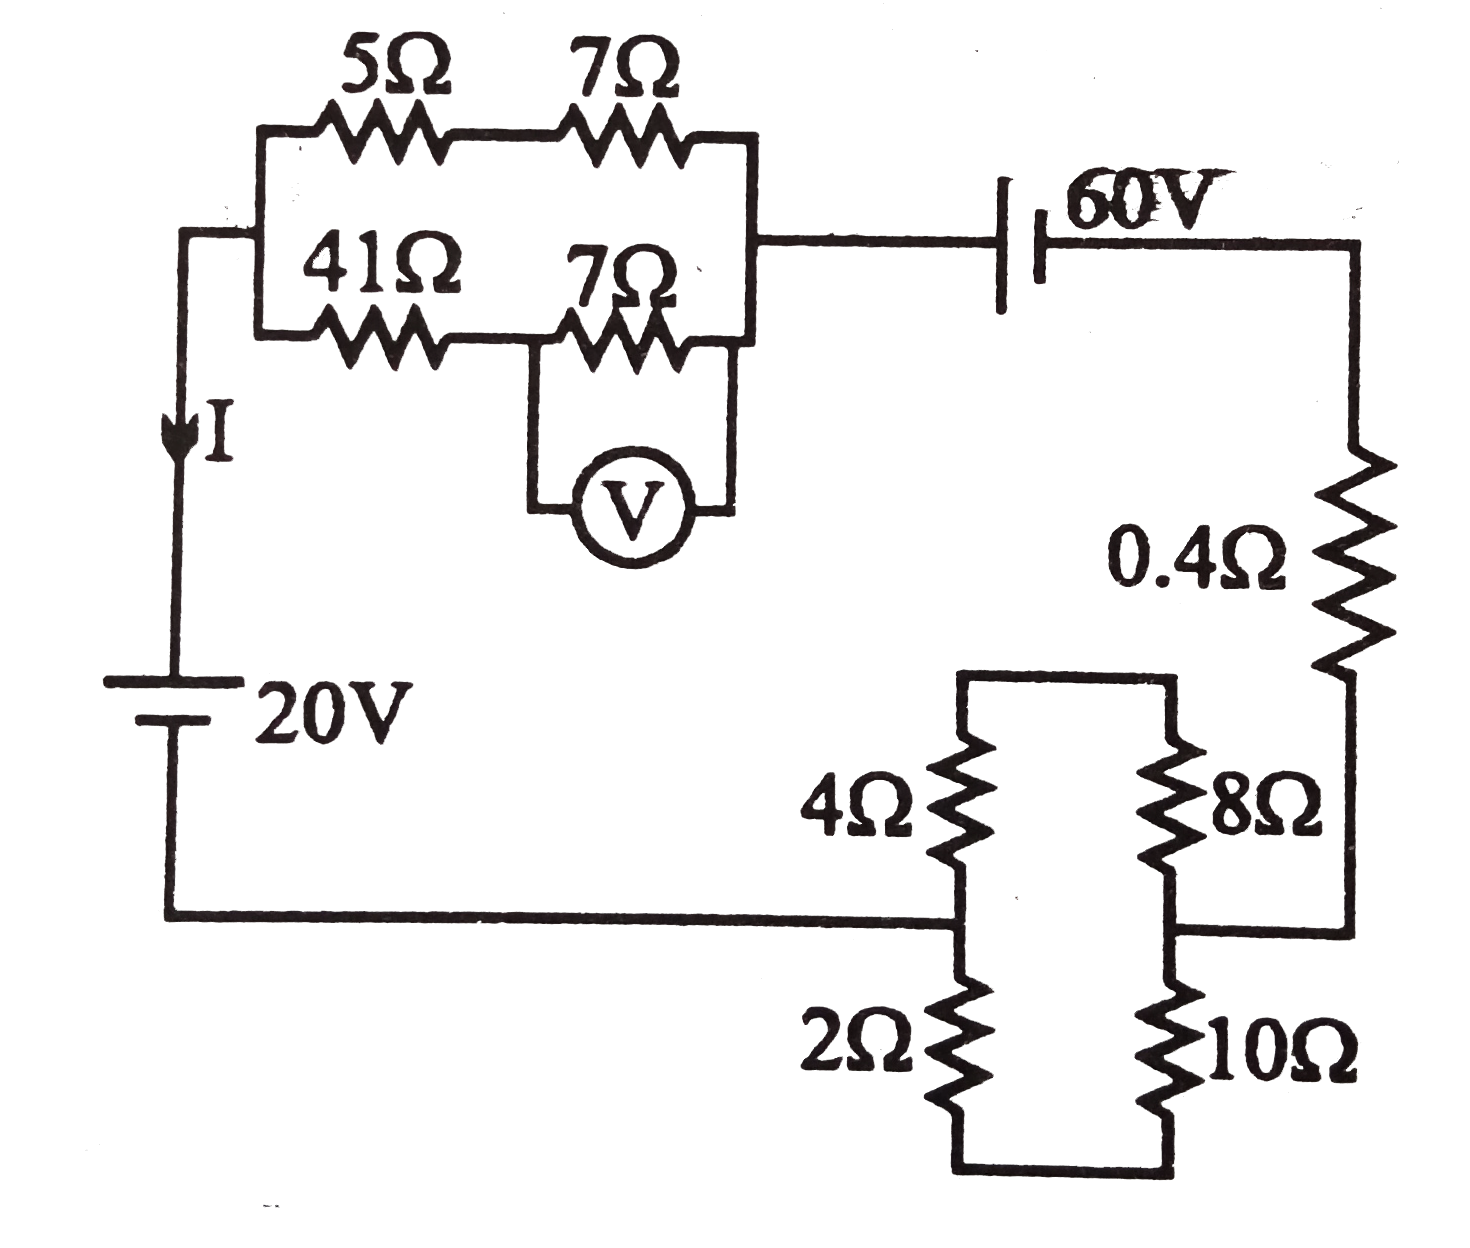
View SolutionGraph showing the variation of current versus voltage for a material GaAs is shown in figure. Identify the region of (i) negative resistance (ii) where Ohm's law is obeyed.
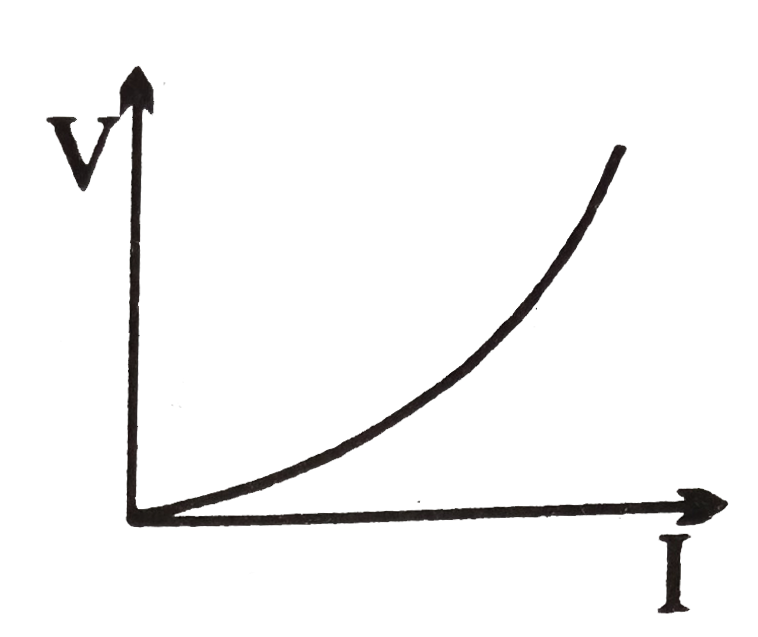
View SolutionThe variation of current (I) and voltage (V) is as shown in figure A. The variation of power P with current I is best shown by which of the following graph
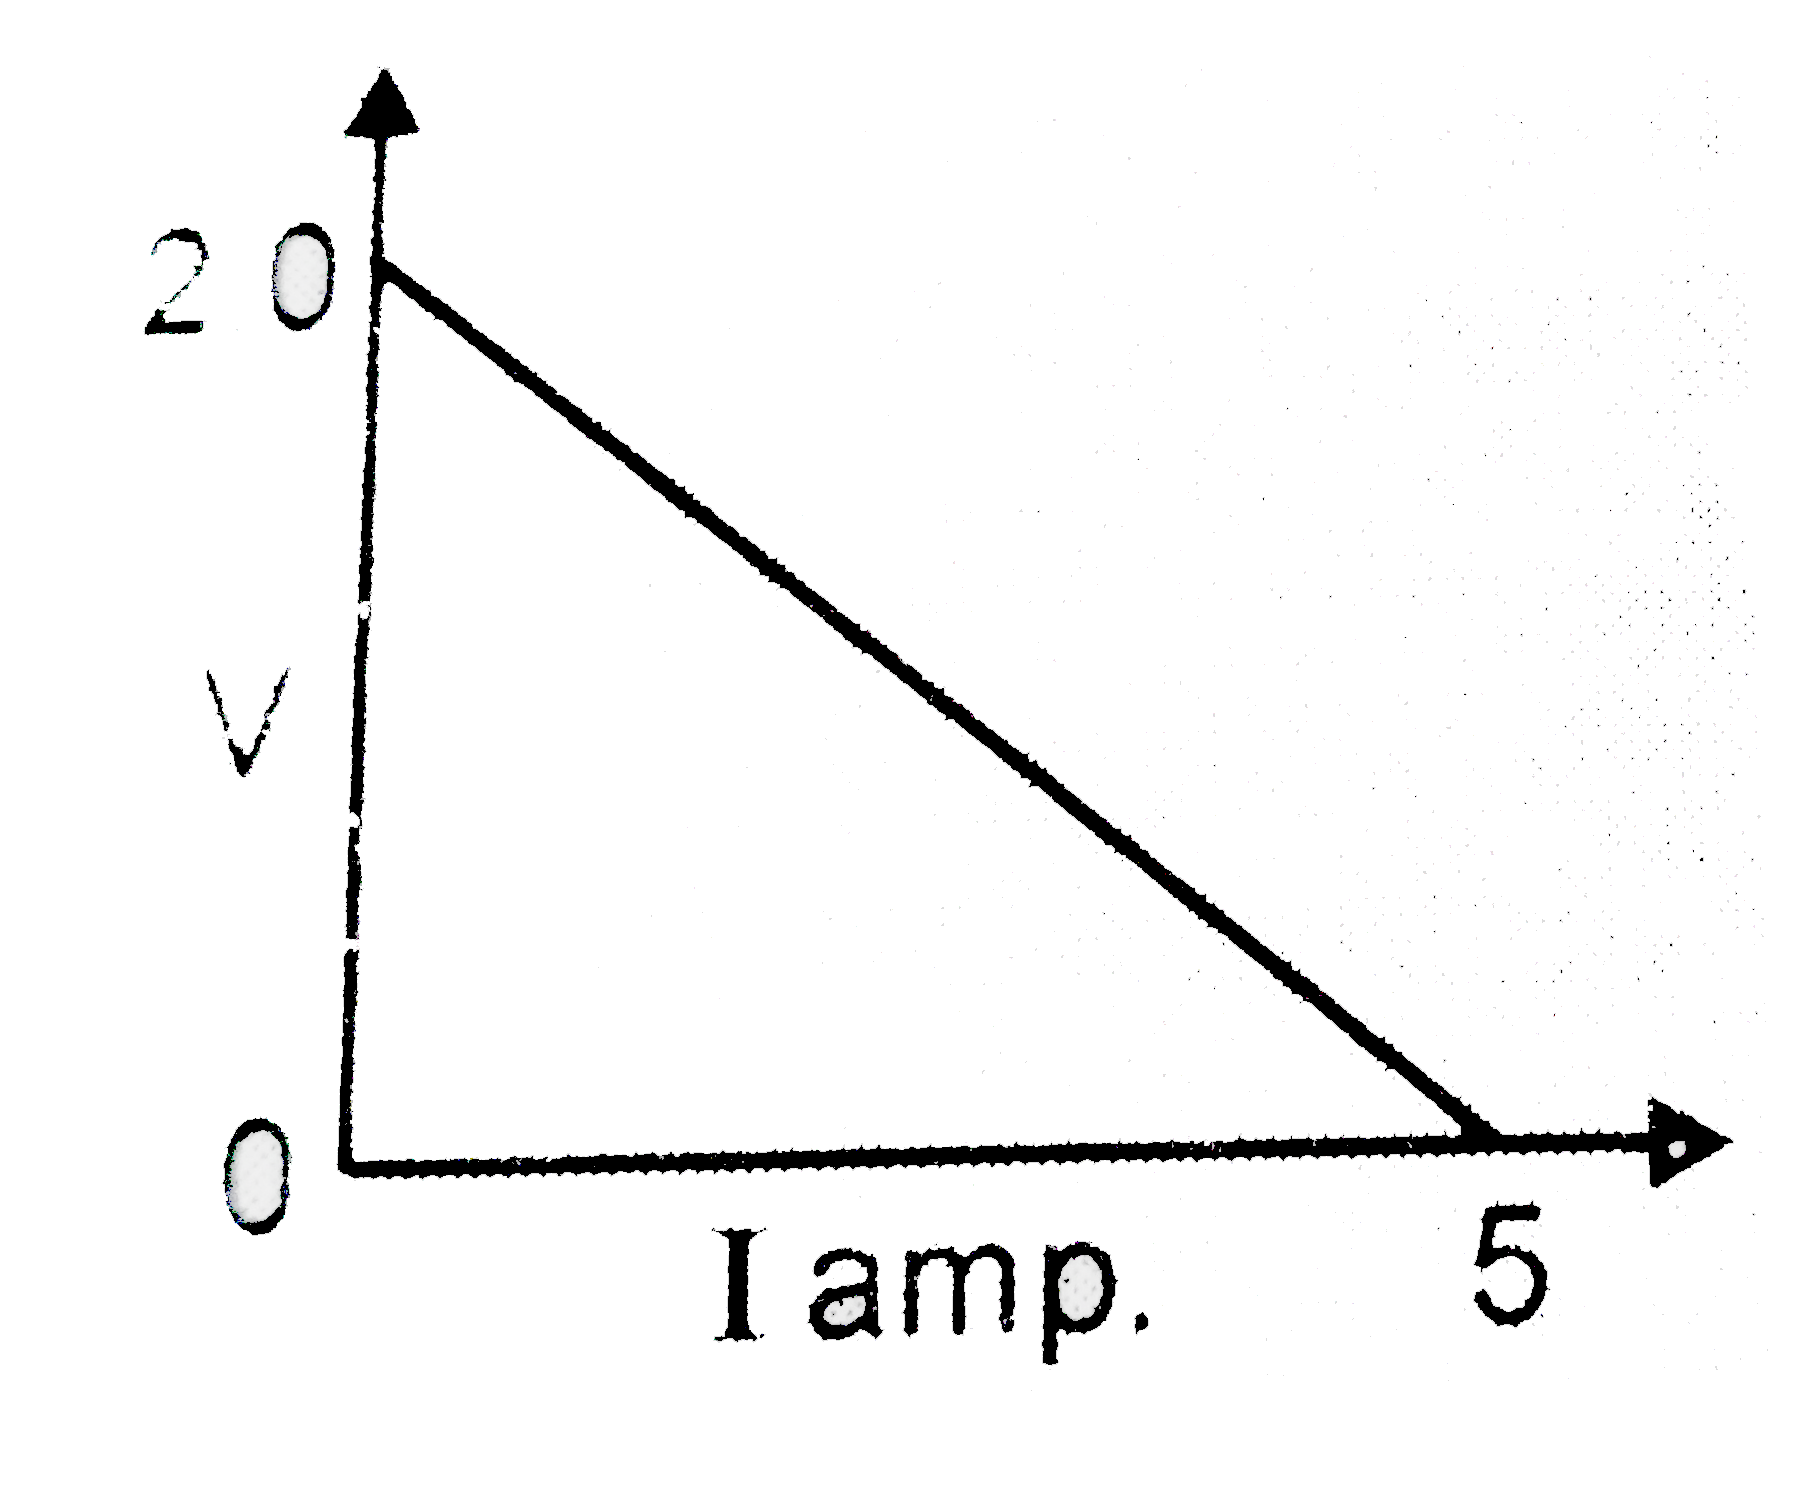
View SolutionFor a cell, the graph between the potential difference (V) across the terminals of the cells and the current I drawn from the cell is as shown in figure. Calculate the e.m.f. and the internal resistance of the cell.
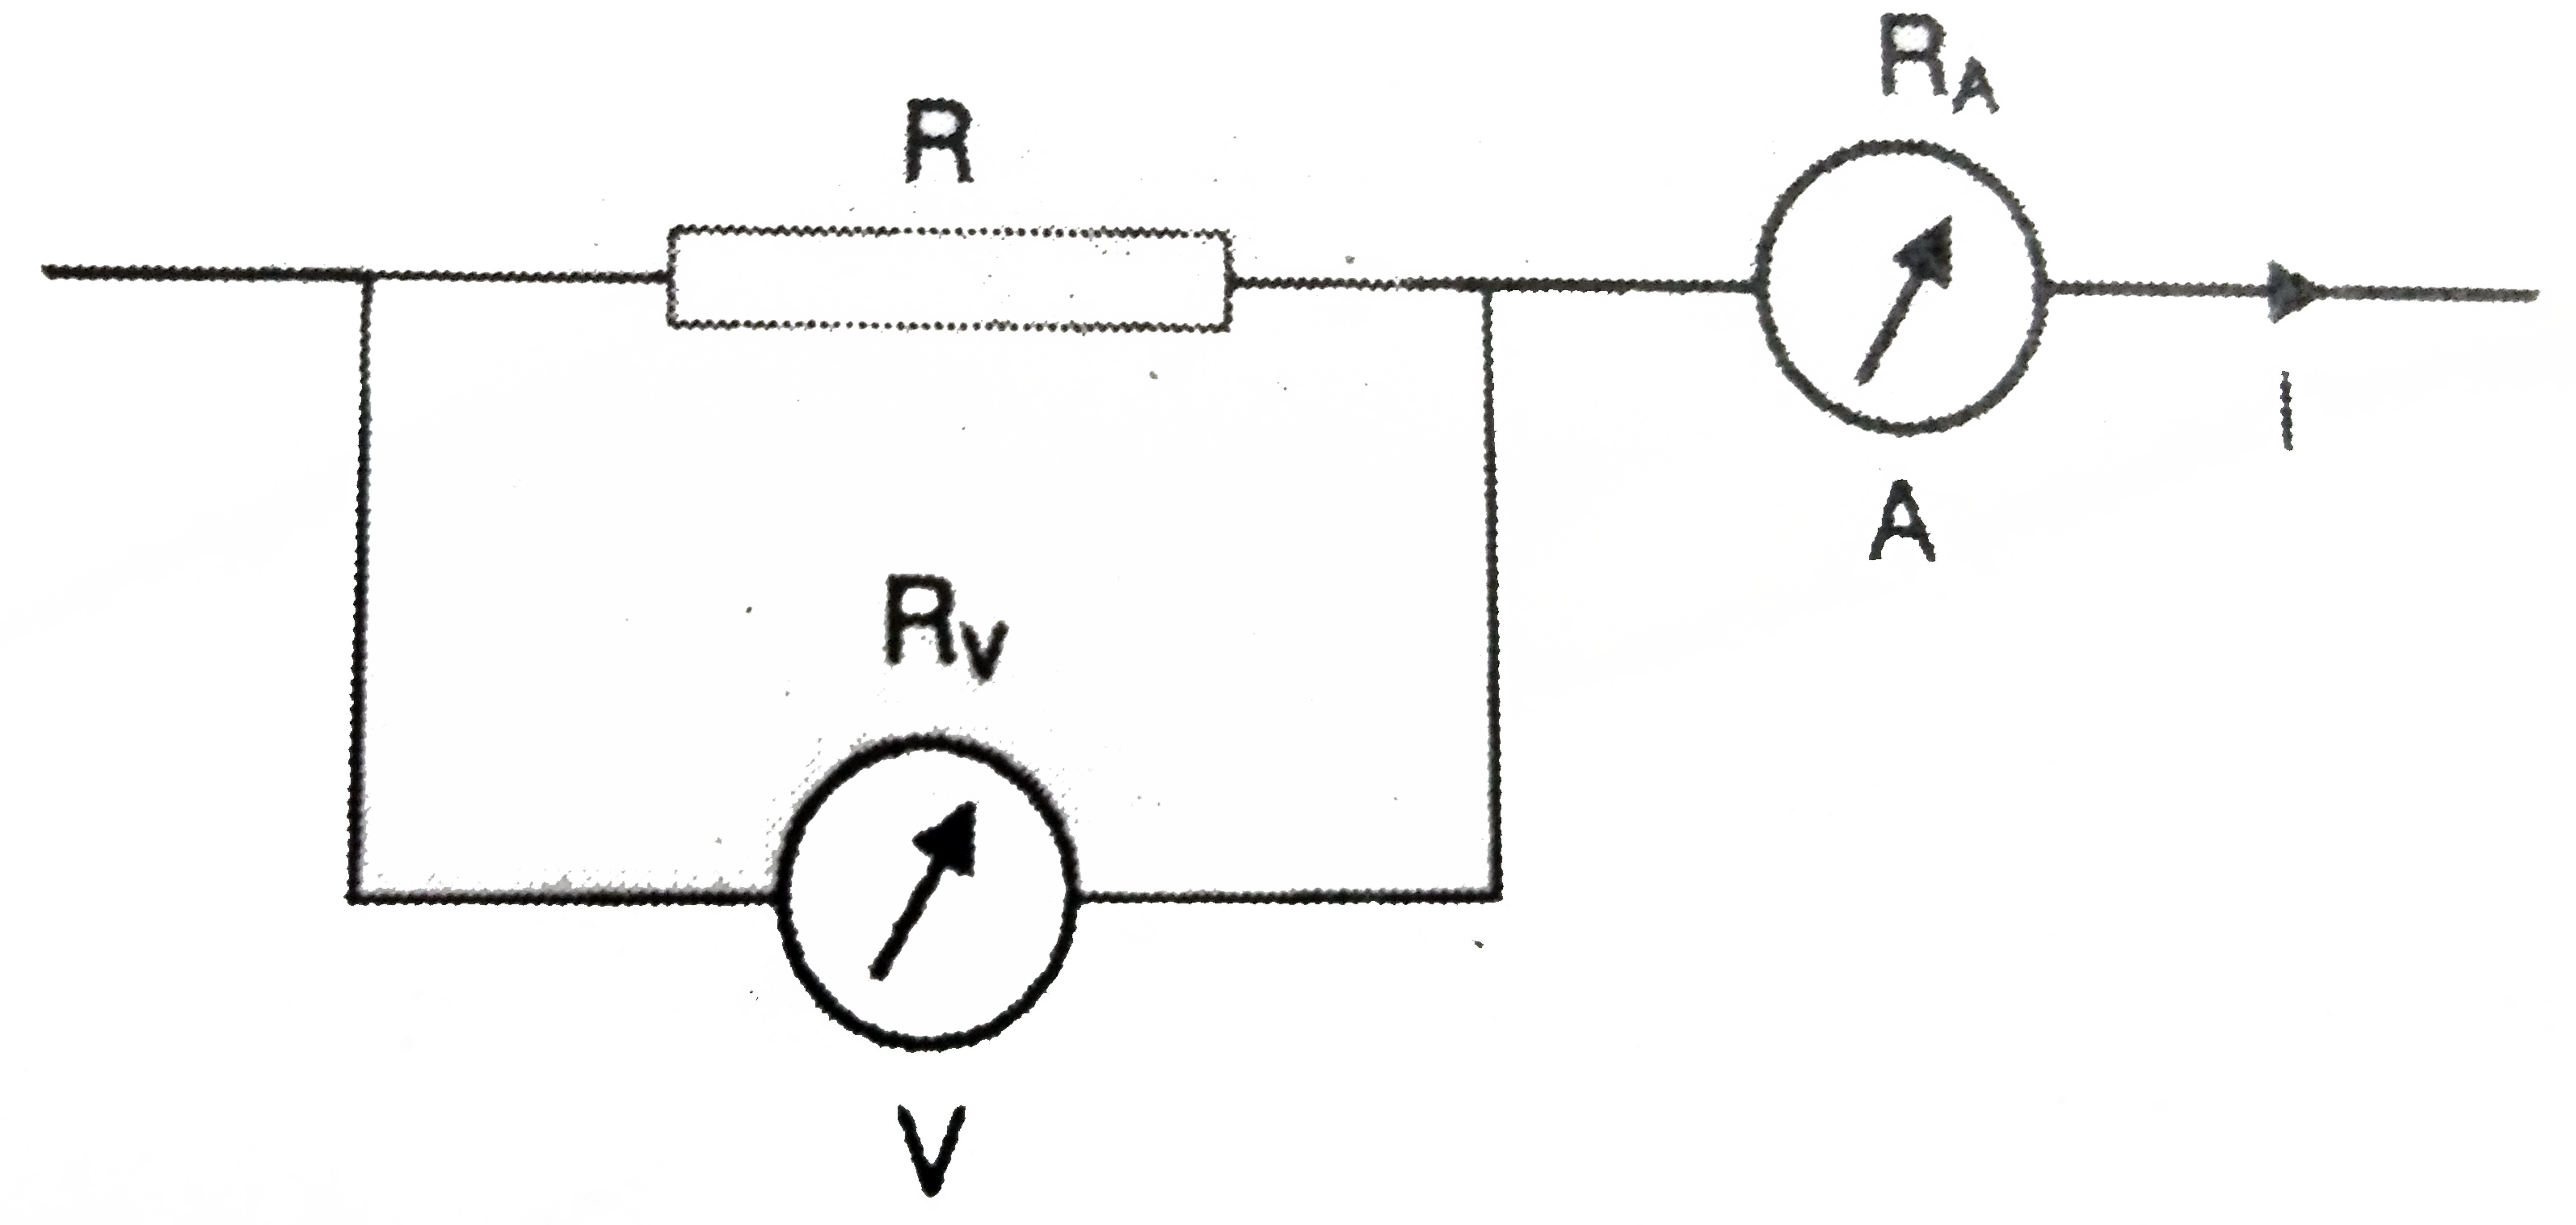
View SolutionLet V and I be the readings of the voltmeter and the ammeter respectively as shown in the figure. Let RV and RA be their corresponding resistancce Therefore,
View Solution

