The given bar graph shows the number of students studying their favourite language in various schools.
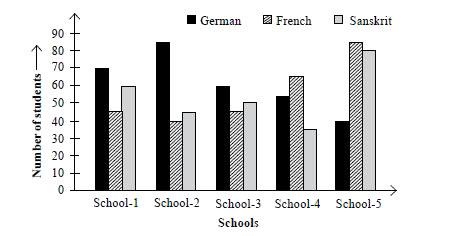
If 30% of the number of students studying Sanskrit in School-5 are males, then find the number of female students studying Sanskrit in School-5.
35
56
63
49
The correct Answer is:B
Step by step video, text & image solution for The given bar graph shows the number of students studying their favourite language in various schools. If 30% of the number of students studying Sanskrit in School-5 are males, then find the number of female students studying Sanskrit in School-5. by Maths experts to help you in doubts & scoring excellent marks in Class 9 exams.
Topper's Solved these Questions
- BOOK - SCIENCE OLYMPIAD FOUNDATION CHAPTER - IMO QUESTION PAPER SET A 2019EXERCISE - Everyday Mathematics10videos
IMO QUESTION PAPER SET A 2019
- BOOK - SCIENCE OLYMPIAD FOUNDATION CHAPTER - IMO QUESTION PAPER SET A 2019EXERCISE - Achievers Section5videos
IMO QUESTION PAPER SET A 2019
- BOOK - SCIENCE OLYMPIAD FOUNDATION CHAPTER - IMO QUESTION PAPER SET A 2017EXERCISE - ARCHIEVERS SECTION5videos
IMO QUESTION PAPER SET A 2017
- BOOK - SCIENCE OLYMPIAD FOUNDATION CHAPTER - IMO QUESTION PAPER SET B 2019EXERCISE - ACHIEVERS SECTION5videos
IMO QUESTION PAPER SET B 2019
Similar Questions
This table shows the number of students studying in various streams in different colleges. What is the ratio of the number of students studying science in colleges A and B together to the number of students studying commerce in colleges D and E together?
 View Solution
The following bar graph shows the number of students in a particular class of school. Then, answer the following questions.
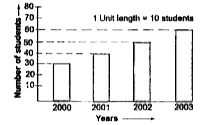
What is the number of students in the year 2003?View Solution
Knowledge Check
- Question 1 - Select One
The Pie-graph given here shows the number of students opting different subjects in a school. If there are a total of 720 students, then by studying the pie-graph answer the questions.
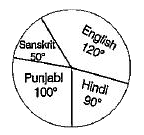
The difference in the number of students studying Hindi and Sanskrit subjects isA40B80C120D140 - Question 2 - Select One
The given bar graph presents the number of students two schools for six years.
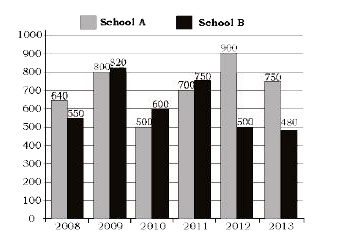
In which year, the absolute difference between the number of students in two schools is the highest?A2013B2010C2012D2011 - Question 3 - Select One
The following bar graph shows the number of students in a particular class of school. Then, answer the following questions.
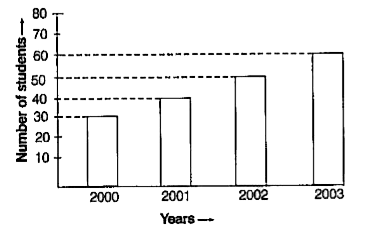
What is the number of students in the year 2003?A10B25C45D60
The given Venn diagram represent the number of students in a class who study three languages, French Spanish and Japanese.
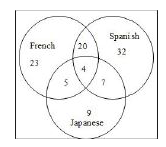
The number of students studying French, Spanish and Japanese is:View SolutionThe Pie-graph given here shows the number of students opting different subjects in a school. If there are a total of 720 students, then by studying the pie-graph answer the questions.
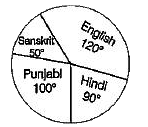
The total number of students studying English and Punjabi subjects areView SolutionThe given Bar graph presents the number of students of two schools for six years
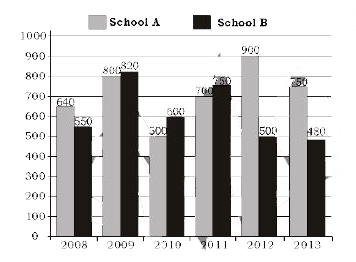
What is the average of the number of students from school A during the six year period?View SolutionThe following bar graph shows the number of students in a particular class of school. Then, answer the following questions.
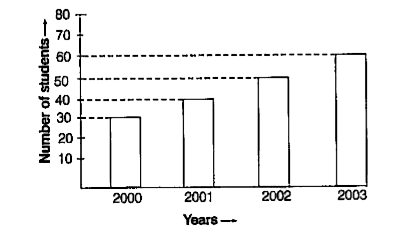
Is the number of students in the year 2002 is twice that in the year 2000?View SolutionStudy the following graph carefully to answer the questions.
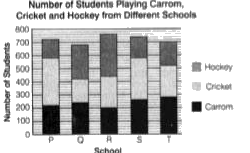
If the number of students playing each game in school S in increased by 15% and the number of students playing each game in school Q is decreased by 5% then what will be the difference between number of students in school S and Q?View Solution

