The given box diagram represents the ratio of females to males or the sex ratio in our country for 10 decades (1901 to 2001) .Answer the following questions in the light of your knowledge of sex determination and the data presented in the box diagram .

Suggest a way by which such a trend can be stopped .
Banning sex tests of unborn baby , increasing awareness and education .
Topper's Solved these Questions
- HEREDITY AND EVOLUTION BOOK - OSWAL PUBLICATIONCHAPTER - HEREDITY AND EVOLUTION EXERCISE - DIFFERENTIATE BETWEEN
2 Videos
- HEREDITY AND EVOLUTION BOOK - OSWAL PUBLICATIONCHAPTER - HEREDITY AND EVOLUTION EXERCISE - ANALYSIS AND EVALUATION BASED QUESTIONS
11 Videos
- HEREDITY AND EVOLUTION BOOK - OSWAL PUBLICATIONCHAPTER - HEREDITY AND EVOLUTION EXERCISE - SHORT ANSWER TYPE QUESTIONS
28 Videos
- HEREDITYBOOK - OSWAL PUBLICATIONCHAPTER - HEREDITYEXERCISE - BOARD CORNER (Long Answer Type Questions)
4 Videos
- HOW DO ORGANISMS REPRODUCE ?BOOK - OSWAL PUBLICATIONCHAPTER - HOW DO ORGANISMS REPRODUCE ?EXERCISE - CREATING BASED QUESTIONS
6 Videos
Similar Questions
What could be the possible reason for declining female-male sex ratio in our country? Suggest two measures to achieve 1:1 ratio.
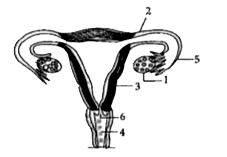
View SolutionThe diagram given belwo represents a system in the human body. Study the diagram and answer the following question:
Mention the surgical methods of contraception in
1. Human males
2. Human females.
View Solution
Knowledge Check
The following bar-diagram shows total number of males and females in five different organisations. Study it carefully to answer the questions.
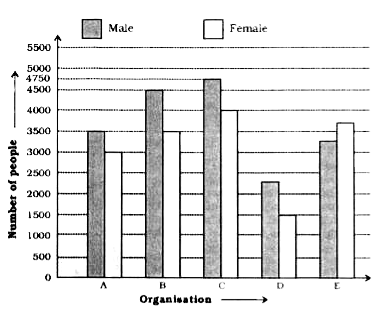
What is the ratio of the number of females from the organisations B and C to the number of males from the organisations D and E?A12:11B12:15C11:15D15:11The profit percent gained if an object is sold at Rs 464 is equals to the loss percent when the object is sold at Rs 436. Find the cost price of this object?
A250B400C450D500In the given pie-chart, the comaprative study of the production or Rice, Wheat, Sugar and Tea of a country is given. Study the pie-chart and answer the following questions.
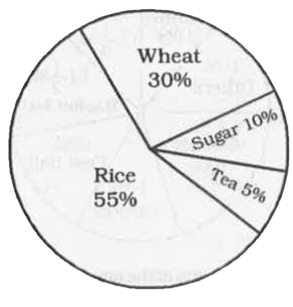
From this diagram, the ratio of sum of wheat and sugar production to difference in production of rice and tea isA4:5B5:4C6:1D1:6
The diagram given below represents a surgical sterilization method in males.
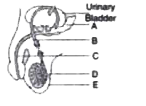
Study the same and answer the questions that follow: (i) Name the parts marked A, B, C, D and E.
(ii) Give the name of the surgical method represented in the diagram.
(iii) Which part is ligated or cut ?
(iv) Name the corresponding surgical method conducted on females.
(V) Name the part which is ligated in females and why?
View SolutionThe diagram given below represents a plant cell after being placed in a strong sugar solution . Study the diagram and answer the questions that follow:
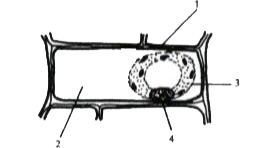
State any two features of the above plant cell which is not present in animal cells.
View SolutionThe diagram given below represents the human heart in one phase of its functional activities. Study the same and answer the questions that follow :
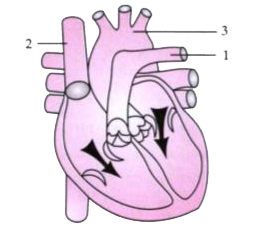
Which part of the heart is contracting in this phase ? Give a reason to support your answer
View SolutionStudy the following Venn-diagram and answer the given question.
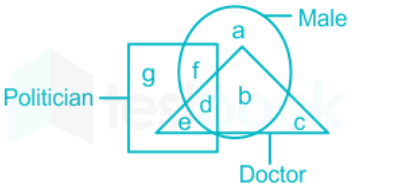
Which letter represents a male politician only?
View SolutionThe following bar-diagram shows total number of males and females in five different organisations. Study it carefully to answer the questions.
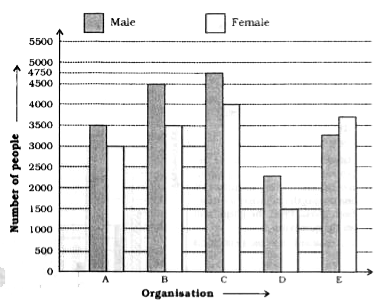
What is the ratio of average number of females from the organisations A, B and C to the average number of males from the organisations C, D and E?
View Solution
