The given box diagram represents the ratio of females to males or the sex ratio in our country for 10 decades (1901 to 2001) .Answer the following questions in the light of your knowledge of sex determination and the data presented in the box diagram .

Assign one reason to the trend showing deviation from the expected sex ratio .
Female foeticide
Topper's Solved these Questions
- HEREDITY AND EVOLUTION BOOK - OSWAL PUBLICATIONCHAPTER - HEREDITY AND EVOLUTION EXERCISE - DIFFERENTIATE BETWEEN
2 Videos
- HEREDITY AND EVOLUTION BOOK - OSWAL PUBLICATIONCHAPTER - HEREDITY AND EVOLUTION EXERCISE - ANALYSIS AND EVALUATION BASED QUESTIONS
11 Videos
- HEREDITY AND EVOLUTION BOOK - OSWAL PUBLICATIONCHAPTER - HEREDITY AND EVOLUTION EXERCISE - SHORT ANSWER TYPE QUESTIONS
28 Videos
- HEREDITYBOOK - OSWAL PUBLICATIONCHAPTER - HEREDITYEXERCISE - BOARD CORNER (Long Answer Type Questions)
4 Videos
- HOW DO ORGANISMS REPRODUCE ?BOOK - OSWAL PUBLICATIONCHAPTER - HOW DO ORGANISMS REPRODUCE ?EXERCISE - CREATING BASED QUESTIONS
6 Videos
Similar Questions
What could be the possible reason for declining female-male sex ratio in our country? Suggest two measures to achieve 1:1 ratio.
View SolutionThe diagram given below is that of a developing human foetus. Study the diagram and then answer the questions that follow :
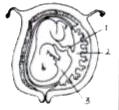
(i) Label the parts numbered 1 to 3 in the diagram.
(ii) Mention any two functions of the part labelled 2 in the diagram.
(iii) Explain the significance of the part numbered 3 in the diagram.
(iv) Define the term 'Gestation'. What is the normal gestational period of the developing human embryo?
(v) Mention the sex chromosomes in a male and female embryo.
View Solution
Knowledge Check
The following bar-diagram shows total number of males and females in five different organisations. Study it carefully to answer the questions.
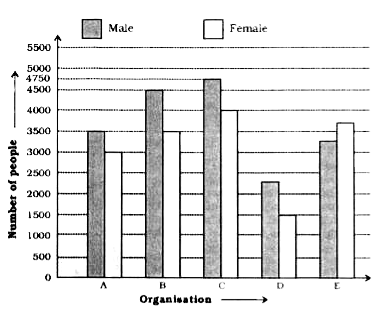
What is the ratio of the number of females from the organisations B and C to the number of males from the organisations D and E?A12:11B12:15C11:15D15:11The following bar-diagram shows total number of males and females in five different organisations. Study it carefully to answer the questions.
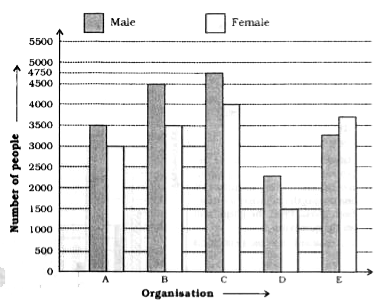
What is the ratio of average number of females from the organisations A, B and C to the average number of males from the organisations C, D and E?A42:41B41:42C40:41D41:40In the given pie-chart, the comaprative study of the production or Rice, Wheat, Sugar and Tea of a country is given. Study the pie-chart and answer the following questions.
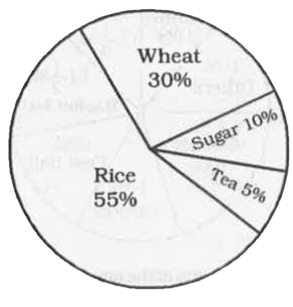
From this diagram, the ratio of sum of wheat and sugar production to difference in production of rice and tea isA4:5B5:4C6:1D1:6
In a certain village the sex ratio is very low due to large number of cases of female infanticide. A man from the same village takes his pregnant wife to the doctor to find out whether the foetus is a girl or a boy. The doctor performs a test and tells them that it is a girl.
Answer the following questions based on the above situation:
(i) Name the technique used by doctor to determine the type of sex of the foetus.
(ii) Which values are disrespected by the doctor in the above situation?
(iii) Suggest two actions to be taken by the administration/society to promote desired related values.
View SolutionIn a certain village the sex ratio is very low due to large number of cases of female infanticide. A man from the same village takes his pregnant wife to the doctor to find out whether the foetus is a girl or a boy. The doctor performs a test and tells them that it is a girl.
Answer the following questions based on the above situation:
(i) Name the technique used by doctor to determine the type of sex of the foetus.
(ii) Which values are disrespected by the doctor in the above situation?
(iii) Suggest two actions to be taken by the administration/society to promote desired related values.
View SolutionThe following pie-chart and table show the percentage distribution of farmers in 5 states A, B, C, D & E of a country who claimed insurance due to drought in the year 2017 and ratio of males to females of the number of farmers in states, respectively. Study the pie-chart and the table carefully and answer the following questions.
Note: Some data are missing in the pie-chart and table, if required in any question, find the missing data first and then answer the question.
Total number of farmers who claimed insurance in the year 2017 = 2,64,000
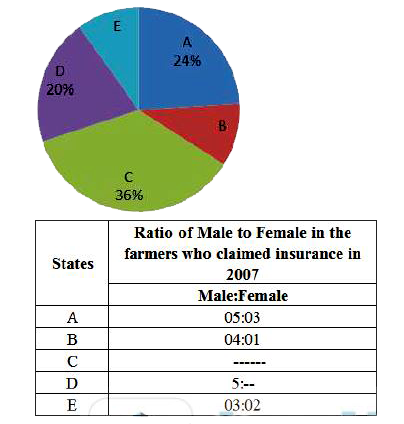
The number of farmers who claimed insurance in state C exceeds the total number of farmers (who claimed insurance)in state E and state A together by 5280. What is the percentage of farmers who claimed insurance in state E?
View SolutionStudents from different countries (A,B,C,D,E,F) participated in a certain seminar.The pie- chart shows how many students came from each of the six participating countries.Study the diagram and answer the following questions.
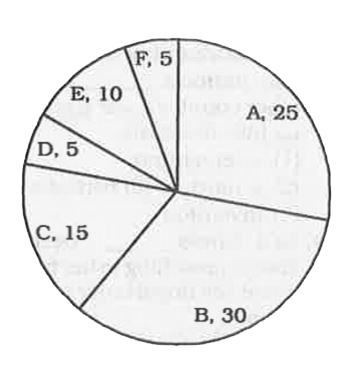
If the cost of total spending on transport for the seminar was Rs. 9 lakhs and the cost of hosting the students was Rs. 15000 per student then what was the ratio of hosting cost of all the students to that of spending on transport?
View SolutionBar diagram showing the effect of literacy drive within both sexes in 5 units study the bar diagram and answer the questions.
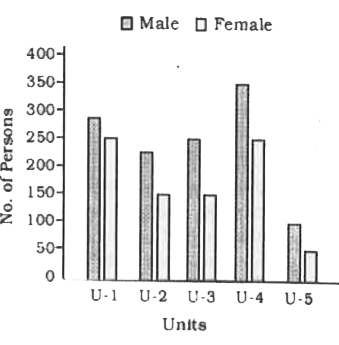
The ratio of difference between male & female in U - 4 and U - 3 is
View Solution
