The given box diagram represents the ratio of females to males or the sex ratio in our country for 10 decades (1901 to 2001) .Answer the following questions in the light of your knowledge of sex determination and the data presented in the box diagram .

What does the bar diagram show ?
Text Solution
Bar diagram shows the production of females in the population over a decade .
|
Topper's Solved these Questions
- HEREDITY AND EVOLUTION BOOK - OSWAL PUBLICATIONCHAPTER - HEREDITY AND EVOLUTION EXERCISE - DIFFERENTIATE BETWEEN
2 Videos
- HEREDITY AND EVOLUTION BOOK - OSWAL PUBLICATIONCHAPTER - HEREDITY AND EVOLUTION EXERCISE - ANALYSIS AND EVALUATION BASED QUESTIONS
11 Videos
- HEREDITY AND EVOLUTION BOOK - OSWAL PUBLICATIONCHAPTER - HEREDITY AND EVOLUTION EXERCISE - SHORT ANSWER TYPE QUESTIONS
28 Videos
- HEREDITYBOOK - OSWAL PUBLICATIONCHAPTER - HEREDITYEXERCISE - BOARD CORNER (Long Answer Type Questions)
4 Videos
- HOW DO ORGANISMS REPRODUCE ?BOOK - OSWAL PUBLICATIONCHAPTER - HOW DO ORGANISMS REPRODUCE ?EXERCISE - CREATING BASED QUESTIONS
6 Videos
Similar Questions
Knowledge Check
Observe the following diagram and answer any four questions below:
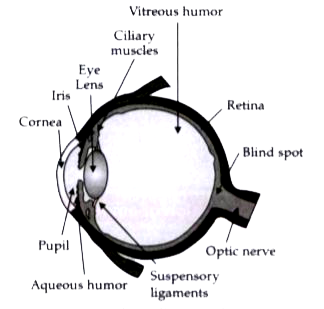
What does the given diagram show?AStructure of human eyeBStructure of human earCStructure of human brainDStructure of human lungsThe bar graph shows the number of soldiers in the armies of different countries. Study the diagram and answer the following questions.
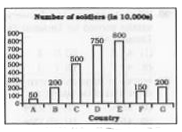
What is the ratio of number of soldiers of country B to that of country D?A15:4B8:15C15:8D4:15The bar graph shows the number of soldiers in the armies of different countries. Study the diagram and answer the following questions.
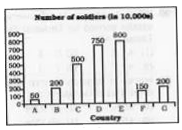
Which country has the least number of soldiers?AABDCFDB
Study the diagram given below and answer the questions that follow :
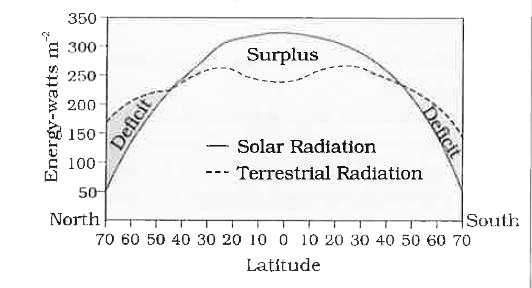
What does the diagram show?
View SolutionBased on the below diagram, answer the following question.
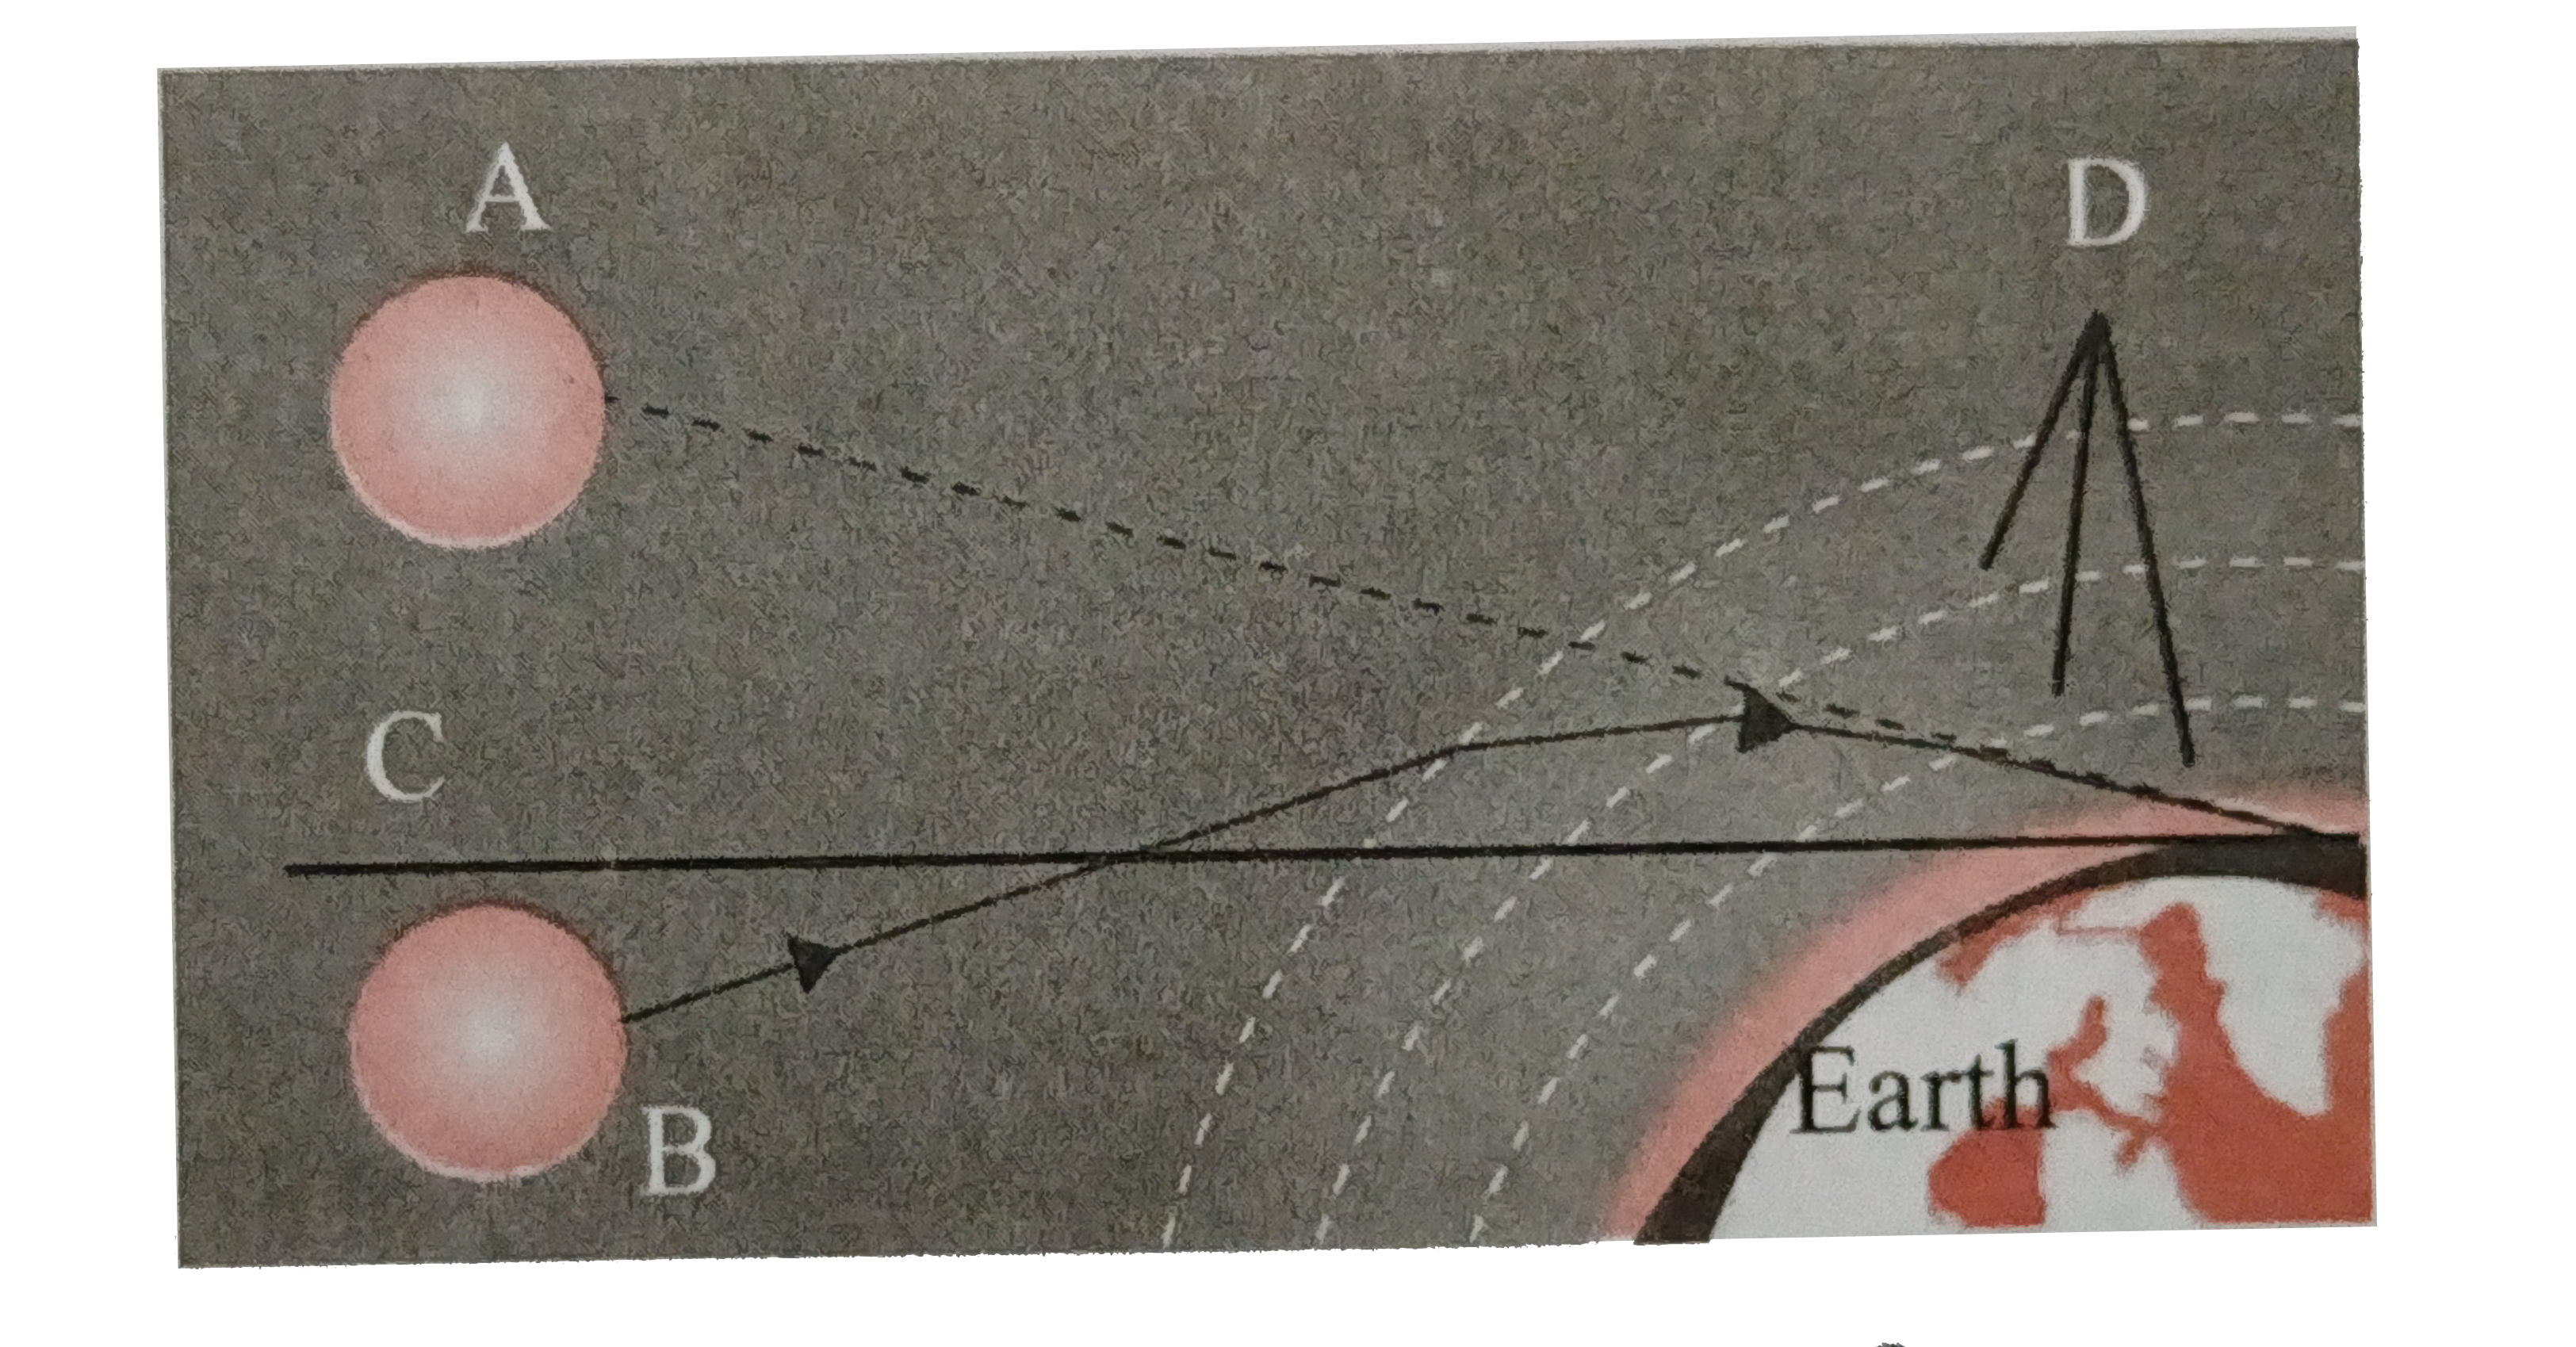
What does the above diagram represent?
View SolutionThe bar diagram below shows the production of potatoes (in quintals) form the year 2001 to 2006. Study the diagram and answer the following questions.
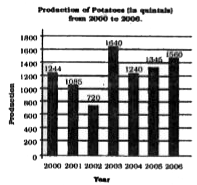
During this period, the highest rate of decline in production is :
View SolutionStudy the diagram given below and answer the questions that follow :
What does the diagram depict?
View SolutionThe bar graph shows the number of soldiers in the armies of different countries. Study the diagram and answer the following questions.

Which country has the least number of soldiers?
View Solution

