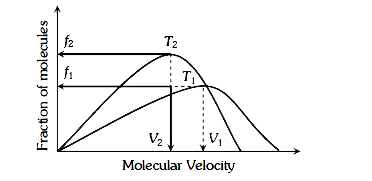
Plot of Maxwell’s distribution of velocities is given below

T1>T2
T1<Y2
V1<V2
f1>f2
The correct Answer is:A
From the given graph it can be seen that
V1>V2andf2>f1
As the temperature increases, the distribution curve becomes broader.
Thus T1>T2
Topper's Solved these Questions
- STATES OF MATTER BOOK - ERRORLESSCHAPTER - STATES OF MATTER EXERCISE - NCERT BASED QUESTIONS (REAL GASES AND VAN DER WAALS EQUATION)
21 Videos
- STATES OF MATTER BOOK - ERRORLESSCHAPTER - STATES OF MATTER EXERCISE - NCERT BASED QUESTIONS (CRITICAL STATE AND LIQUEFACTION OF GASES)
16 Videos
- STATES OF MATTER BOOK - ERRORLESSCHAPTER - STATES OF MATTER EXERCISE - NCERT BASED QUESTIONS (KINETIC MOLECULAR THEORY OF GASES AND MOLECULAR COLLISIONS)
12 Videos
- SOME BASIC CONCEPTS OF CHEMISTRYBOOK - ERRORLESSCHAPTER - SOME BASIC CONCEPTS OF CHEMISTRYEXERCISE - ASSERTION & REASON
10 Videos
- STRUCTURE OF ATOMBOOK - ERRORLESSCHAPTER - STRUCTURE OF ATOMEXERCISE - Assertion & Reason
16 Videos
Similar Questions
Maxwell Distribution Curves
View SolutionMaking use of the Maxwell distribution function, find <<1/v>>, the mean value of the reciprocal of the velocity of molecules in an ideal at a temperature T, it the mass of eacd molecule is equal to m. Compare the value obtained with the reciprocal of the mean velocity.
View Solution
Knowledge Check
Maxwell distribution is true when
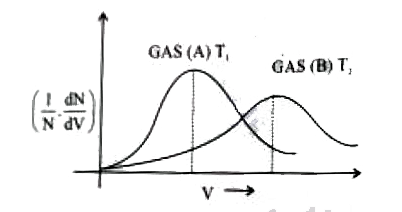
Asystem contain single objectBsystem contains two objectsCsystem is emptyDsystem contains large number of objectsAccording to Maxwell.s distribution of molecular speeds, for the below graph drawn for two different samples of gases A and B al temperature T1 and T2 respectively, which of the following statements in are incorrect?
 AIf T1=T2 then molecular mass of gas B(MB) is greater than molecular mass of gas A(MA).BIf molecular mass of gas A(MA)is equal to molecular mass of gas B(MB) then T1>T2CIf T1>T2, then molecular mass of gas B(MB) is necessarily less than molecular mass of gas A(MA)DAll of these
According to Maxwell.s distribution of molecular speeds, for the below graph drawn for two different samples of gases A and B al temperature T1 and T2 respectively, which of the following statements in are incorrect?
 AIf T1=T2 then molecular mass of gas B(MB) is greater than molecular mass of gas A(MA).BIf molecular mass of gas A(MA)is equal to molecular mass of gas B(MB) then T1>T2CIf T1>T2, then molecular mass of gas B(MB) is necessarily less than molecular mass of gas A(MA)DAll of these
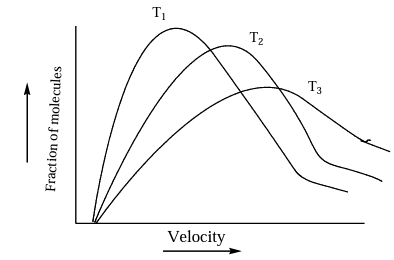
In the following graph of Maxwell - Boltzmann distribution of molecular velocities . Which of the following is the correct order of temperature ?

View SolutionFrom the Maxwell distribution function frind <<v2x>>, the mean value of the squared vx projection of the molecular velocity in a gas at a temperature T. The mass of each molecule is equal to m.
View SolutionUsing the Maxwell distribution function, calculate the mean velocity projection (vx) and the mean value of the modules of this projection <<|vx|>> if the mass of each molecule is equal to m and the gas temperature is T.
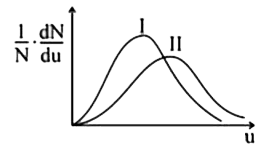
View SolutionFollowing curves are plotted according to Maxwell distribution of molecular speed.

View SolutionThe distribution of the molecular velocities of gas molecules at any temperature T is shown below. (The plot below is known as Maxwell's distribution of molecular speeds.)

where
v is molecular velocity
n is number of molecules having velocity v
Let us define ΔNv, which is equal to the number of molecules between the velocity range v and v+Δv, given by
ΔNv=4πNa3e−bv2v2Δv
where
N is total number of molecules
a=√M02πRT and b=M02RT
R is universal gas constant
T is temperature of the gas
M0 is molecular weight of the gas
Answer the following question:
If PPc=Pr, TTc=Tr, and VmVm,c=Vr where
View Solution