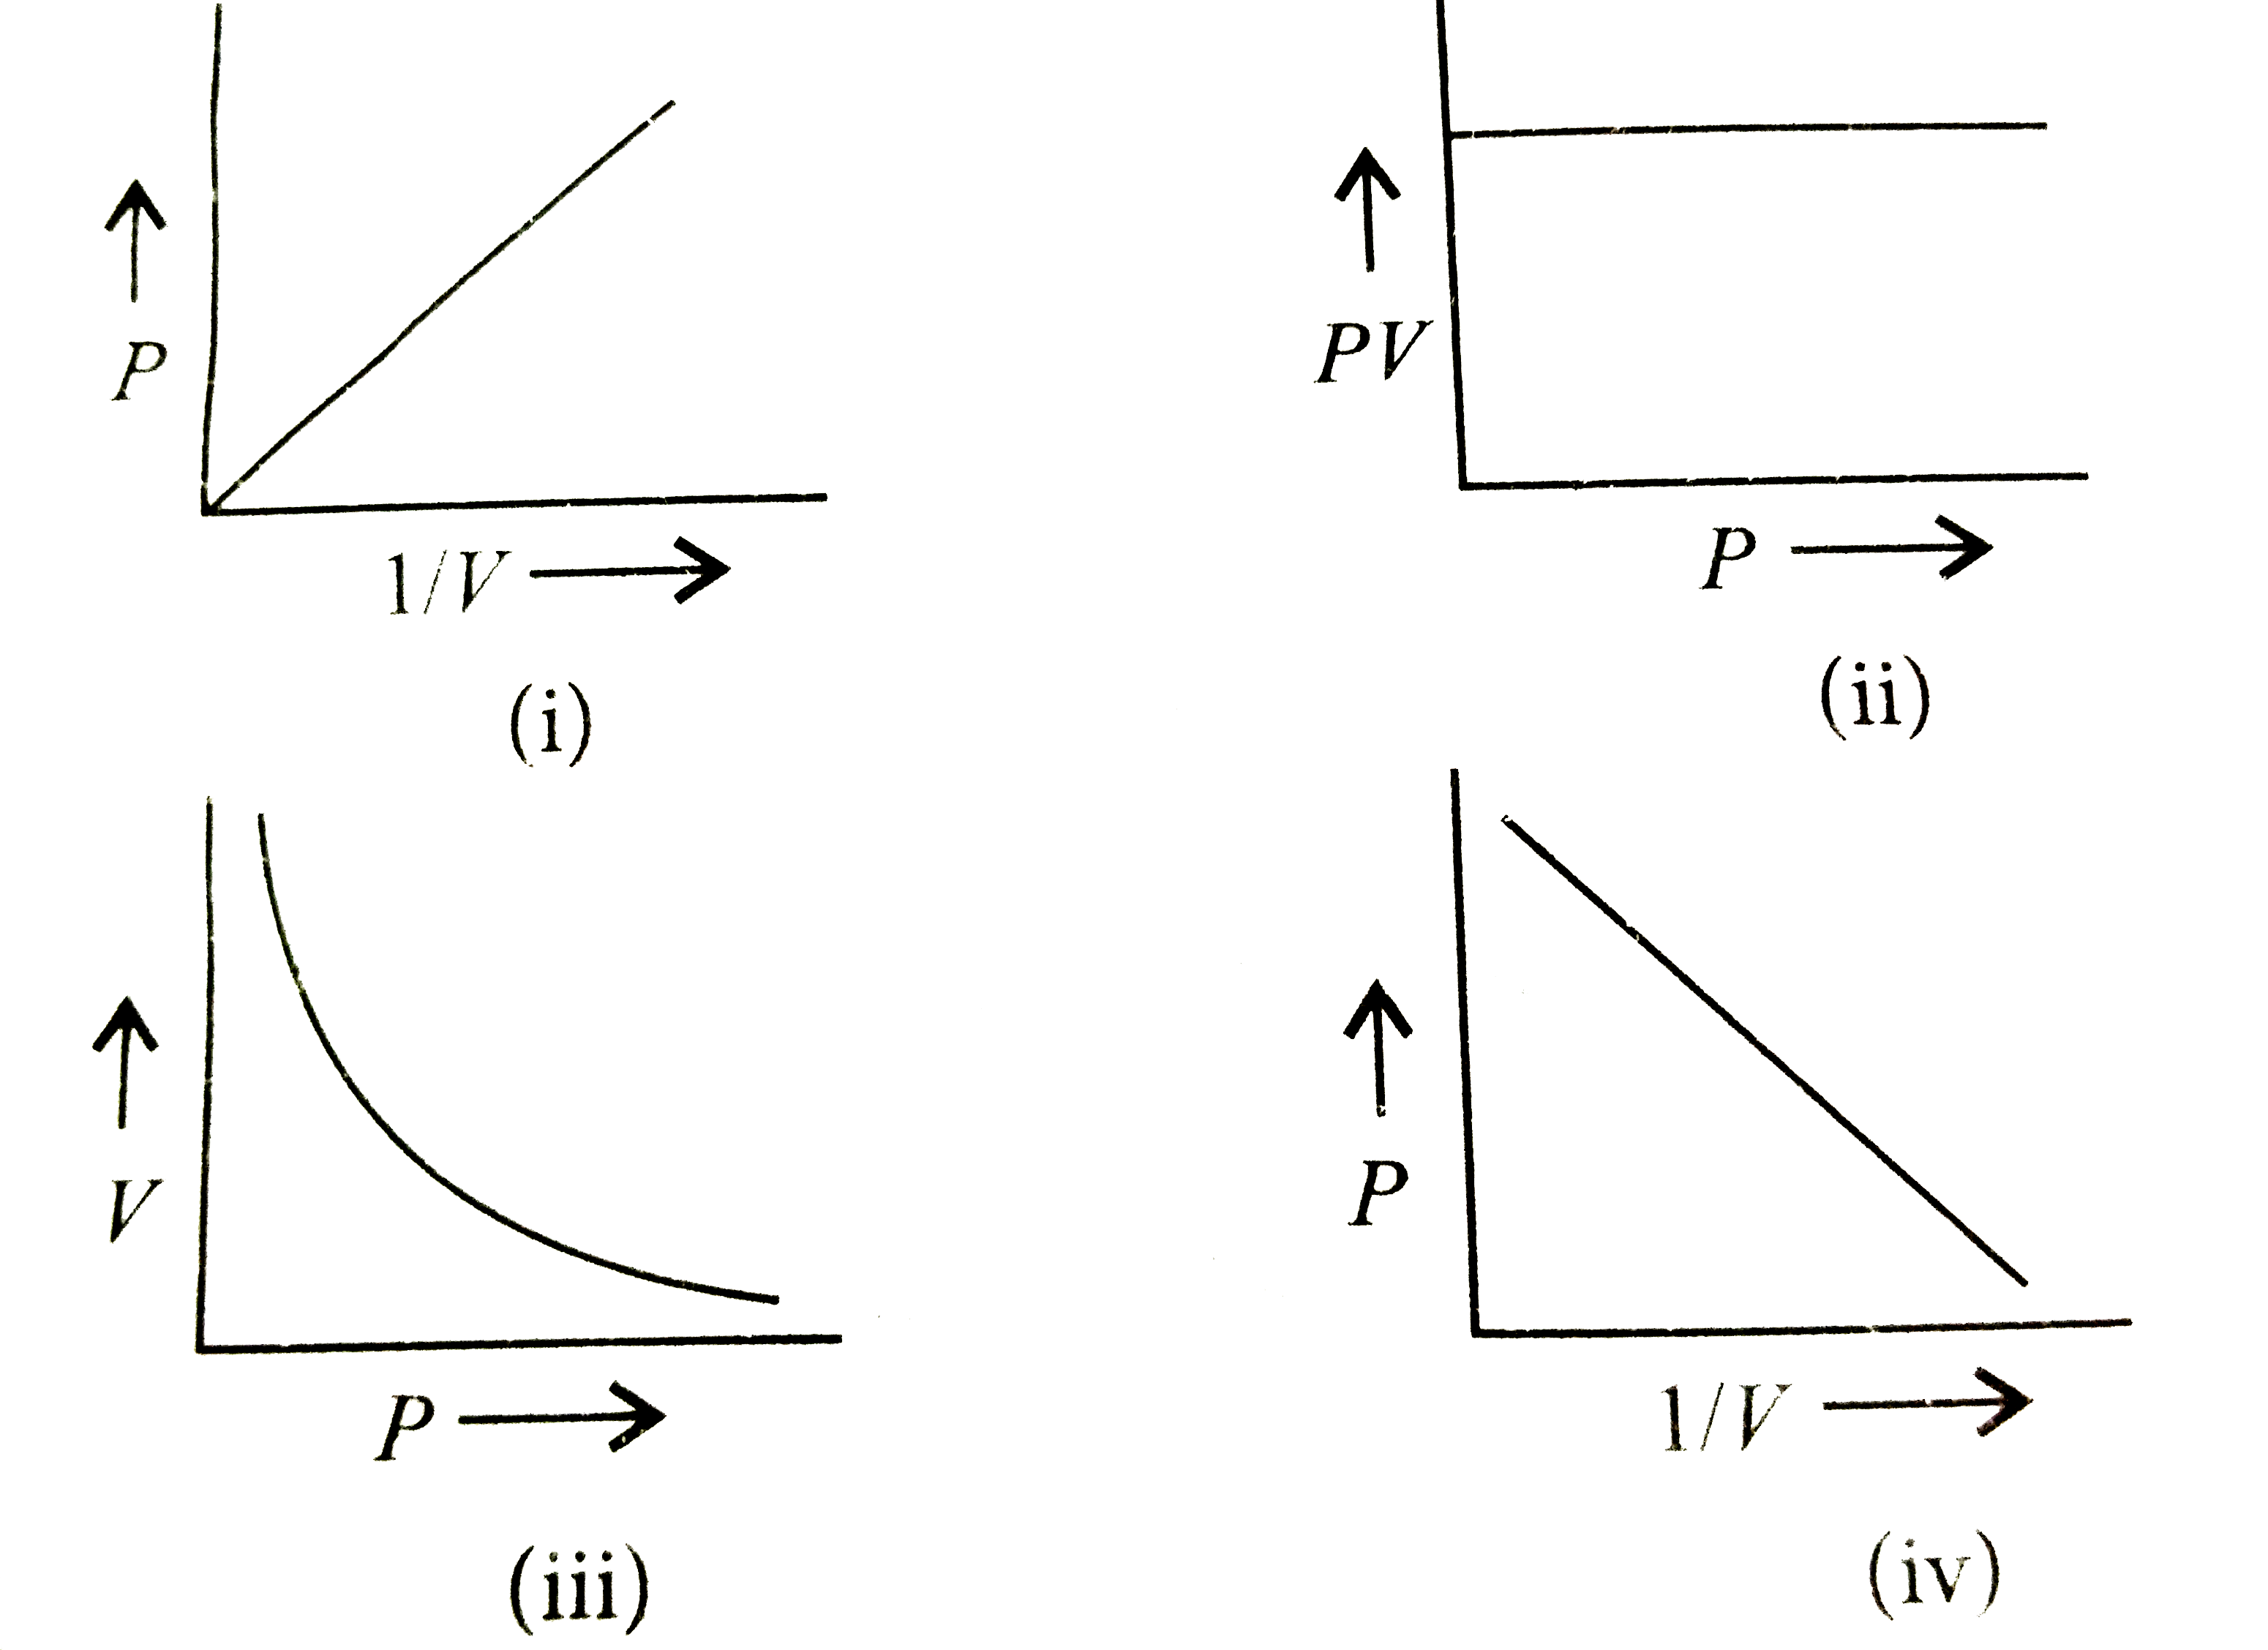
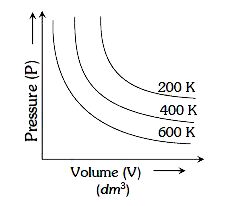
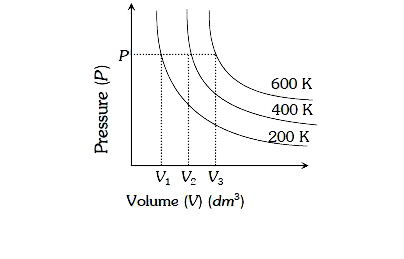
Choose the correct option for graphical representation of Boyle's Law, which shows a graph of pressure vs volume of gas at different temperatures:
A
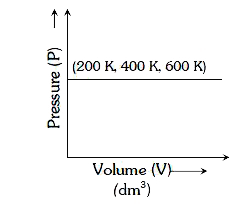
B
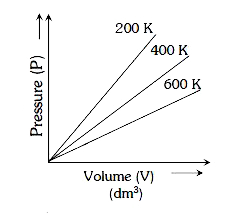
C
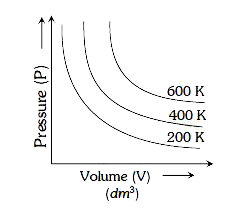
D
Video Solution
Text Solution
The correct Answer is:C
According to Boyle.s law
P∝1V
at a given pressure,
V∝T
|
Updated on:21/07/2023
Topper's Solved these Questions
- BOOK - ERRORLESSCHAPTER - STATES OF MATTER EXERCISE - ASSERTION AND REASON11videos
STATES OF MATTER
- BOOK - ERRORLESSCHAPTER - STATES OF MATTER EXERCISE - NCERT BASED QUESTIONS (VISCOSITY & SURFACE TENSION)11videos
STATES OF MATTER
- BOOK - ERRORLESSCHAPTER - SOME BASIC CONCEPTS OF CHEMISTRYEXERCISE - ASSERTION & REASON10videos
SOME BASIC CONCEPTS OF CHEMISTRY
- BOOK - ERRORLESSCHAPTER - STRUCTURE OF ATOMEXERCISE - Assertion & Reason16videos
STRUCTURE OF ATOM
Similar Questions
Knowledge Check
- Question 1 - Select One
Shows graphs of pressure vs density for an ideal gas at two temperaturesT1andT2
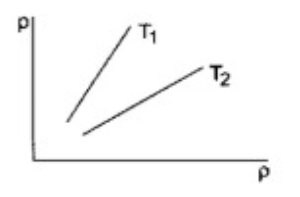 A(a)T1>T2B(b)T1=T2C(c)T1<T2D(d)Any of the three is possibe.
 - Question 2 - Select One
Which of the following graph represents Boyle's law ?
A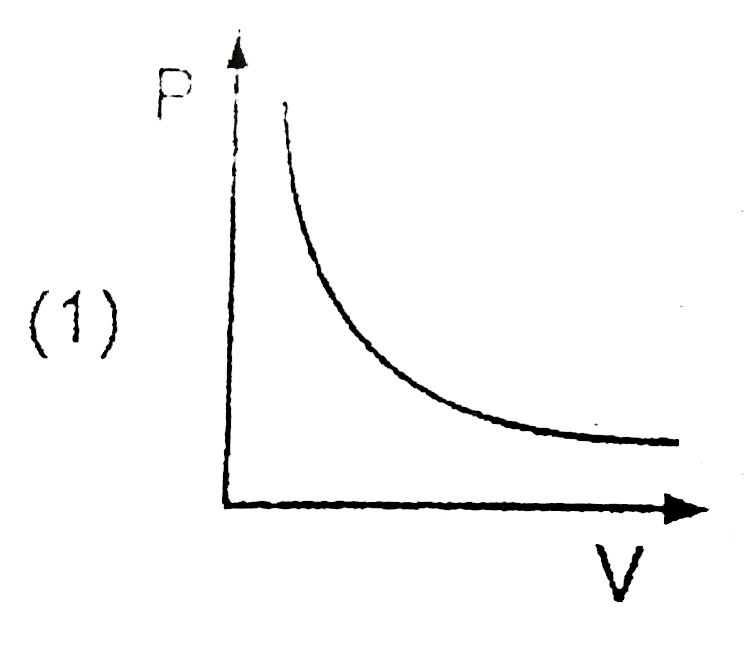 B
B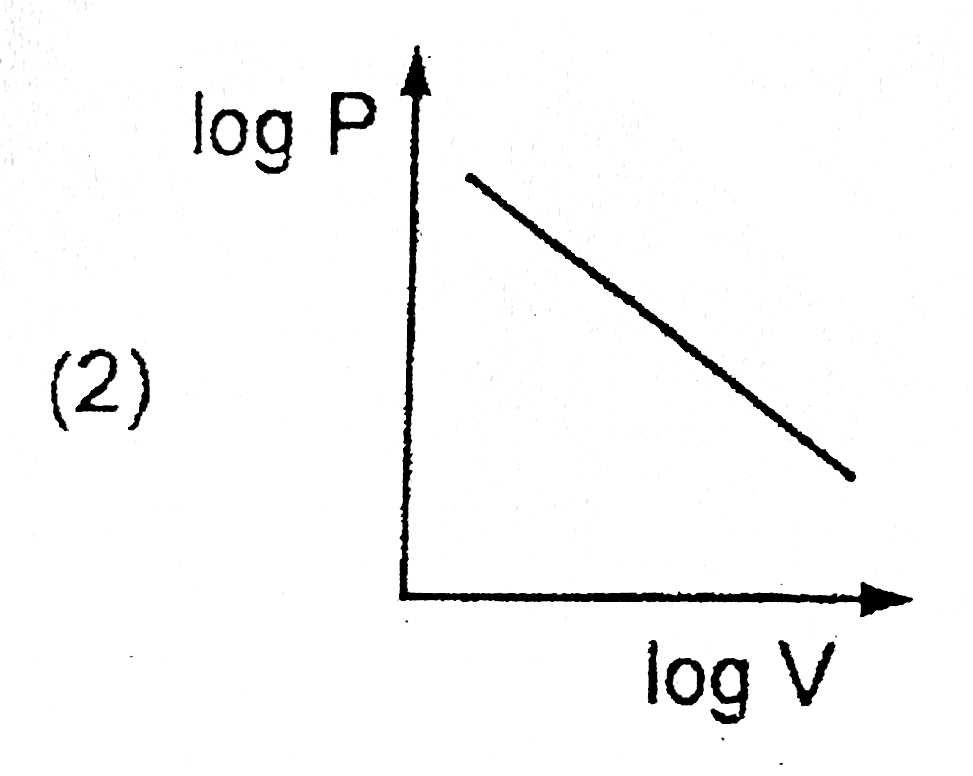 C
C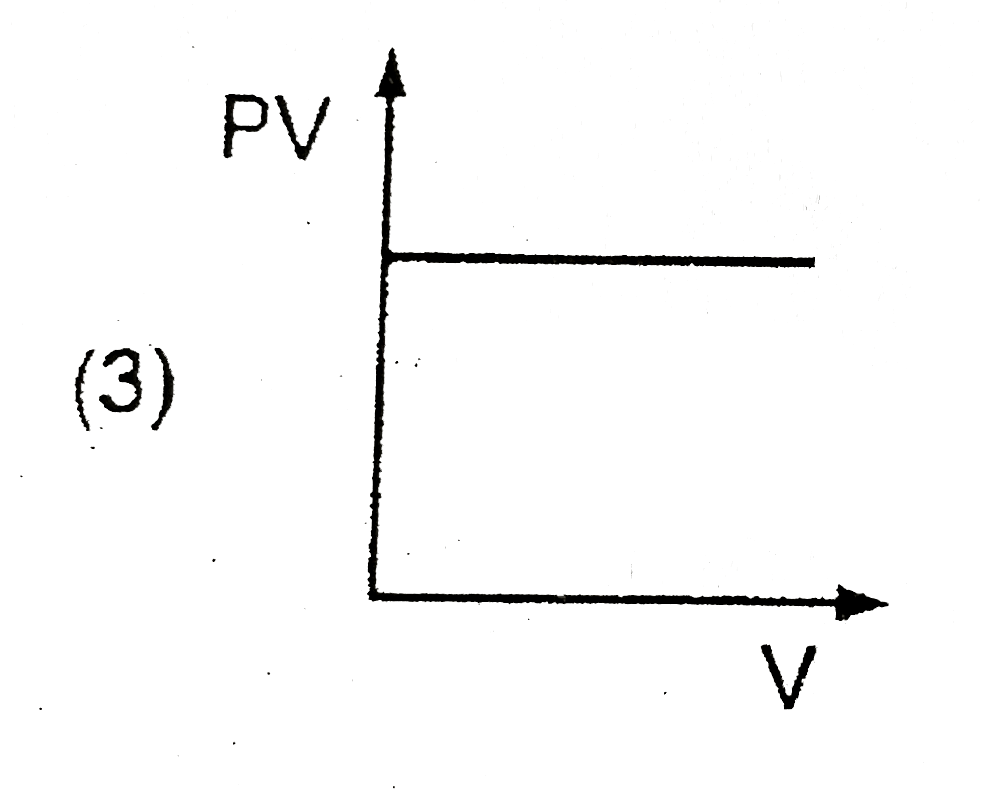 DAll of these
 - Question 3 - Select One or More
Which of the following graph represent Boyle's law ?
A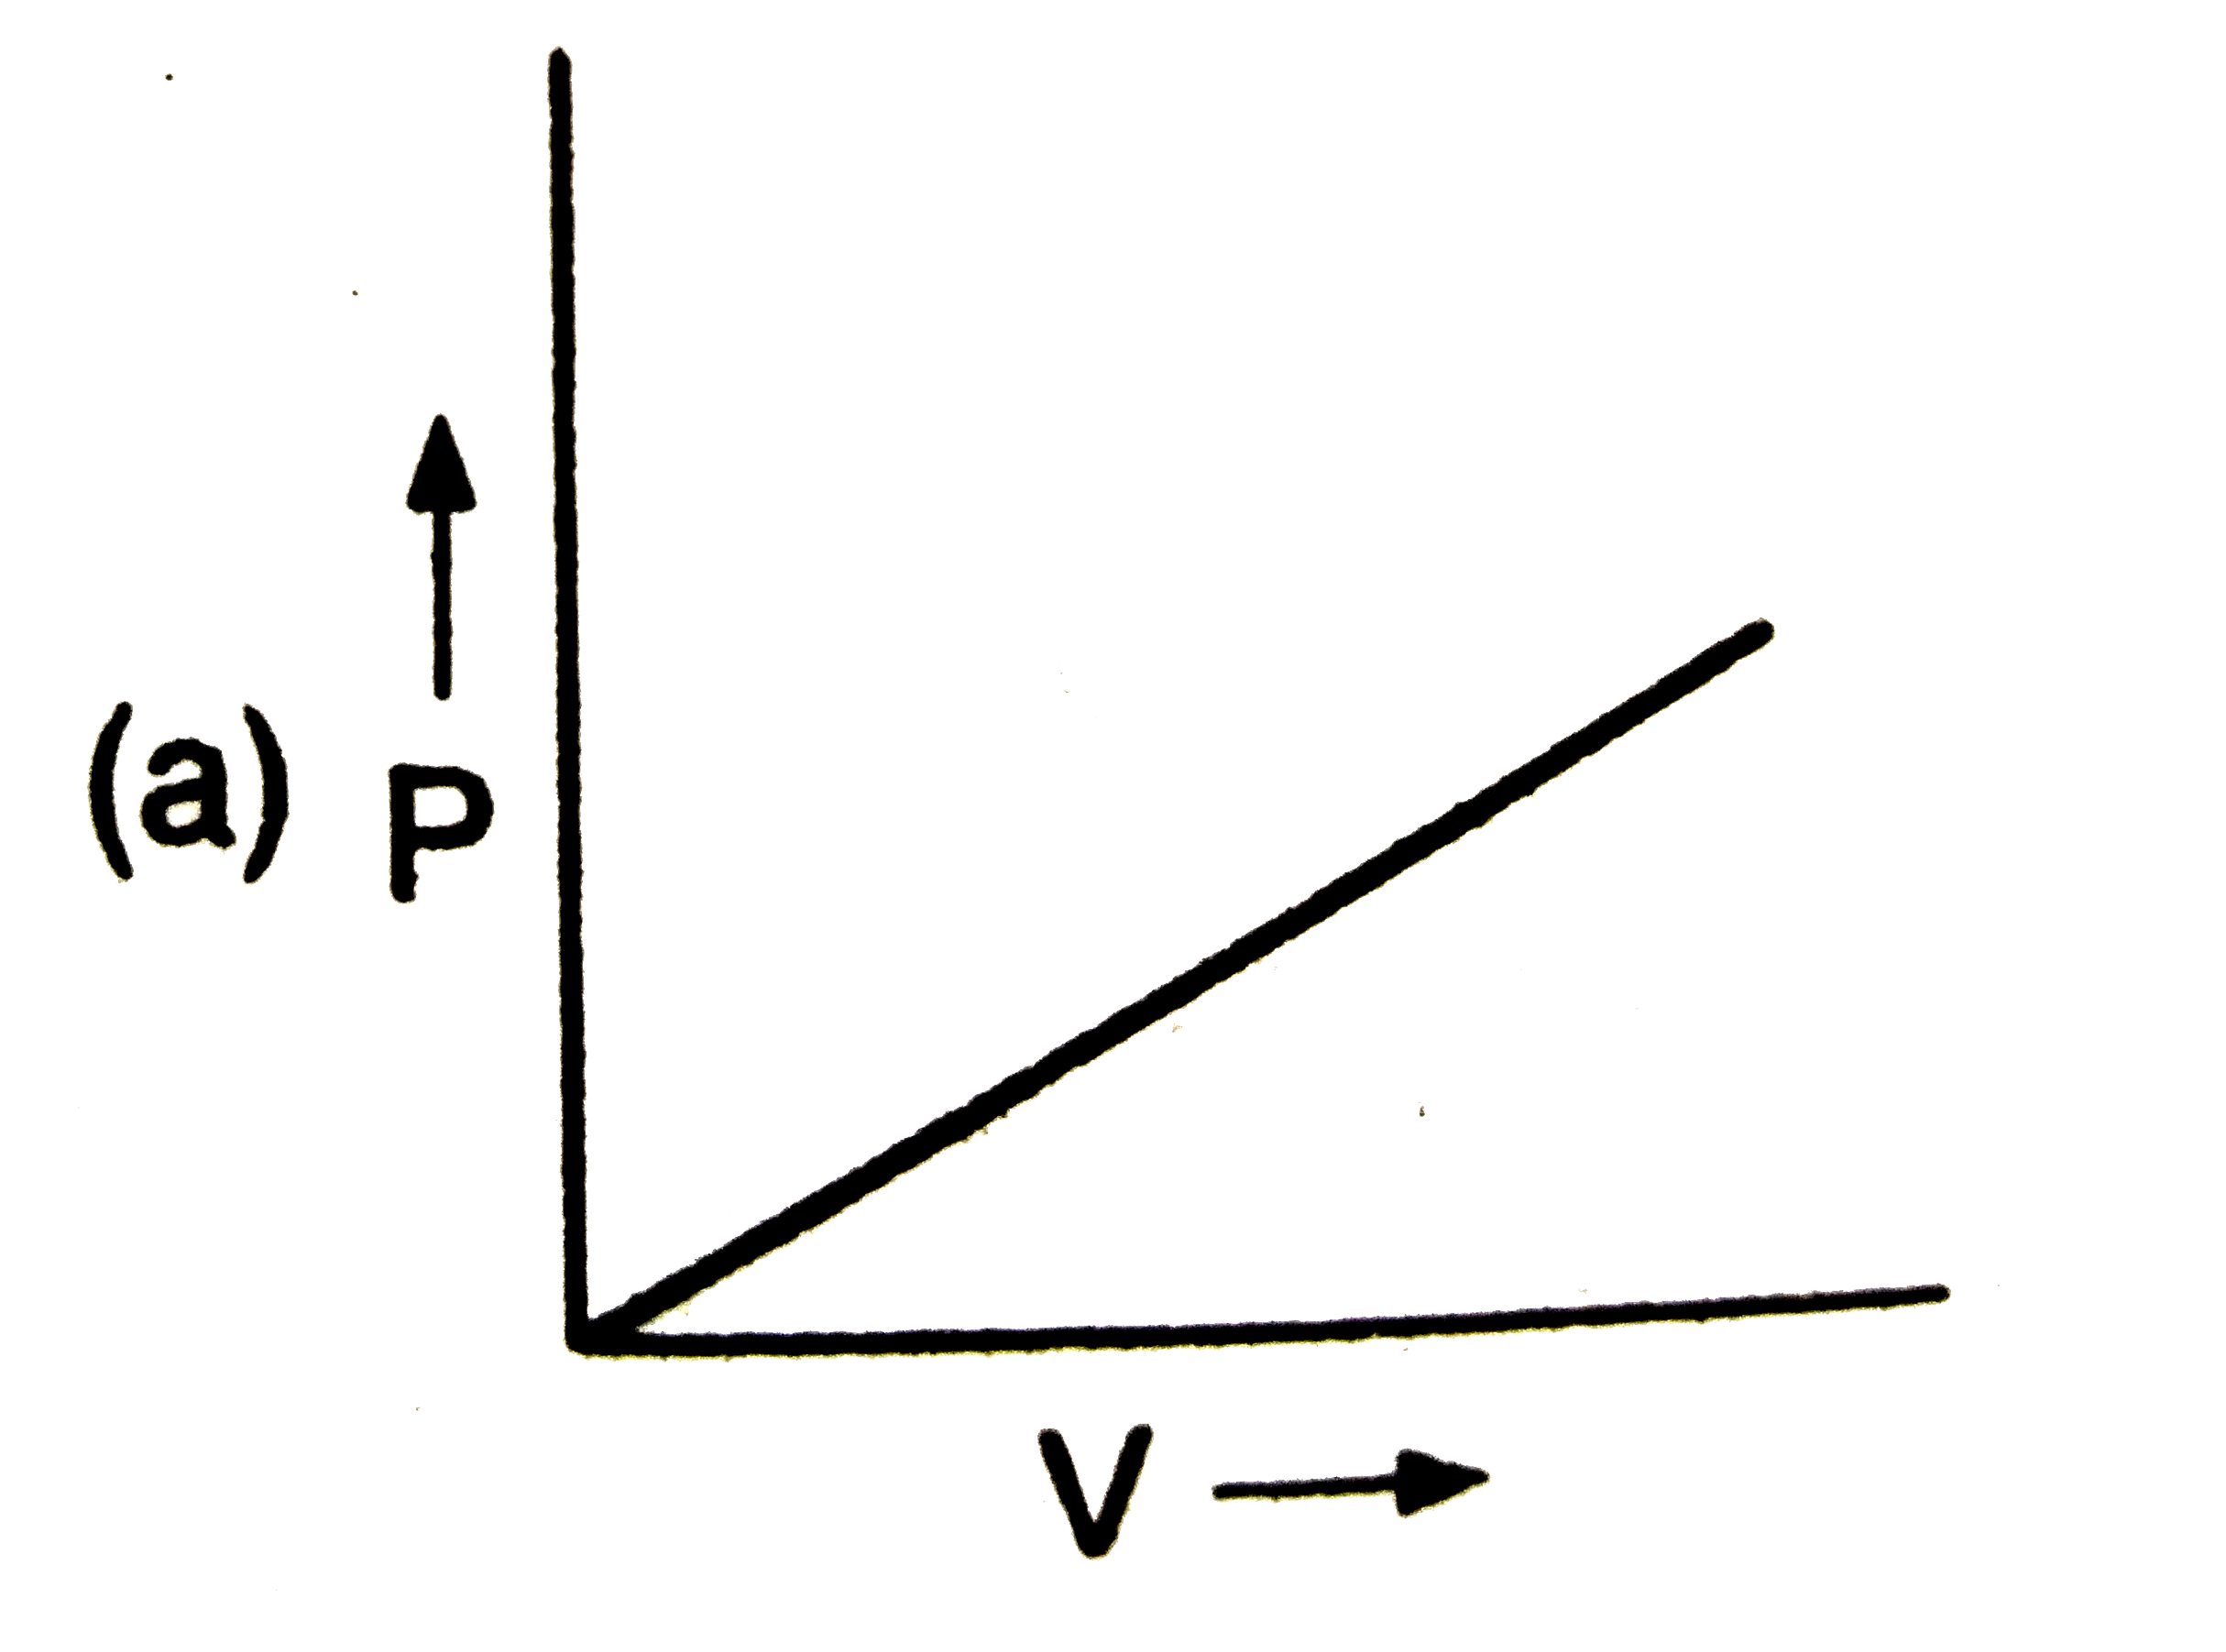 B
B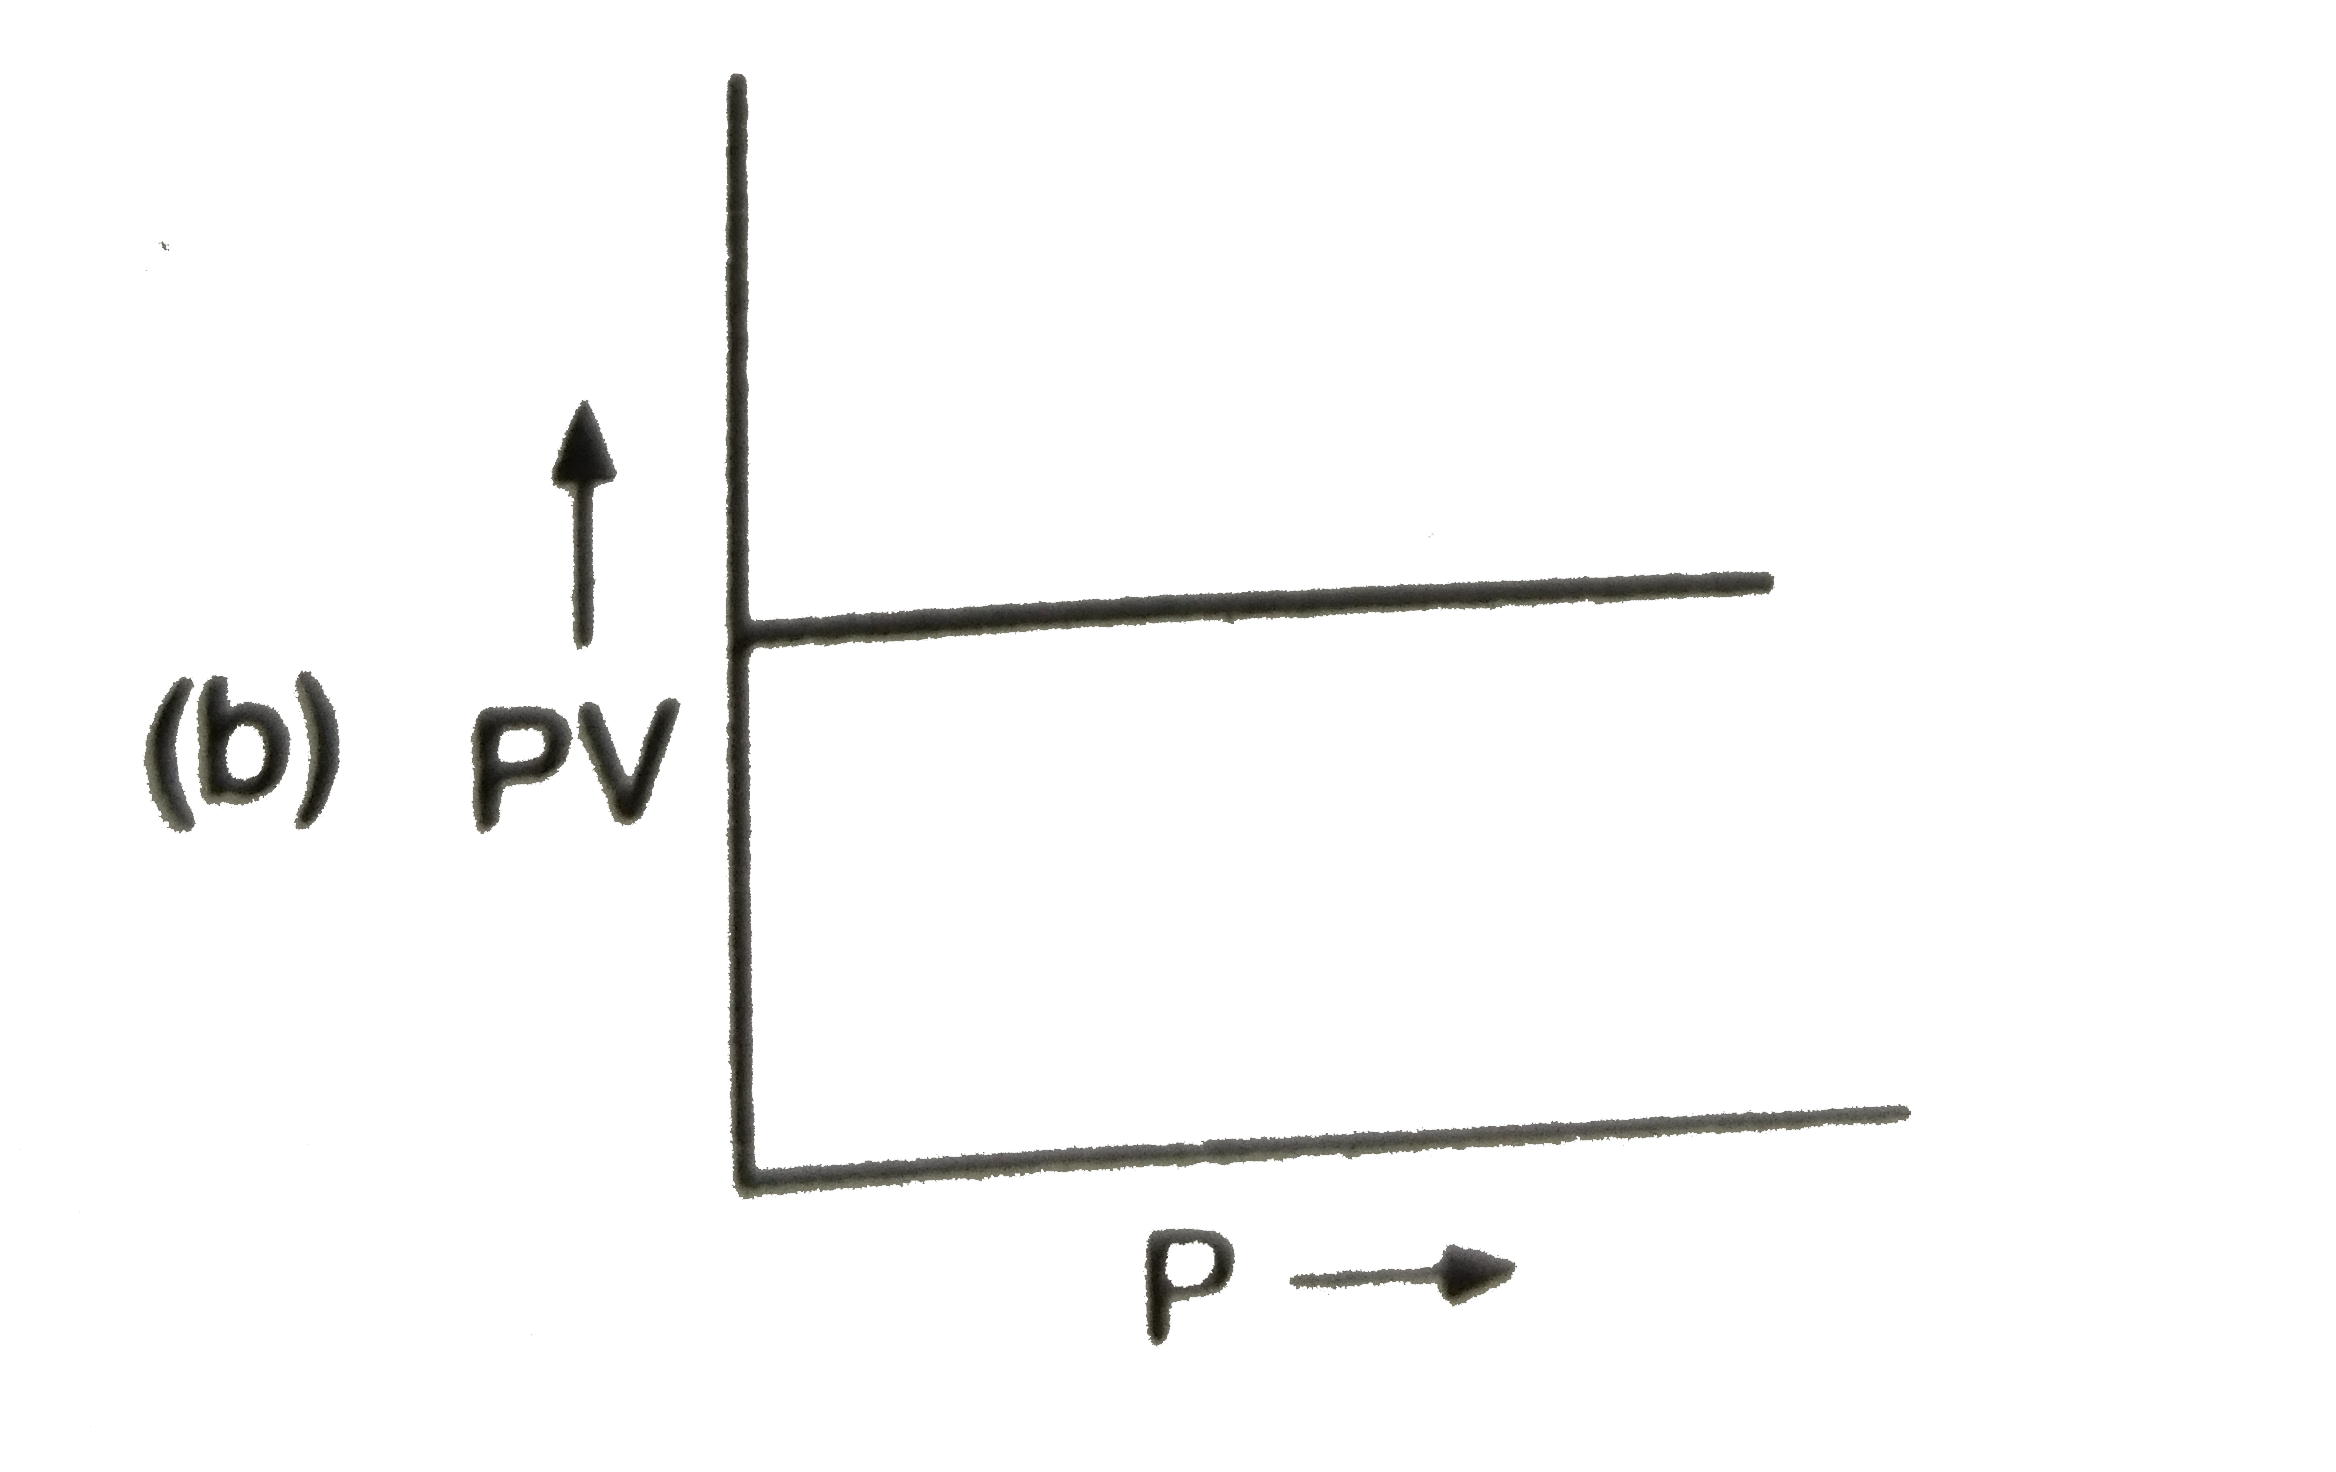 C
C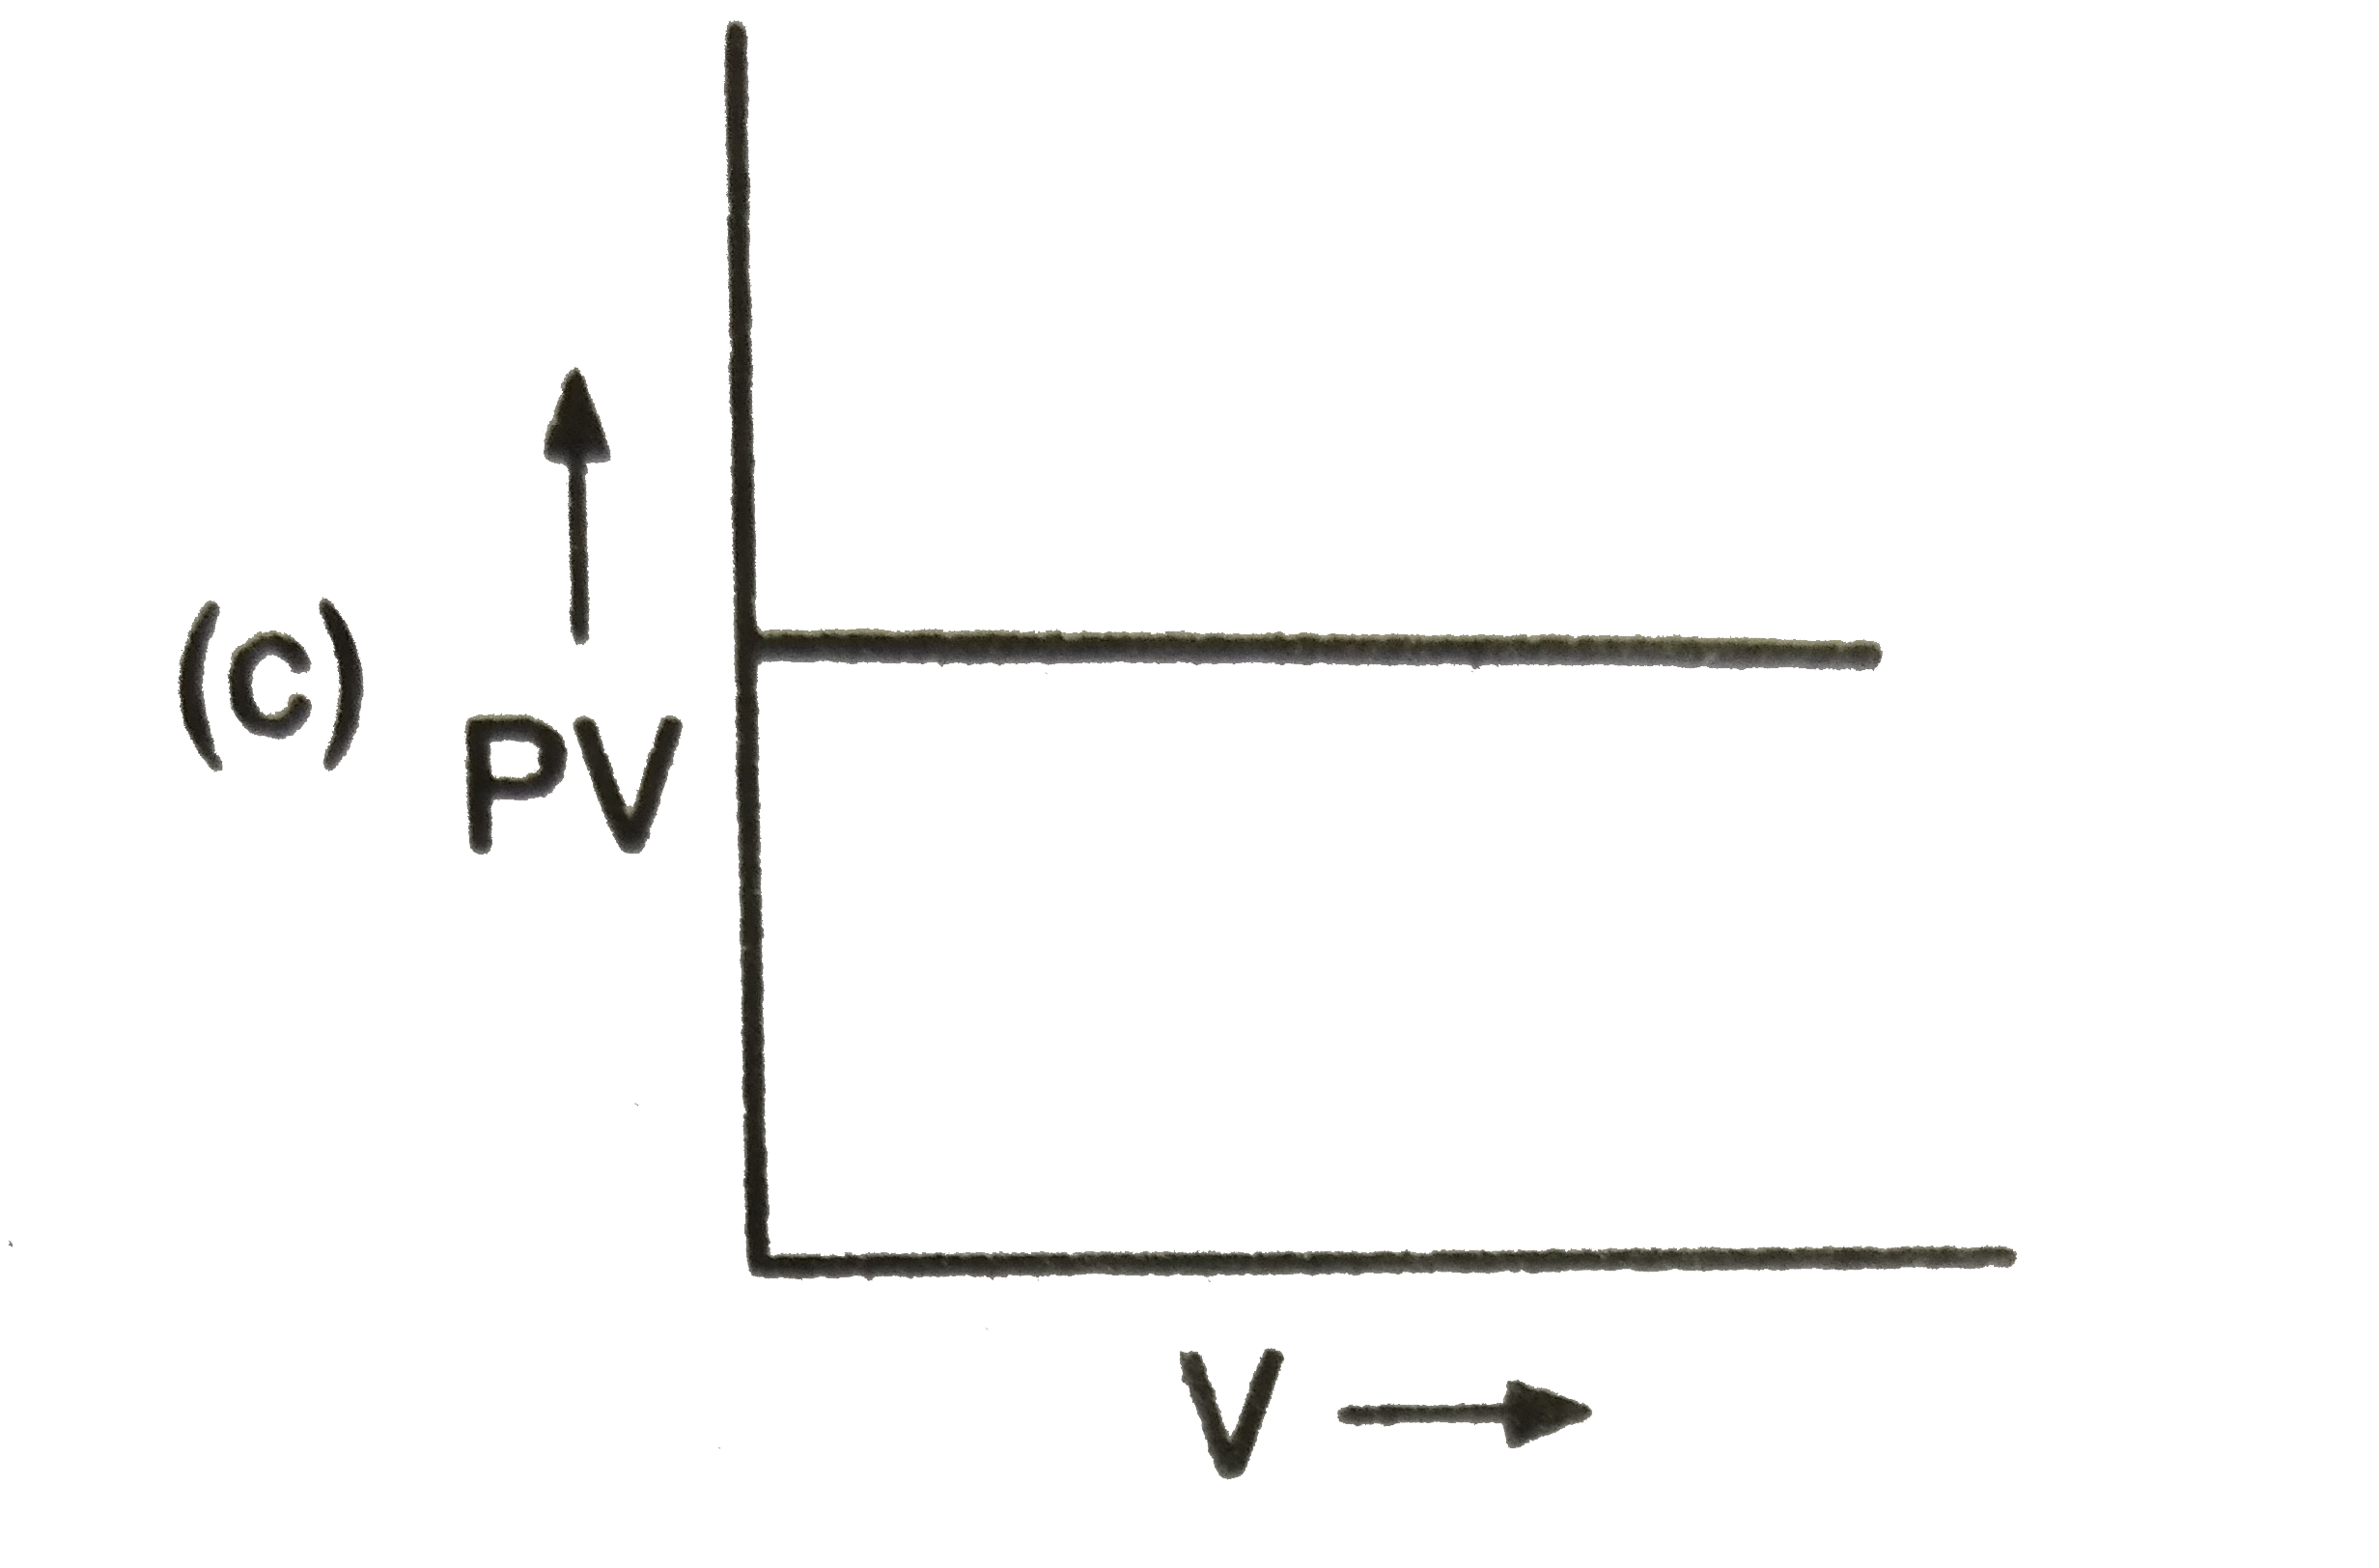 D
D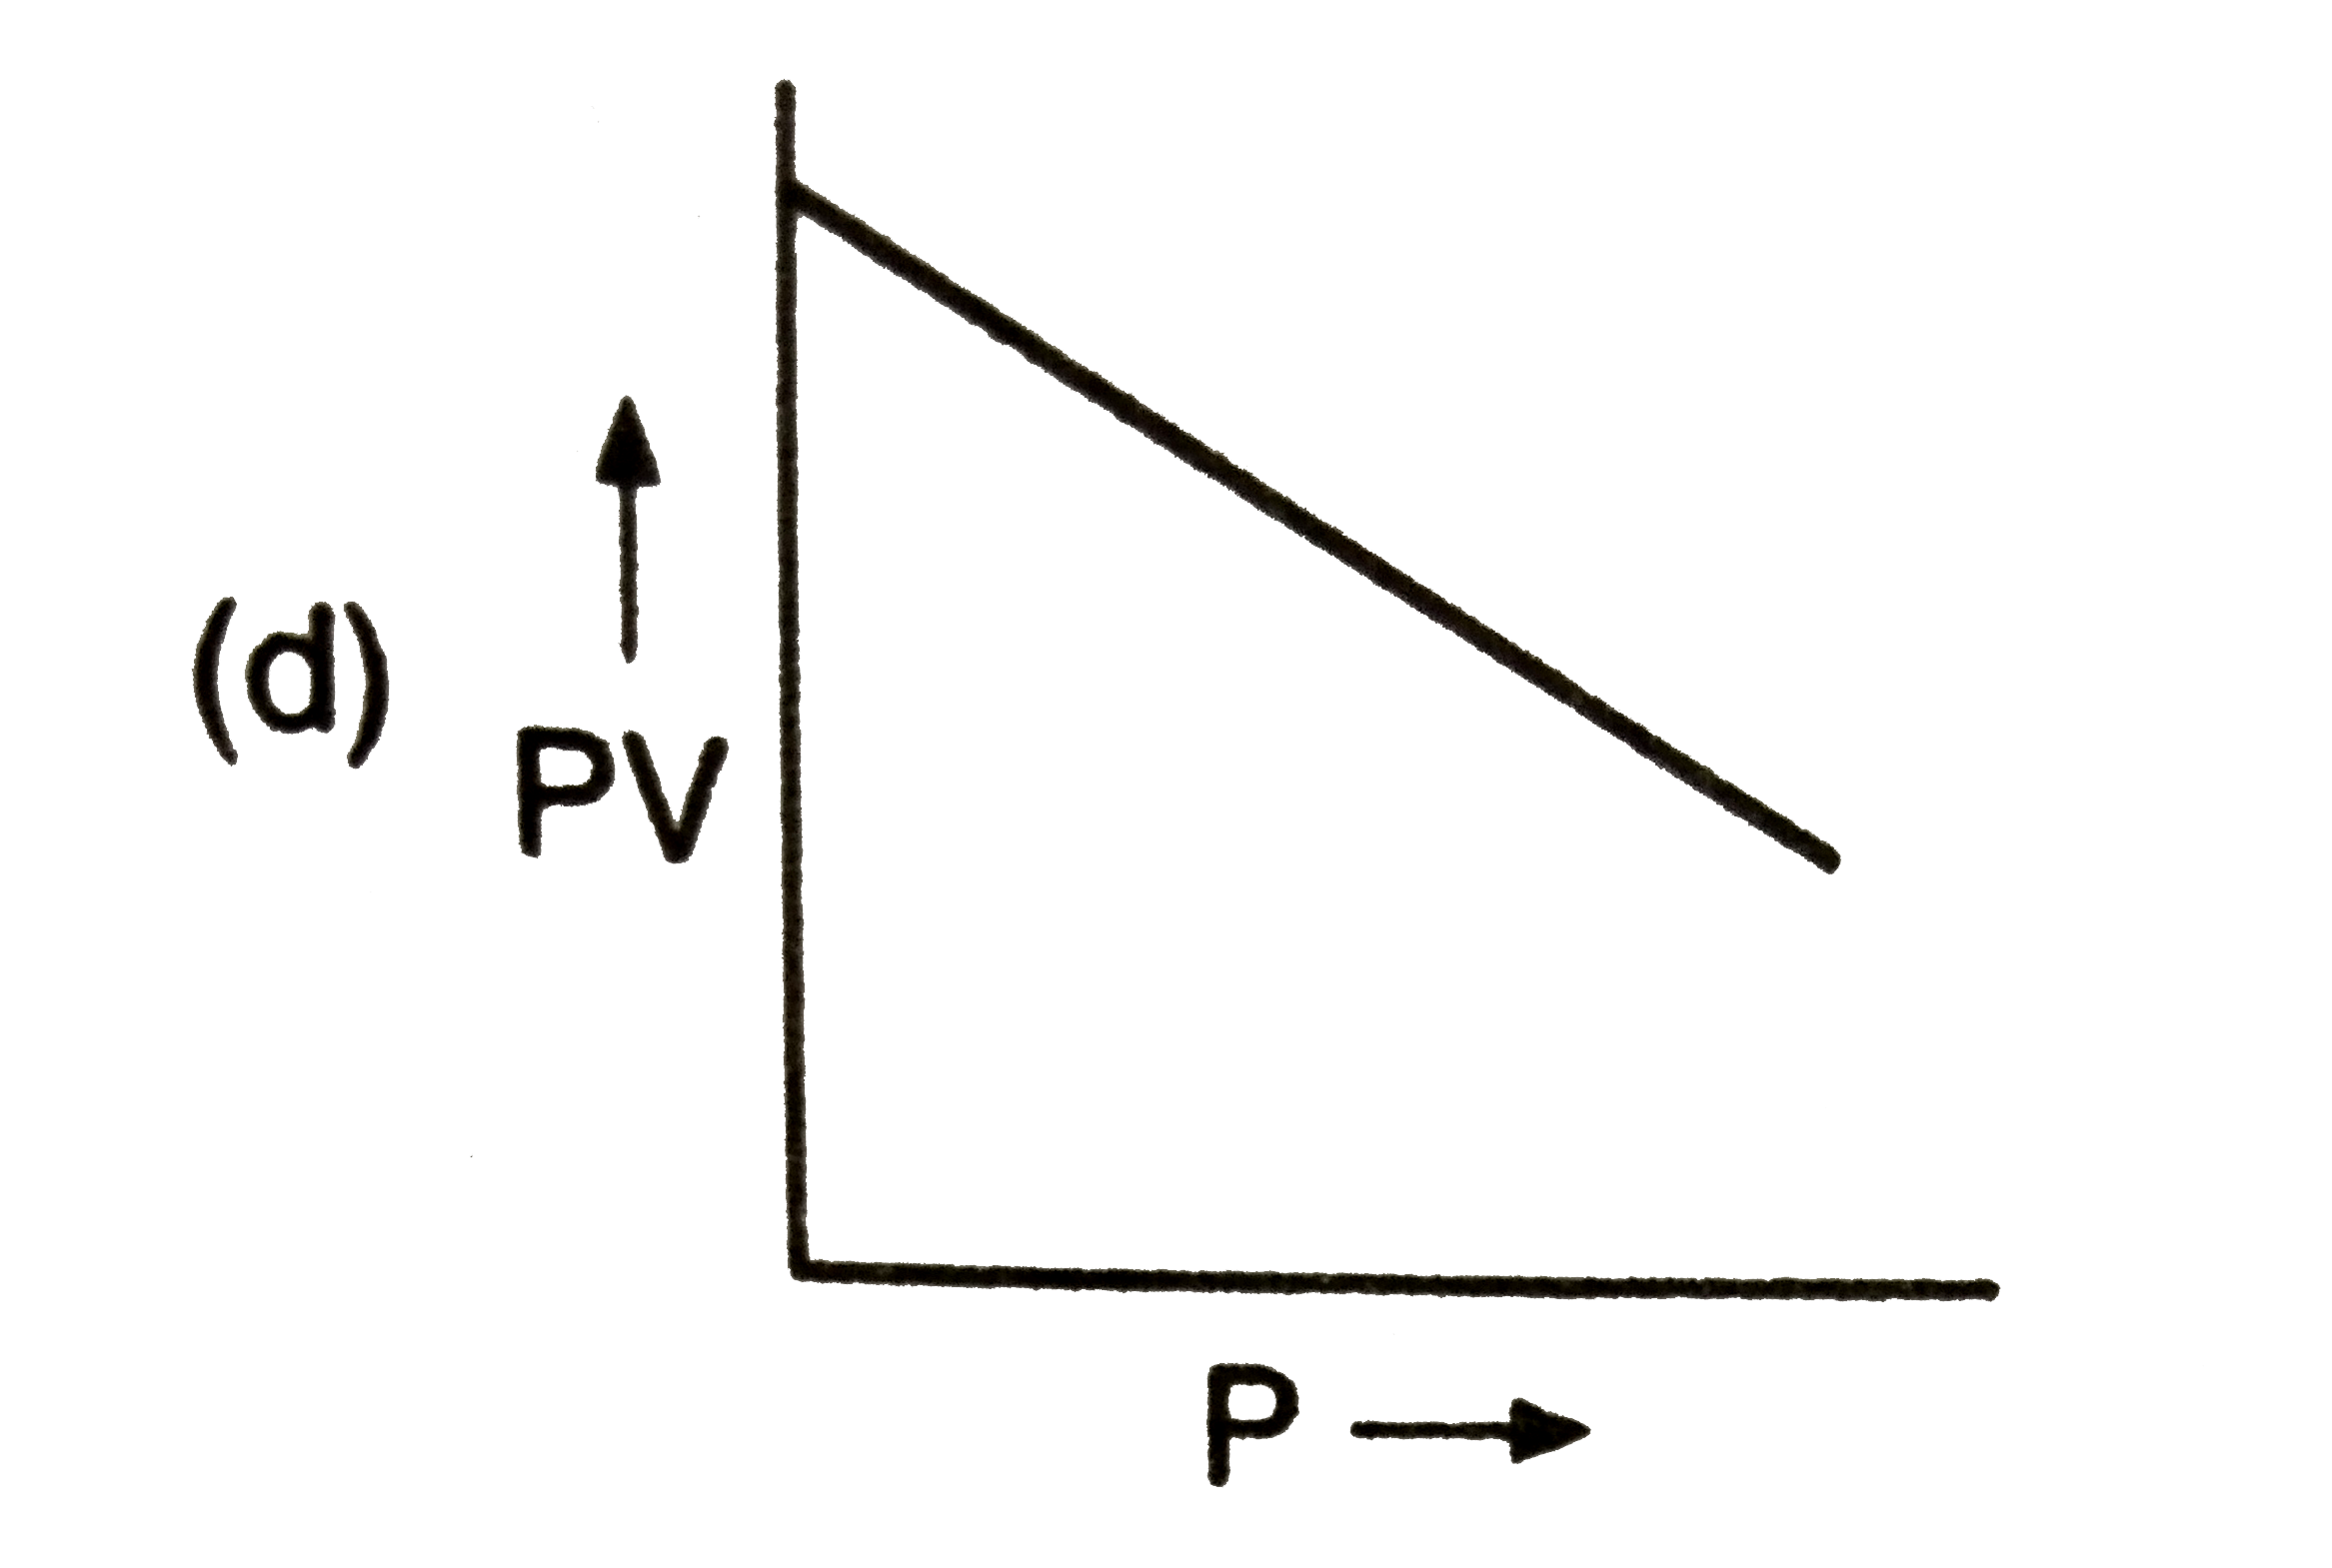
Name the gas law which relates volume and pressure of gas at constant temperature.
View SolutionPressure vs volume graph at constant temperature is known as…………….
View SolutionWhich of the following graph represents Boyle's law ?
View SolutionAccodring to Boyle's law, the product of pressure and volume is a constant. Hence,
View SolutionWhich among the following is the correct mathematical representation of Dalton's law of partial pressures?
View Solution

