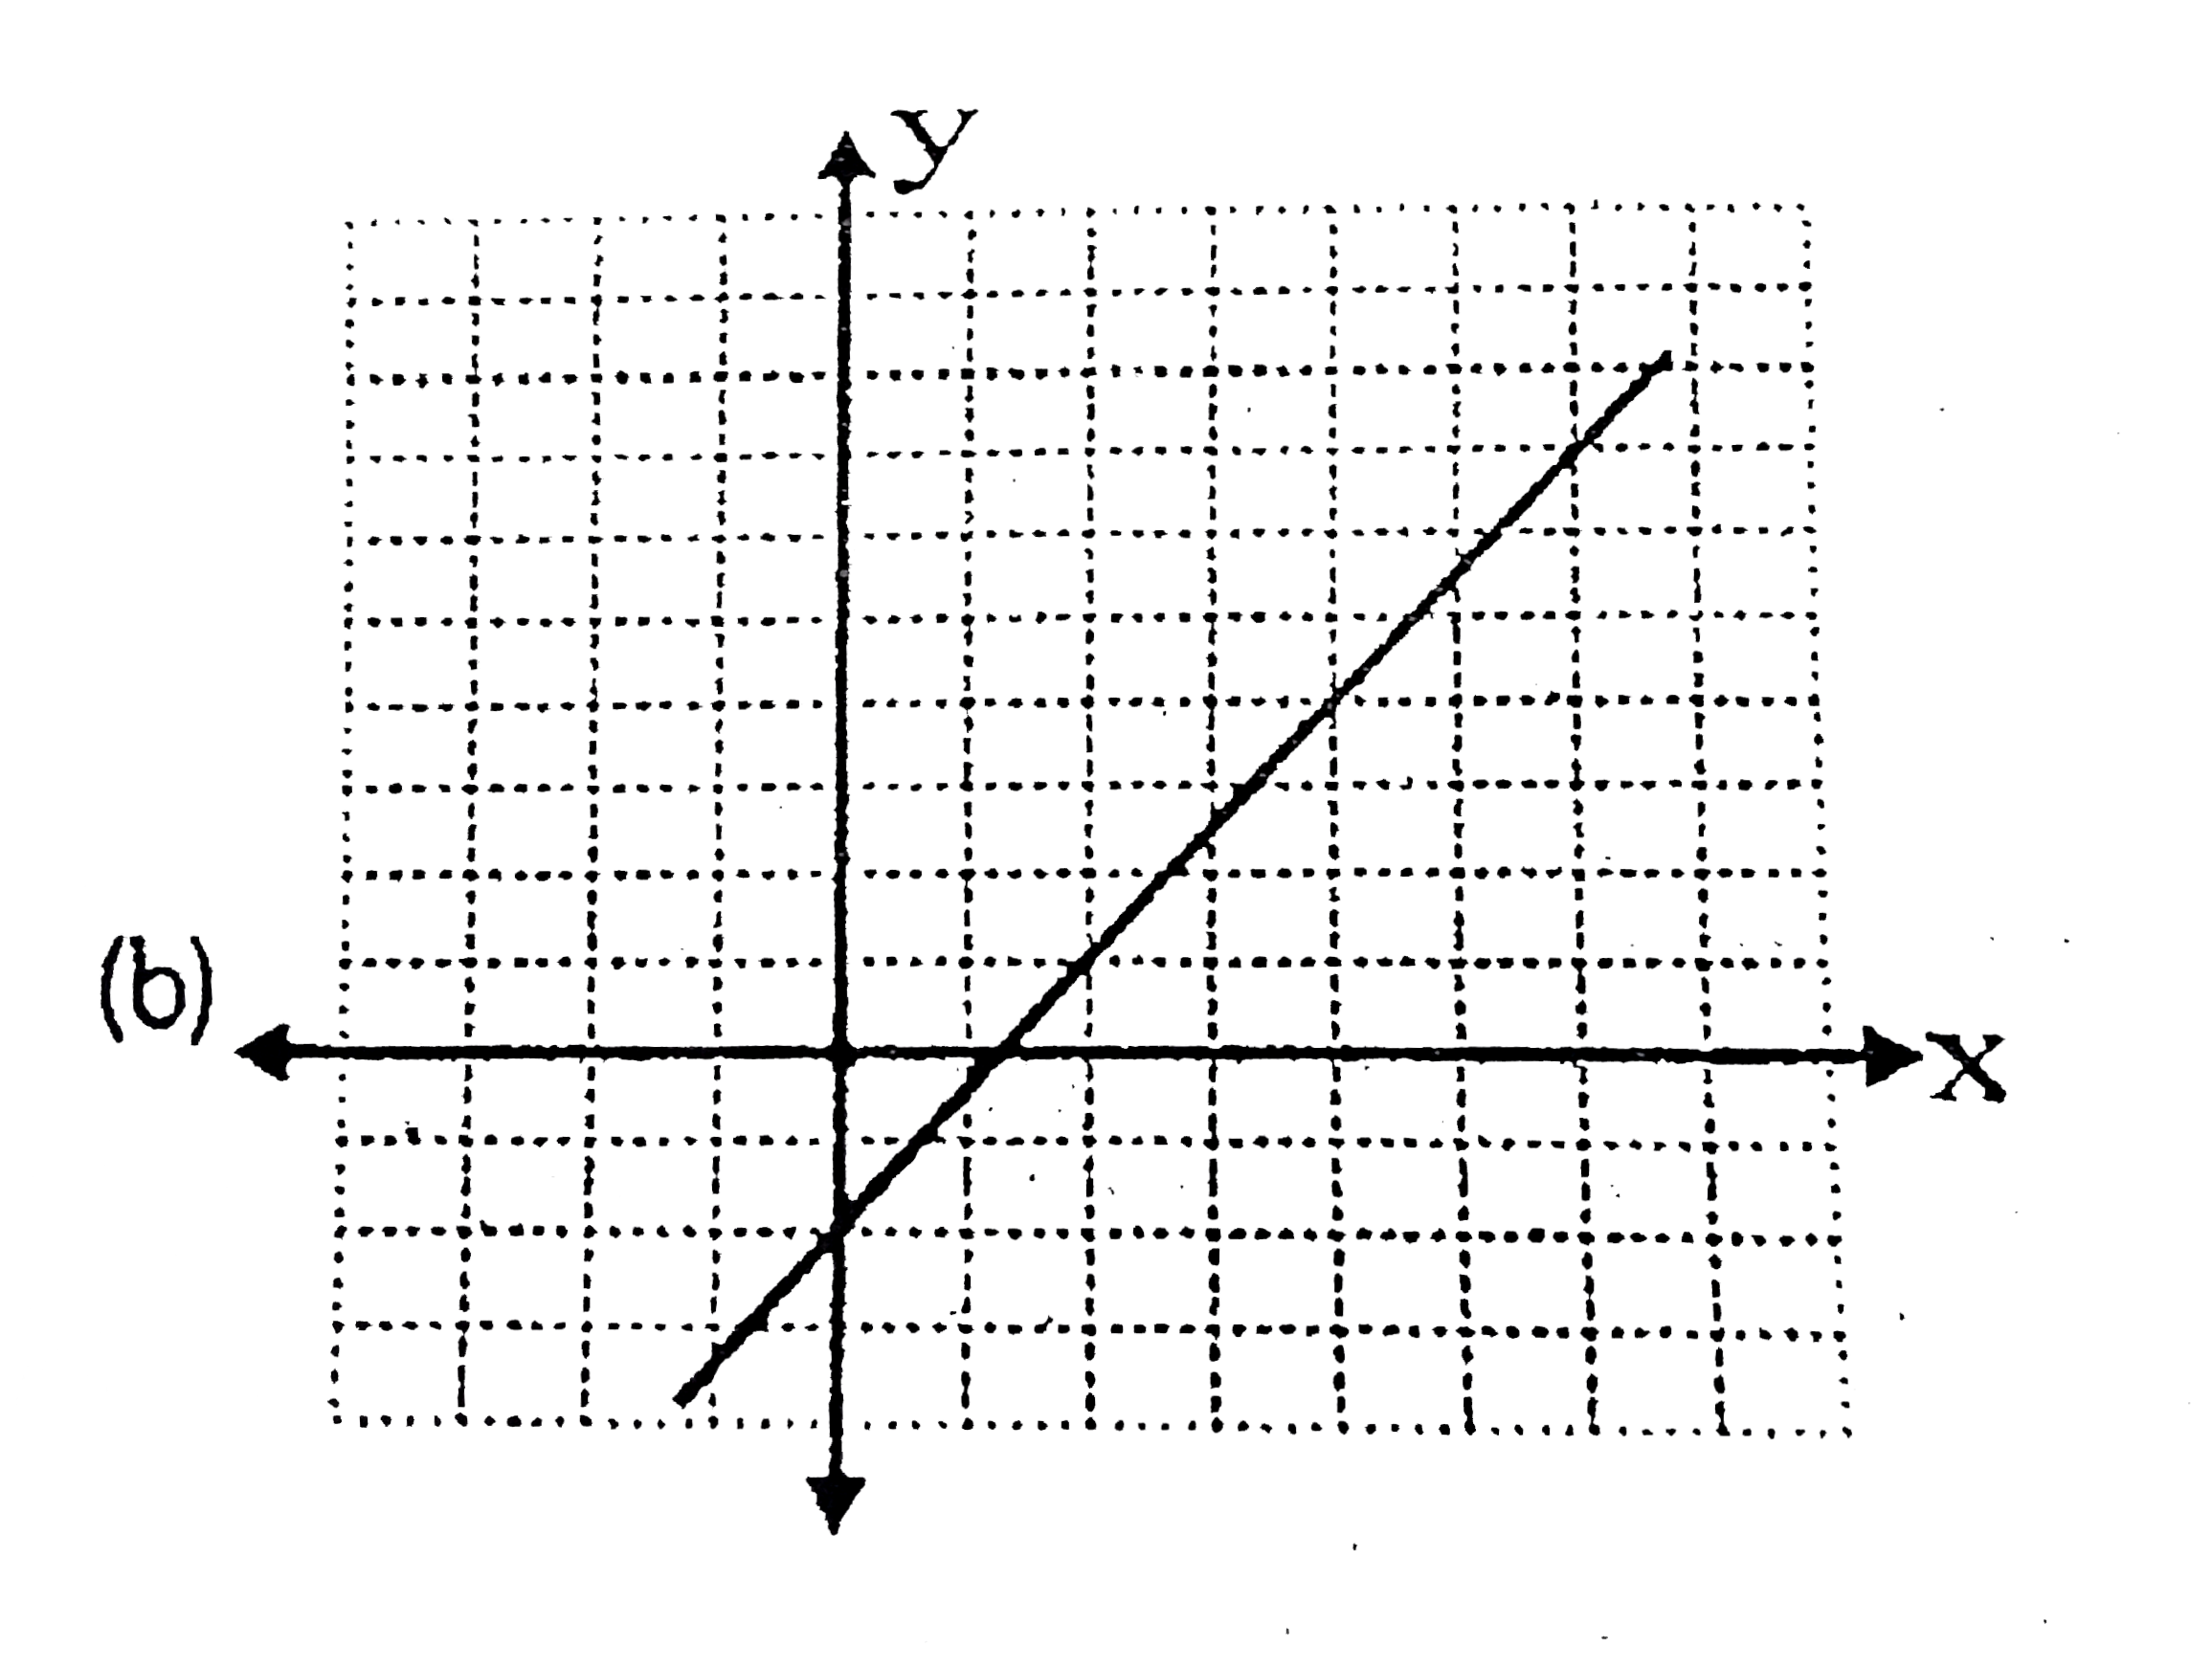
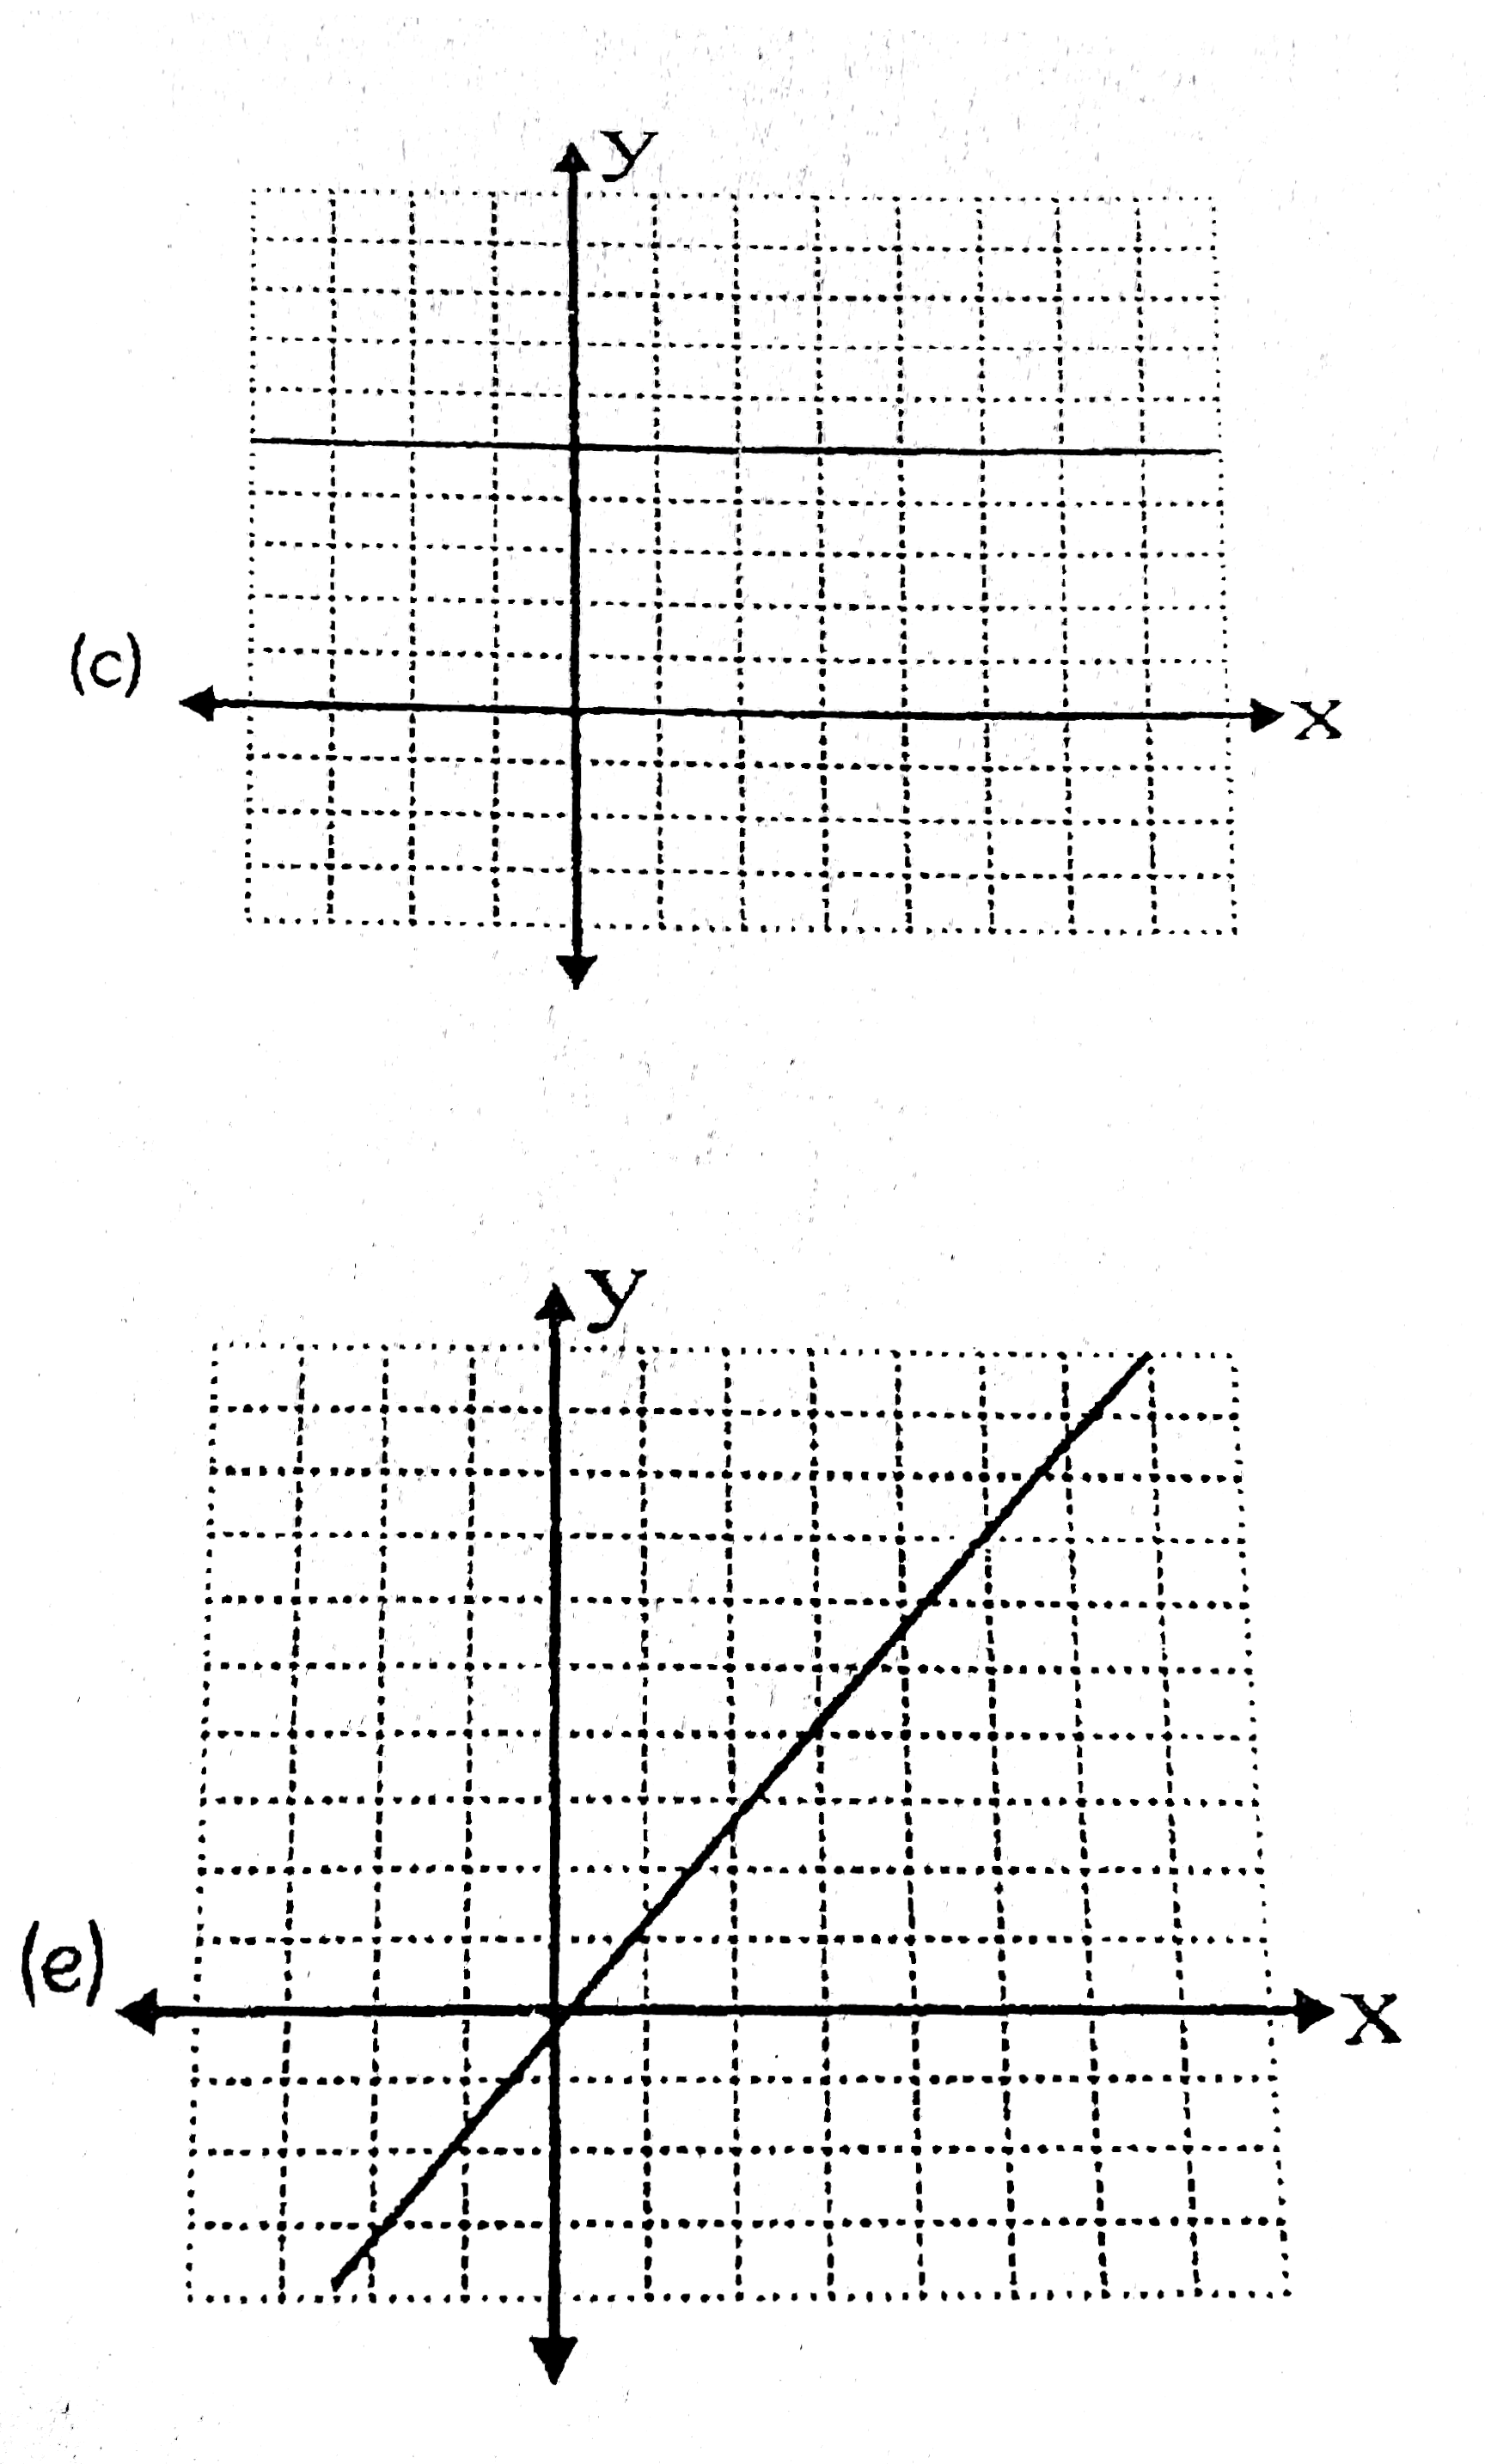
The equation of straight line shown in figure is :

(I)
(II)
(III)
(IV)
The correct Answer is:C
Alcohol forms hydrogen bonding so their boiling point is higher, Ether can not form H bond so its boiling point is lowest

Topper's Solved these Questions
- BOOK - ERRORLESSCHAPTER - ALCOHOLS, PHENOLS AND ETHERSEXERCISE - NCERT BASED QUESTIONS (Different Ethers and Hydroxy Compounds)28videos
ALCOHOLS, PHENOLS AND ETHERS
- BOOK - ERRORLESSCHAPTER - ALCOHOLS, PHENOLS AND ETHERSEXERCISE - PAST YEARS QUESTIONS36videos
ALCOHOLS, PHENOLS AND ETHERS
- BOOK - ERRORLESSCHAPTER - ALCOHOLS, PHENOLS AND ETHERSEXERCISE - NCERT BASED QUESTIONS (Nitrophenols, Dihydric and Trihydric Phenols)15videos
ALCOHOLS, PHENOLS AND ETHERS
- BOOK - ERRORLESSCHAPTER - ALDEHYDES AND KETONESEXERCISE - ASSERTION AND REASON10videos
ALDEHYDES AND KETONES
Similar Questions
Knowledge Check
- Question 1 - Select One
The velocity - time graph of a particle moving along a straight line is shown in the figure given below
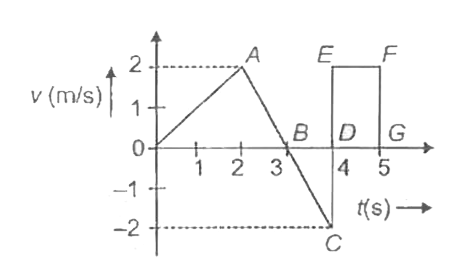
The displacement of the particle in 5 second isA0.5 mB1 mC2 mD4 m - Question 2 - Select One or More
The velocity-time plot for a particle moving on a straight line is shown in figure.
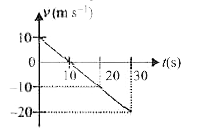 AThe particle has a constant acceleration.BThe particle has never tumed around.CThe particle has zero displacement.DThe average speed in the interval 0 to 10 s is the same as the average speed in the interval 10s to 20 s.
 - Question 3 - Select One or More
The velocity time plot for a particle moving on straight line is shown in the figure.
 AThe particle has a constant accelerationBThe particle has nevedr turned aroundCThe paeticle has zero displacement.DThe average speed in the interval 0 to 10 s is the same as the average speed in the interval 10 s to 20s.
The x−t graph of particle moving along a straight line is shown in figure
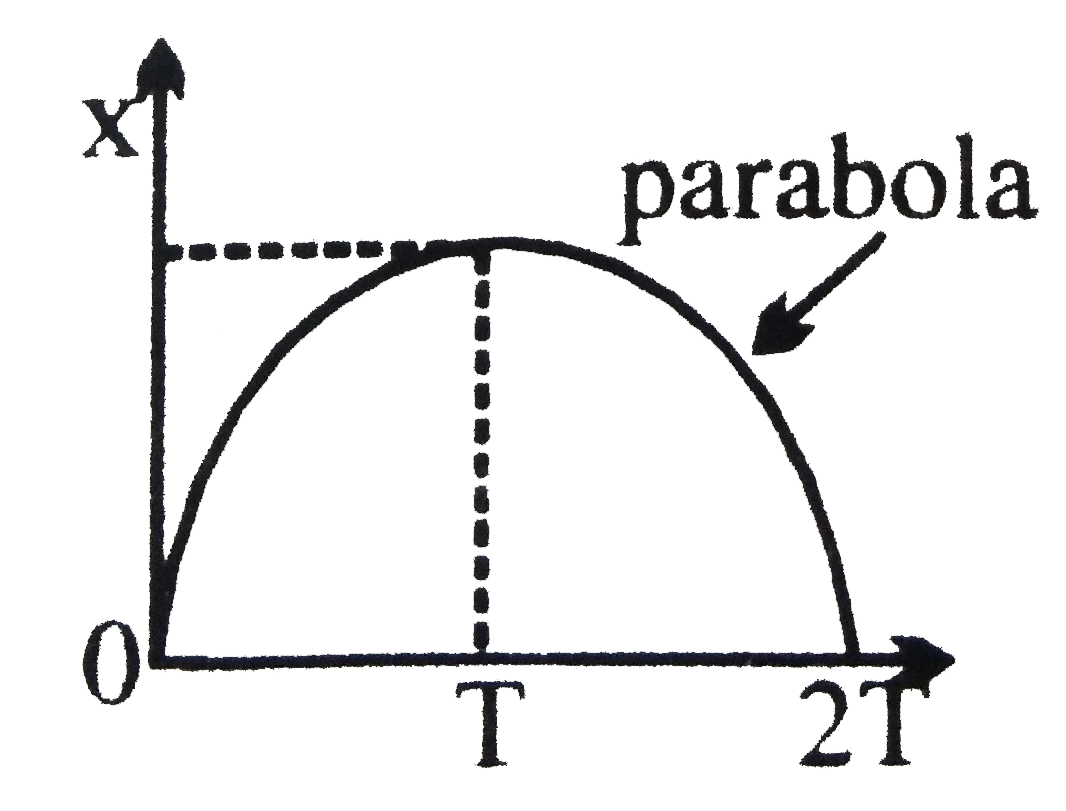
The a−t graph of the particle is correctly shown byView SolutionThe x-t graph of a particle moving along a straight line is shown in figure
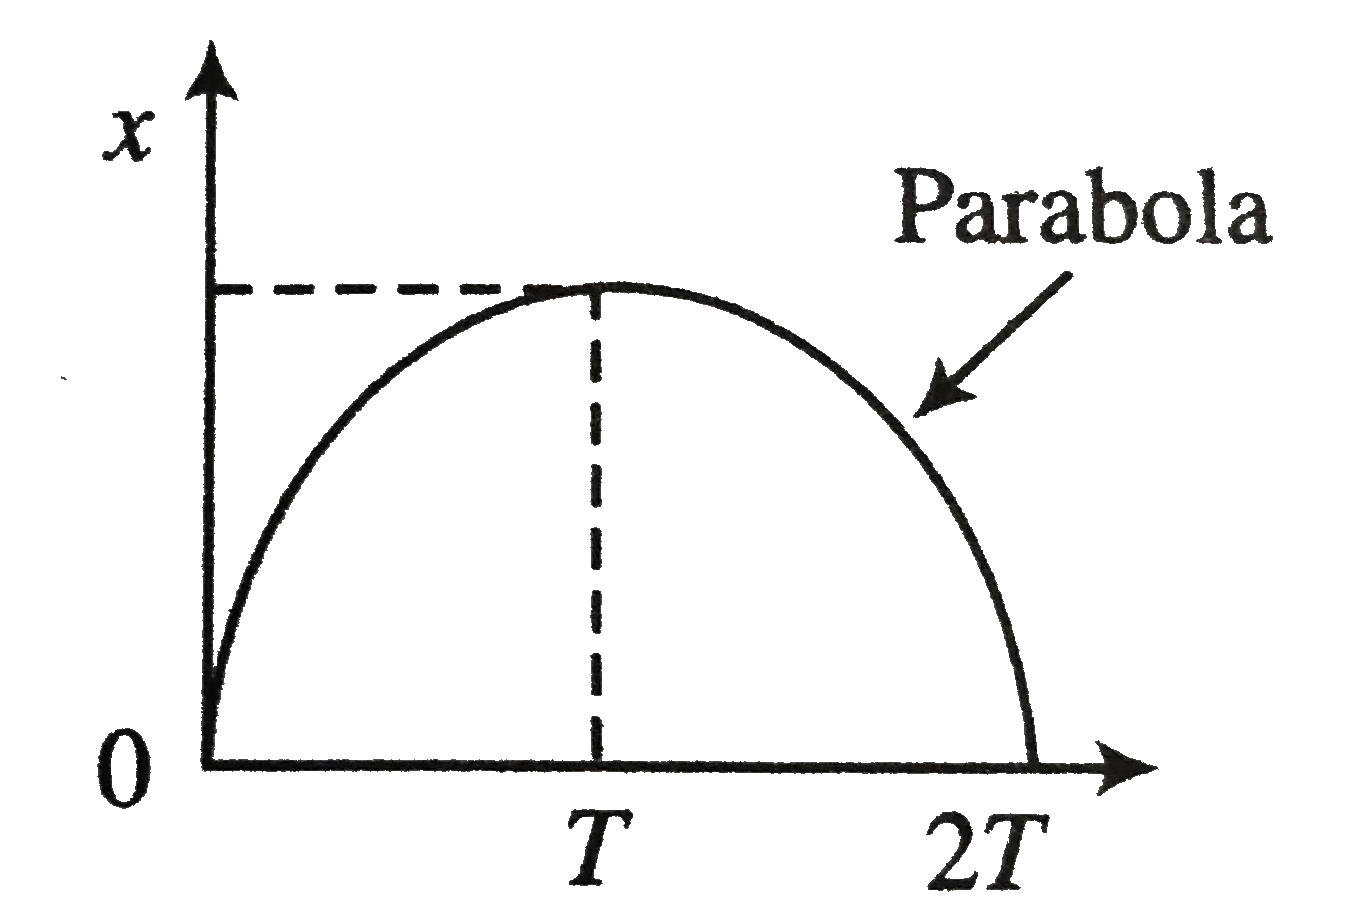
The a-t graph of the particle is correctly shown byView SolutionThe x−t graph of particle moving along a straight line is shown in figure
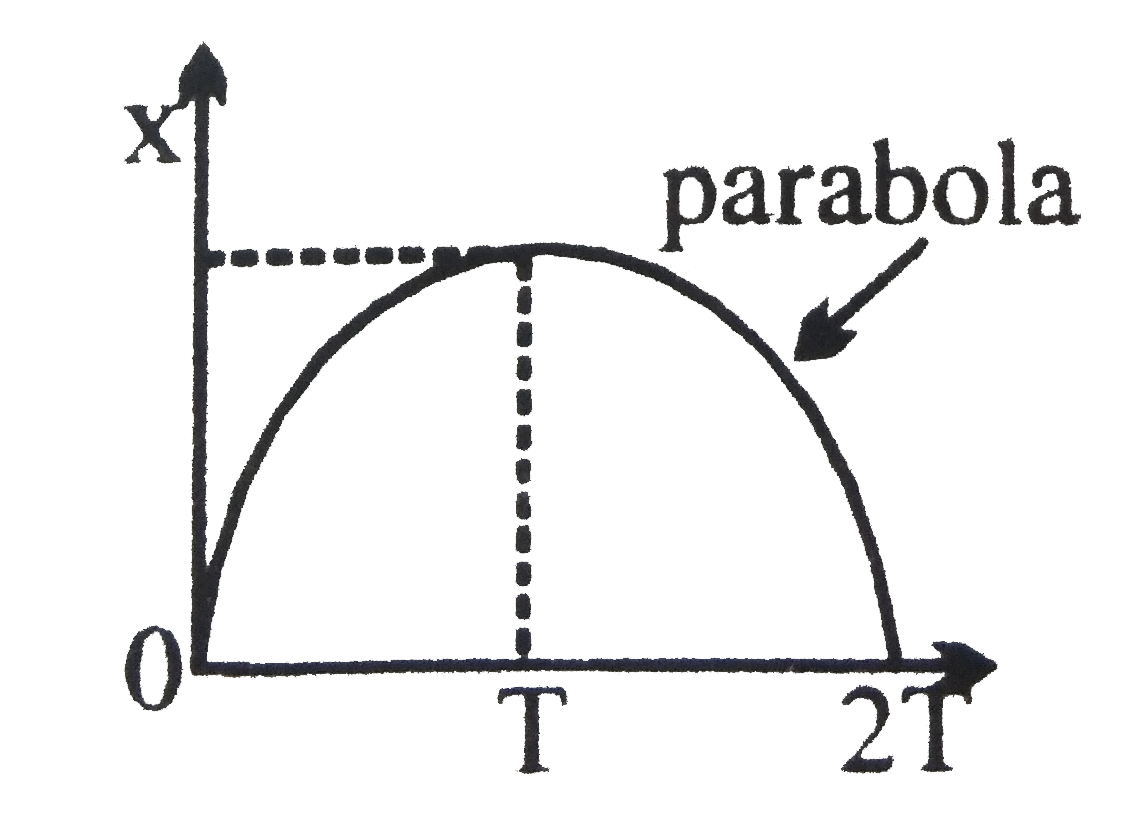
The v−t graph of the particles is correctly shown byView SolutionThe x-t graph of a particle moving along a straight line is shown in figure
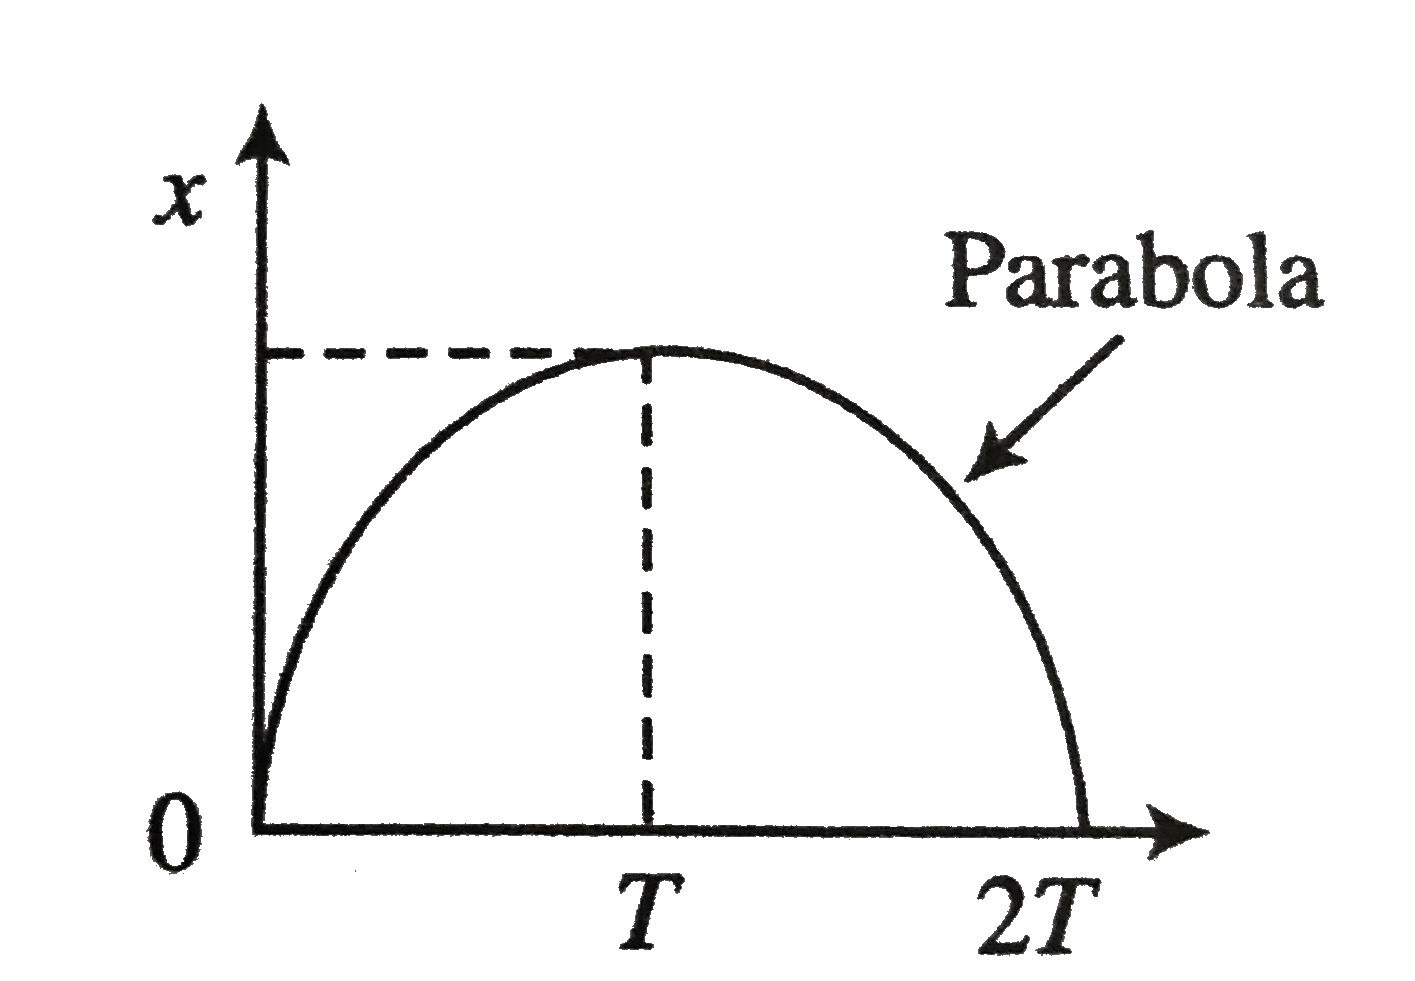
The speed-time graph of the particle is correctly shown byView SolutionThe x-t graph of a particle moving along a straight line is shown in figure

The v-t graph of the particle is correctly shown byView Solution


