Use Einstein's photoelectric equation to depict the variation of the maximum kinetic energy of electrons emitted, with the frequency (v) of the incident radiation.
To depict the variation of the maximum kinetic energy Ek of electrons emitted with the frequency ν of the incident radiation using Einstein's photoelectric equation, we can follow these steps:
1. Understand Einstein's Photoelectric Equation:
The photoelectric equation is given by:
E=ϕ+Ek
where E is the energy of the incident photon, ϕ is the work function of the metal, and Ek is the maximum kinetic energy of the emitted electrons.
2. Express Photon Energy in Terms of Frequency:
The energy of a photon can be expressed as:
E=hν
where h is Planck's constant and ν is the frequency of the incident radiation.
3. Substitute Photon Energy into the Photoelectric Equation:
By substituting E=hν into the photoelectric equation, we get:
hν=ϕ+Ek
4. Rearranging the Equation for Kinetic Energy:
To find the maximum kinetic energy Ek, rearrange the equation:
Ek=hν−ϕ
5. Identify the Relationship Between Ek and ν:
From the equation Ek=hν−ϕ, we can see that:
- The maximum kinetic energy Ek is directly proportional to the frequency ν.
- The slope of the line in a graph of Ek versus ν is h (Planck's constant).
- The y-intercept of the graph is −ϕ (the negative work function).
6. Draw the Graph:
- On the x-axis, plot the frequency ν.
- On the y-axis, plot the maximum kinetic energy Ek.
- The graph will be a straight line with a positive slope (equal to h) and a y-intercept at −ϕ.
7. Identify the Threshold Frequency:
- The threshold frequency ν0 is defined as the frequency at which Ek=0. This occurs when:
hν0=ϕ
- Thus, if the frequency ν is less than ν0, no electrons will be emitted.
Final Graph Description:
The graph of Ek versus ν will be a straight line starting from the point (−ϕ,0) on the y-axis, indicating that below the threshold frequency ν0, no electrons are emitted. As the frequency increases beyond ν0, the kinetic energy of the emitted electrons increases linearly.
The photoelectric equation is given by:
E=ϕ+Ek
where E is the energy of the incident photon, ϕ is the work function of the metal, and Ek is the maximum kinetic energy of the emitted electrons.
The energy of a photon can be expressed as:
E=hν
where h is Planck's constant and ν is the frequency of the incident radiation.
By substituting E=hν into the photoelectric equation, we get:
hν=ϕ+Ek
To find the maximum kinetic energy Ek, rearrange the equation:
Ek=hν−ϕ
From the equation Ek=hν−ϕ, we can see that:
- The maximum kinetic energy Ek is directly proportional to the frequency ν.
- The slope of the line in a graph of Ek versus ν is h (Planck's constant).
- The y-intercept of the graph is −ϕ (the negative work function).
- On the x-axis, plot the frequency ν.
- On the y-axis, plot the maximum kinetic energy Ek.
- The graph will be a straight line with a positive slope (equal to h) and a y-intercept at −ϕ.
- The threshold frequency ν0 is defined as the frequency at which Ek=0. This occurs when:
hν0=ϕ
- Thus, if the frequency ν is less than ν0, no electrons will be emitted.
The graph of Ek versus ν will be a straight line starting from the point (−ϕ,0) on the y-axis, indicating that below the threshold frequency ν0, no electrons are emitted. As the frequency increases beyond ν0, the kinetic energy of the emitted electrons increases linearly.
Topper's Solved these Questions
- BOOK - XII BOARDS PREVIOUS YEARCHAPTER - QUESTION PAPER 2022 SET - 1EXERCISE - SECTION C5videos
QUESTION PAPER 2022 SET - 1
- BOOK - XII BOARDS PREVIOUS YEARCHAPTER - QUESTION PAPER 2022 SET - 1EXERCISE - SECTION C5videos
QUESTION PAPER 2022 SET - 1
- BOOK - XII BOARDS PREVIOUS YEARCHAPTER - EXAM REVISION SERIESEXERCISE - All Questions42videos
EXAM REVISION SERIES
- BOOK - XII BOARDS PREVIOUS YEARCHAPTER - QUESTION PAPER 2022 SET - 2EXERCISE - SECTION C5videos
QUESTION PAPER 2022 SET - 2
Similar Questions
Explain how Einstein's photoelectric equation enables us to understand the (i) linear dependence, of the maximum K.E. of the emitted electrons, on the frequency of the incident radiations (ii) existance of a threshold frequency for a given photoemitter.
View SolutionAccording to Einstein's photoelectric equation, the graph between kinetic energy of photoelectrons ejected and the frequency of the incident radiation is :
View Solution
Knowledge Check
- Question 1 - Select One
Maximum kinetic energy (Ek) of a photoelectron varies with the frequency (v) of the incident radiation as
A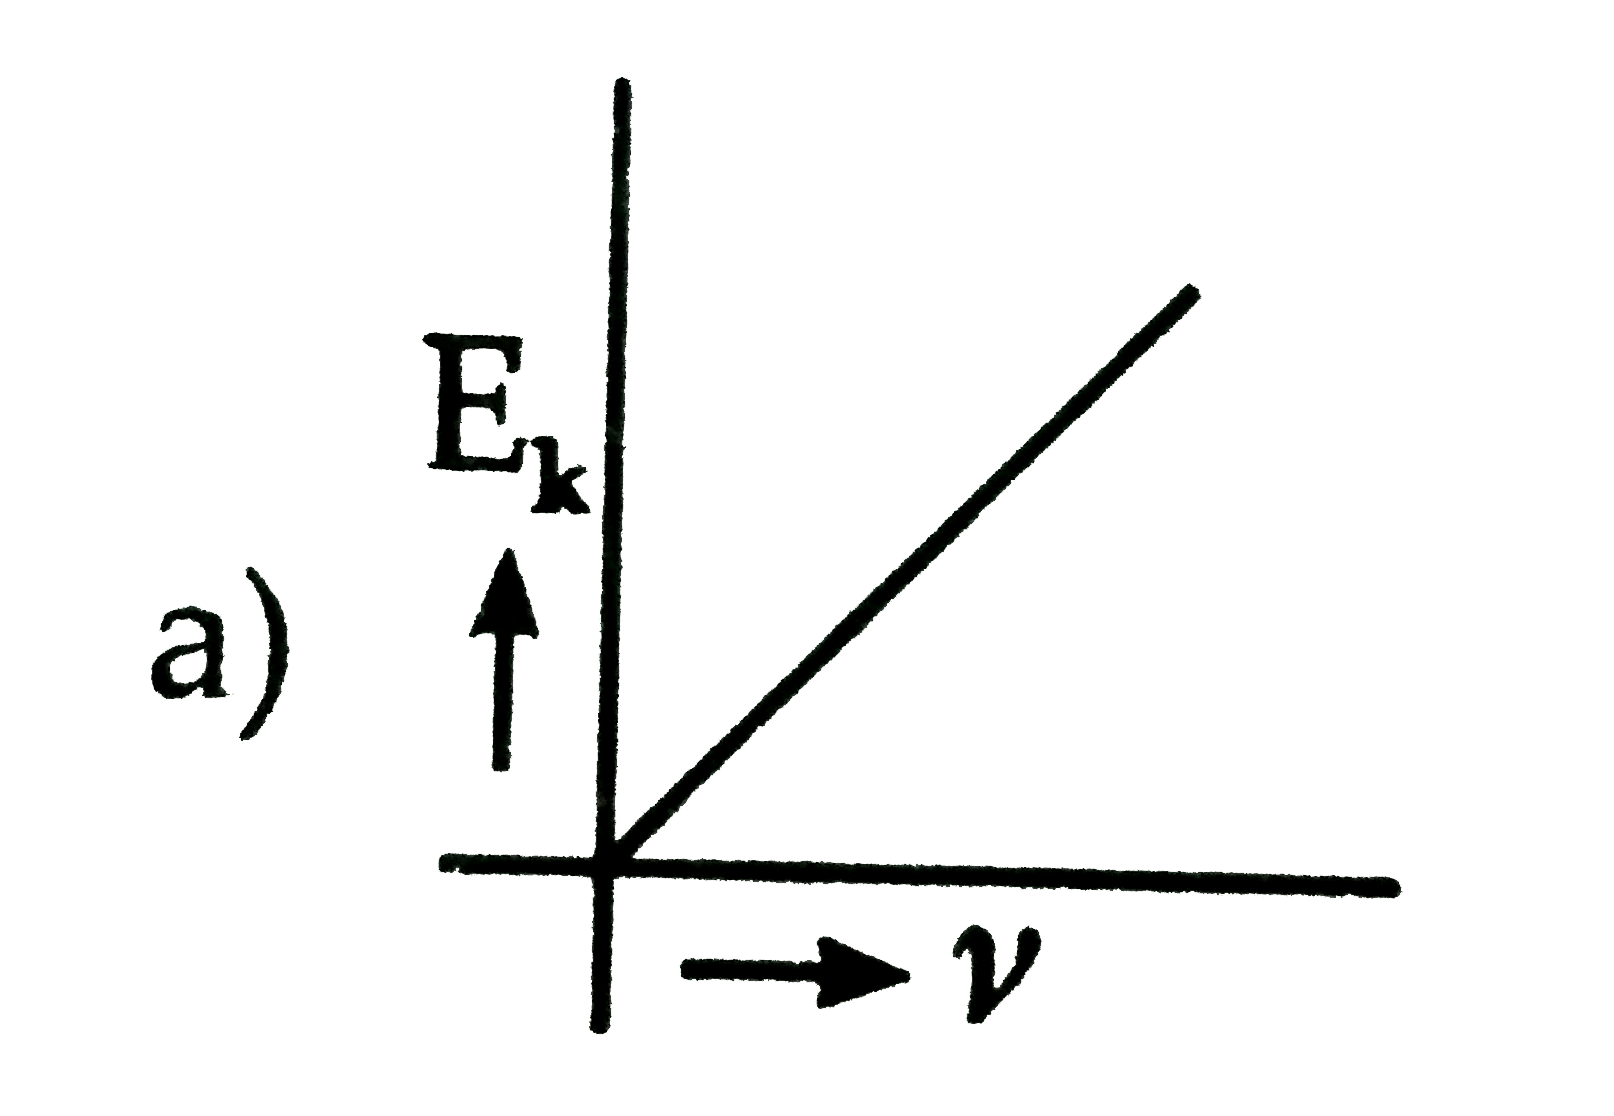 B
B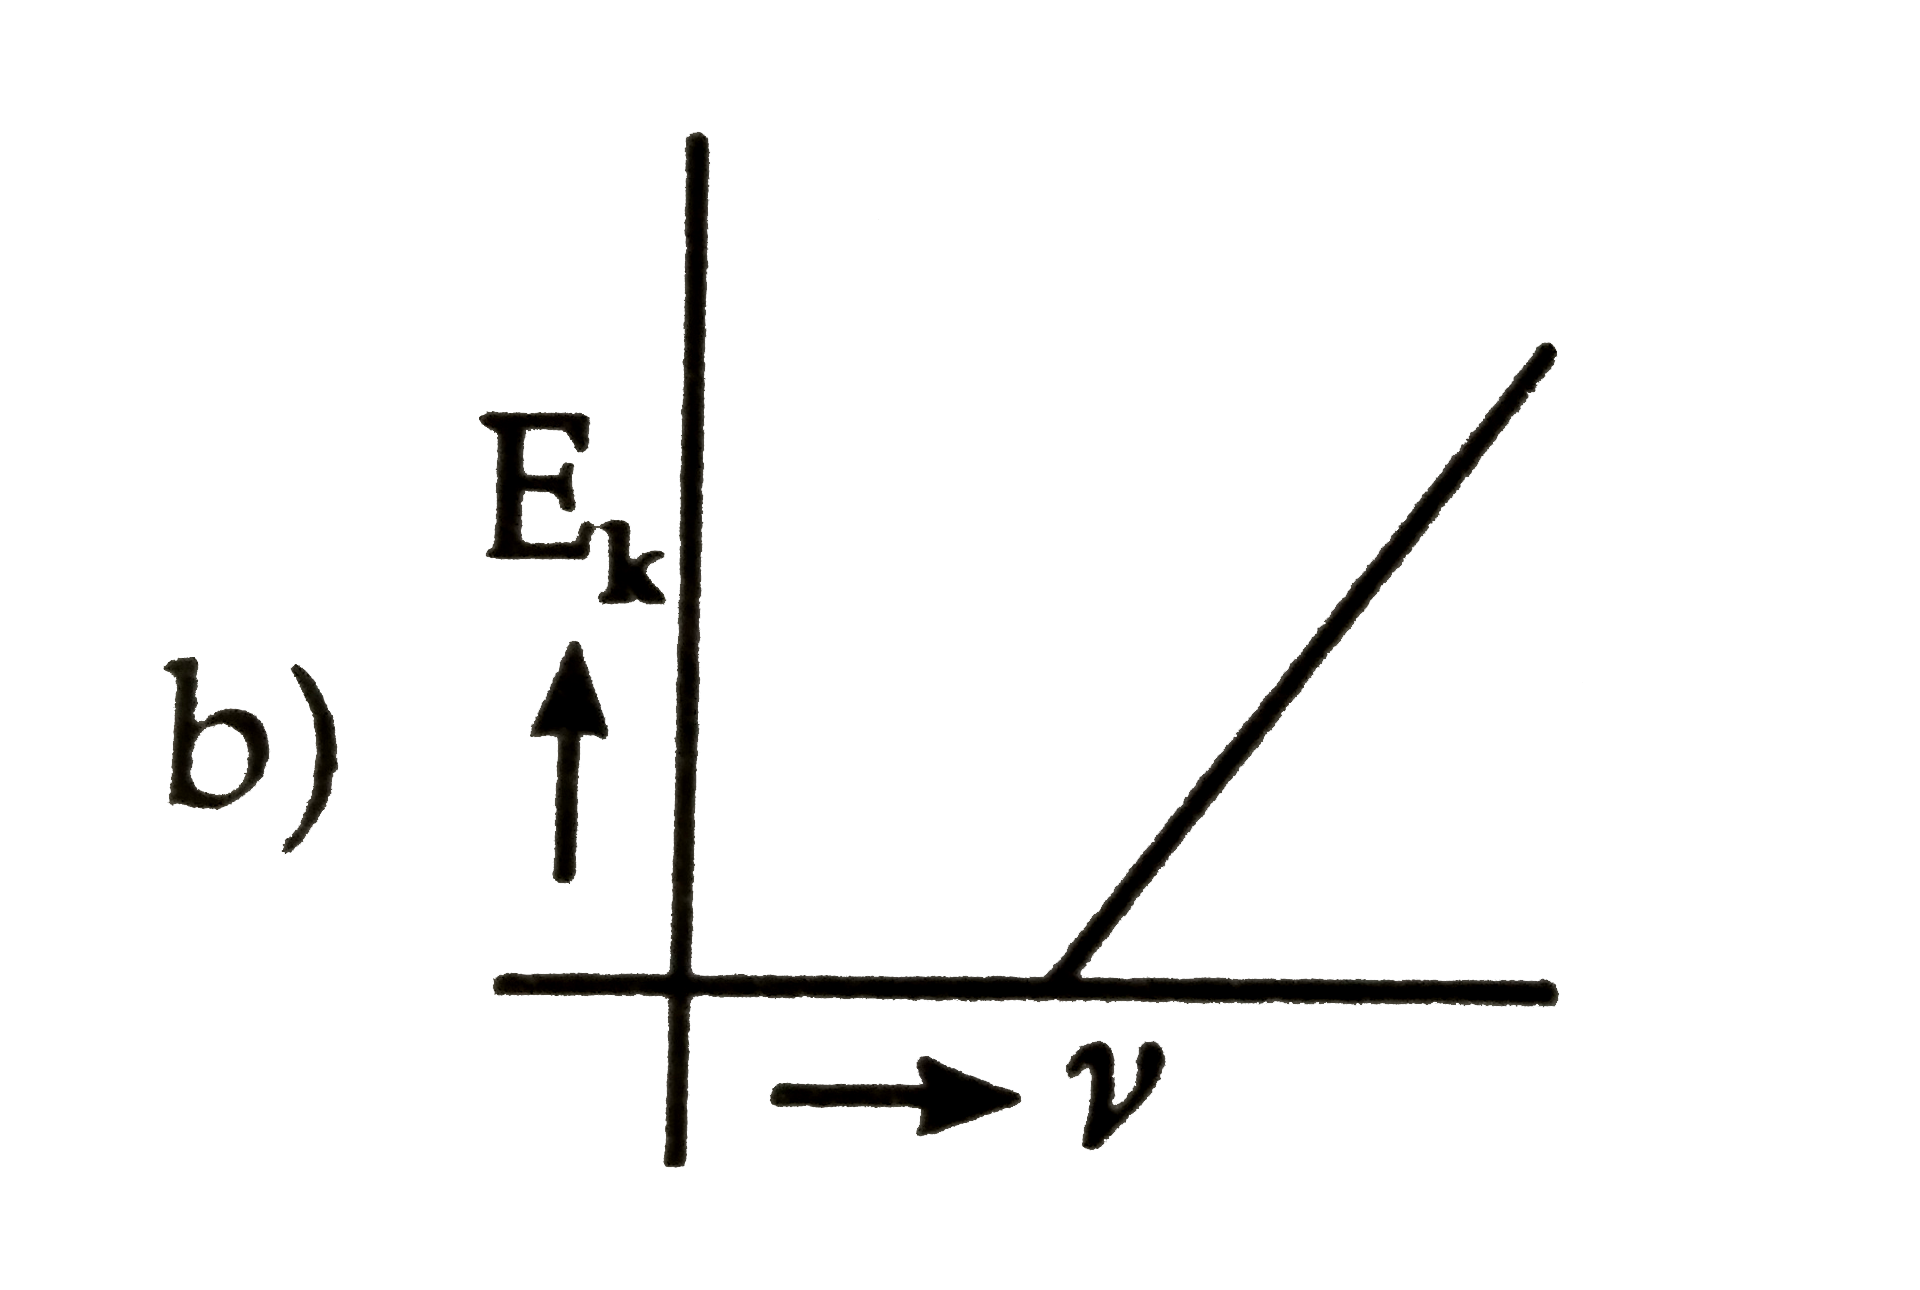 C
C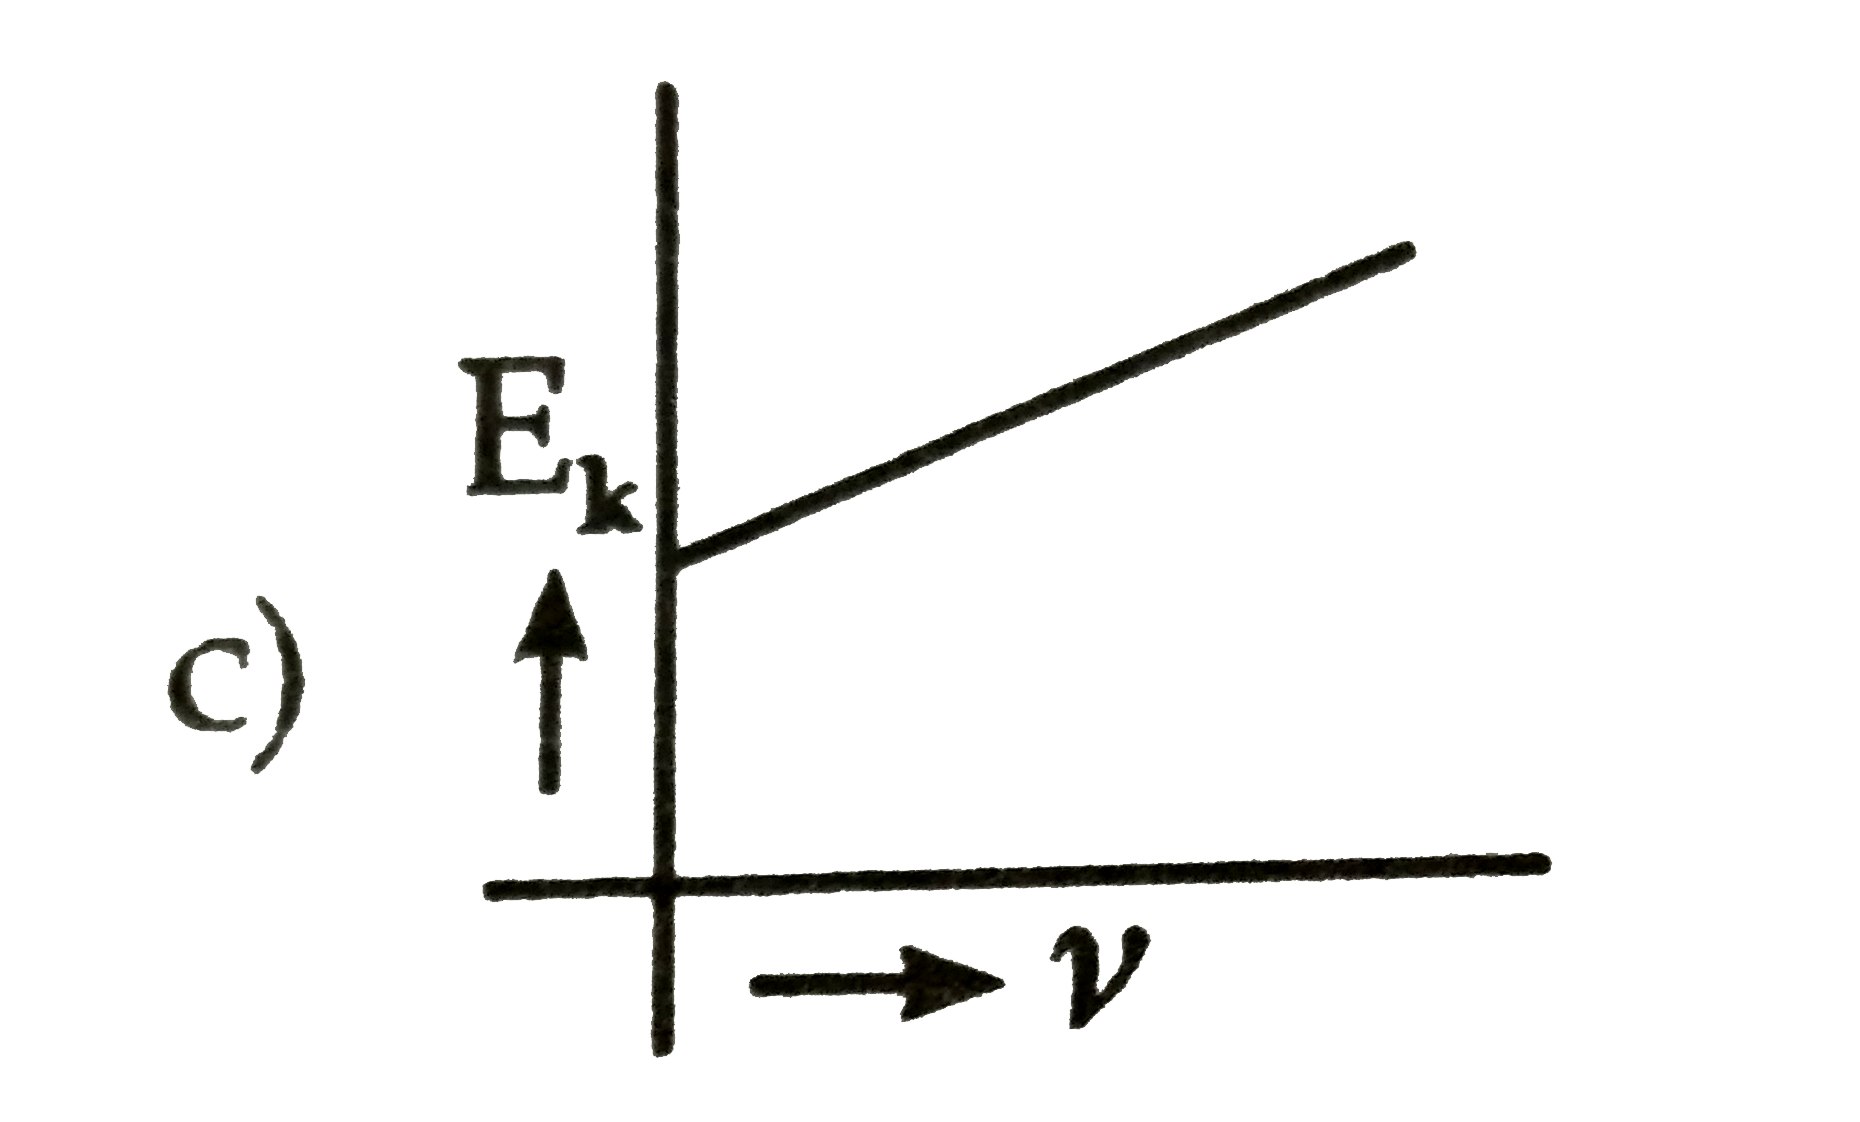 D
D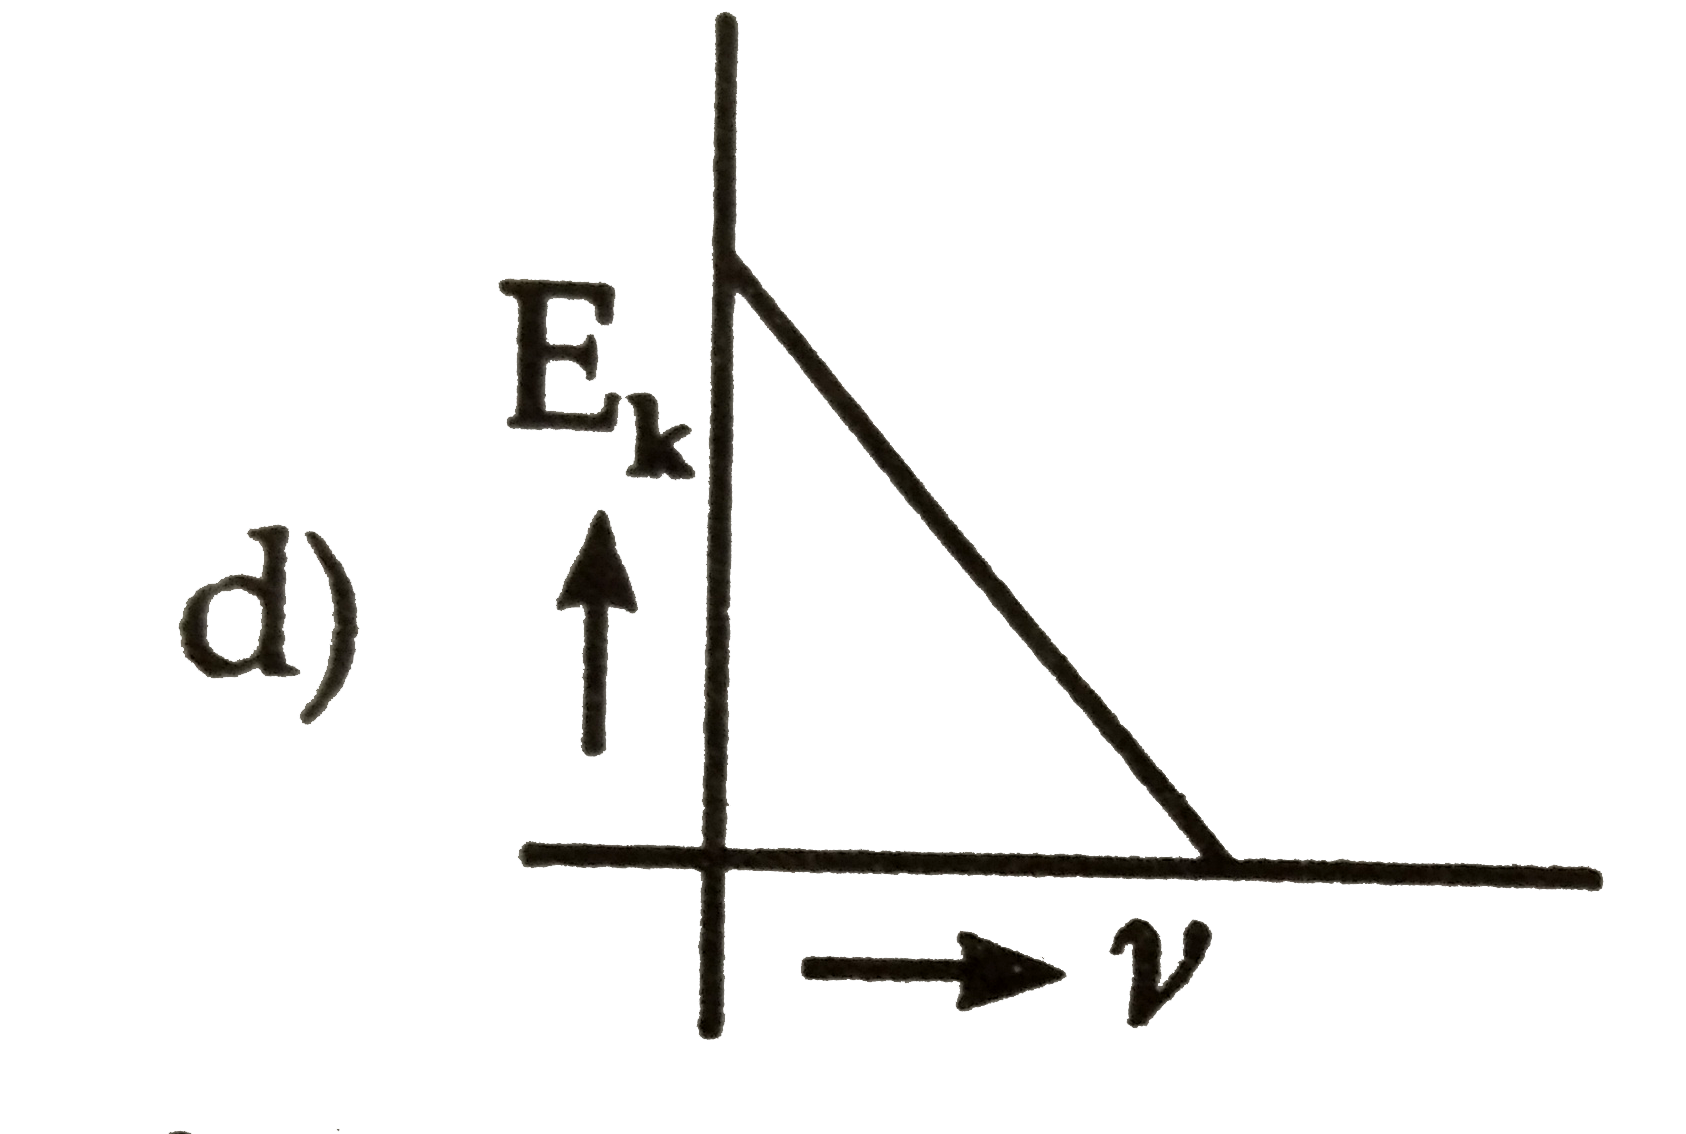
- Question 2 - Select One
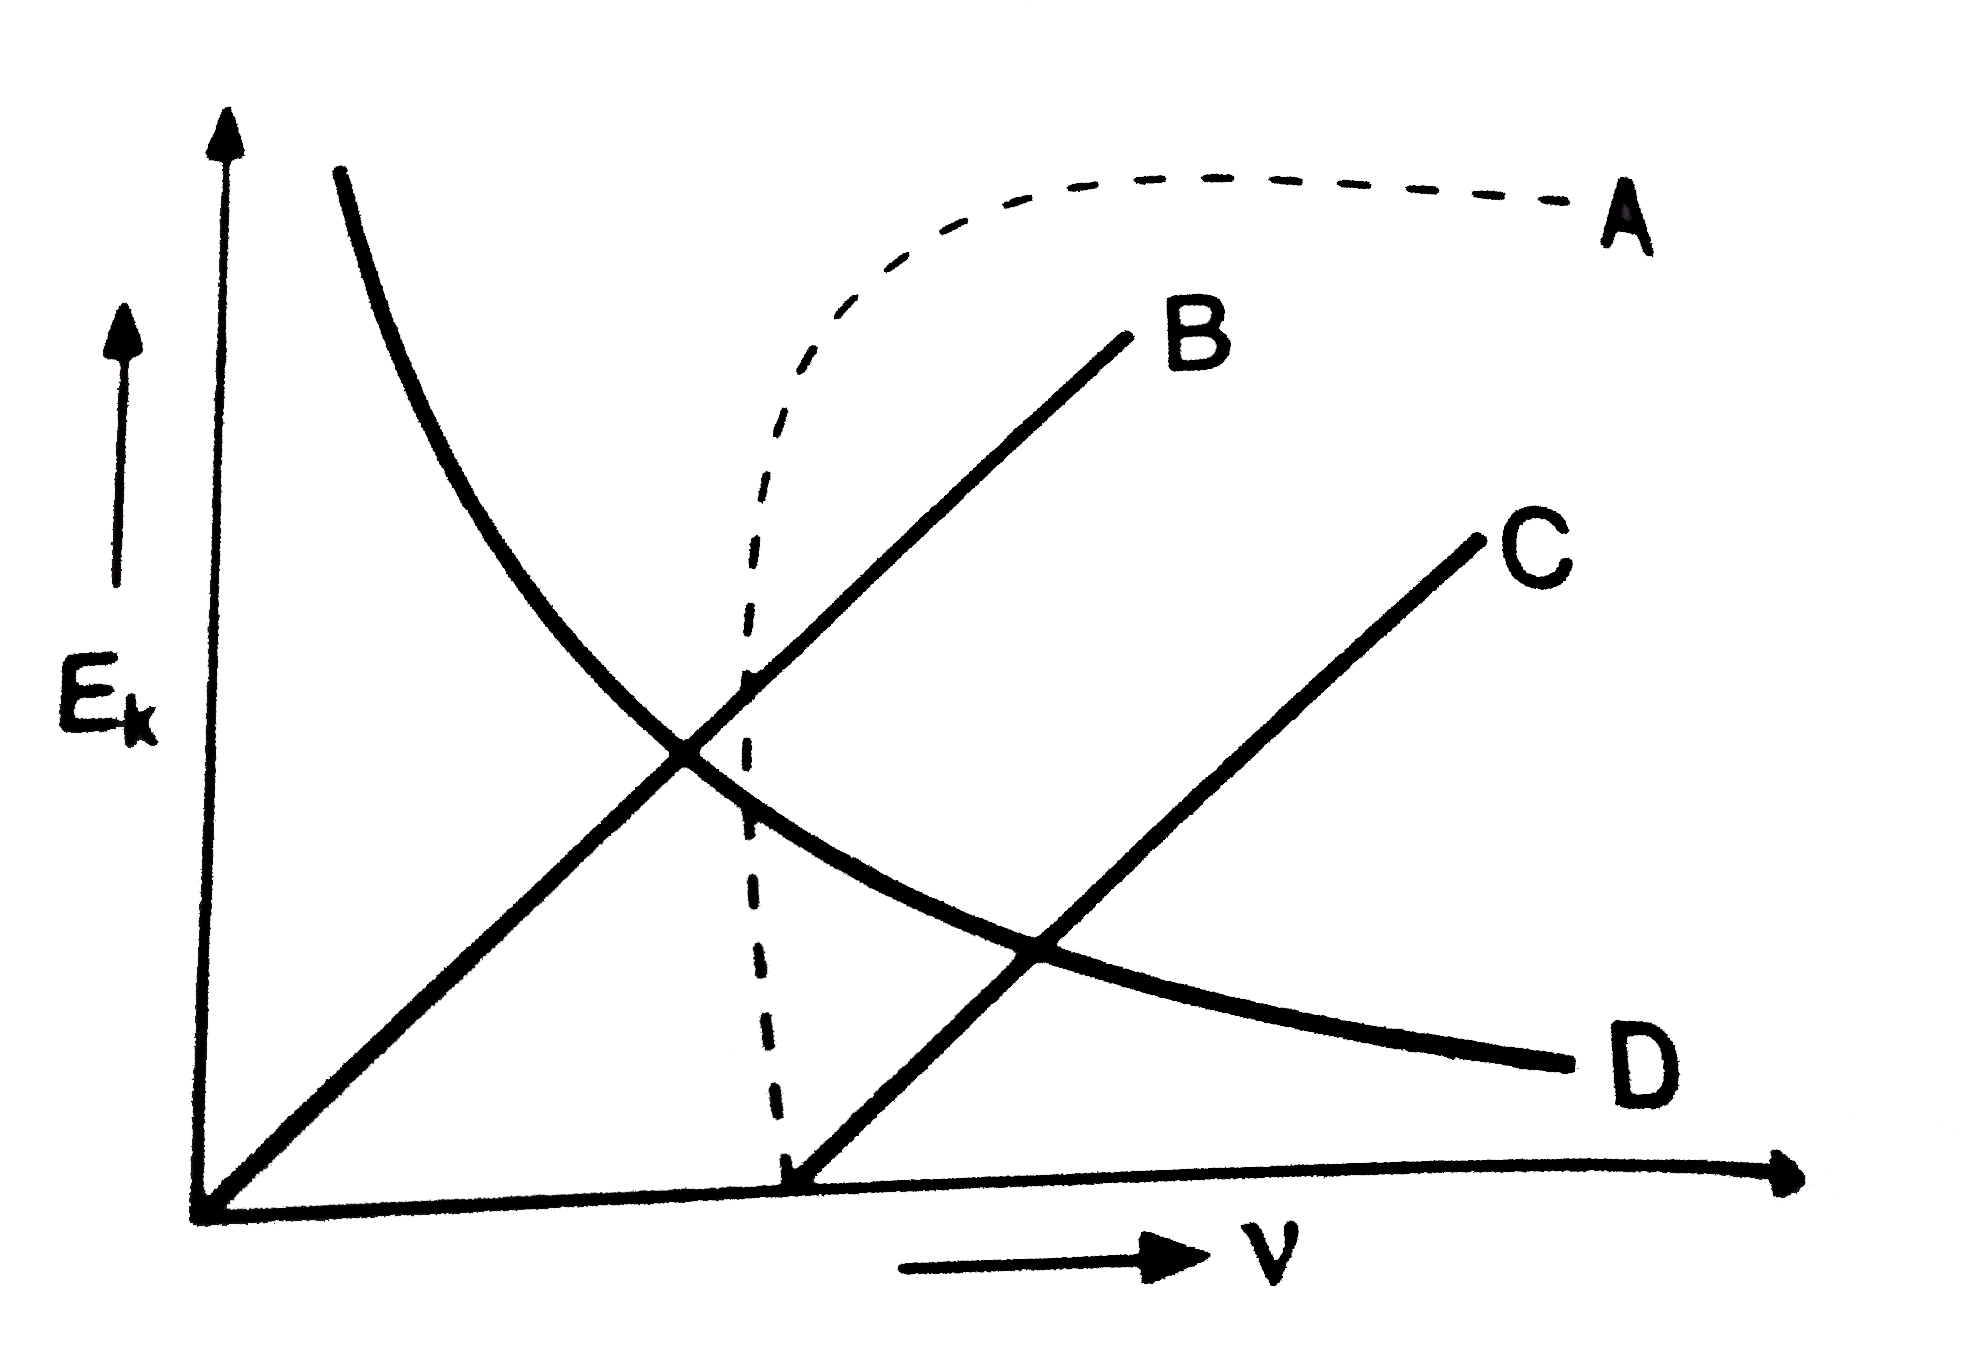
The maximu kinetic energy (Ek) of the photoelectron varies with frequency (v) of the incident light as shown by the curve:
 AABBCCDD
 - Question 3 - Select One
According to Einstein's photoelectric equation, the plot of the maximum kinetic energy of the emitted photoelectrons from a metal versus frequency of the incident radiation gives a straight line whose slope
Adepends on the nature of metal usedBdepends on the intensity or radiationCdepends on both intensity of radiation and the nature of metal usedDis the same for all metals and independent of the instensity or radiation
According to Einstein's photoelectric equation, the graph between the kinetic energy of photoelectrons ejected and the frequency of incident radiation is
View SolutionKinetic energy of electrons emitted in photoelectric effect is
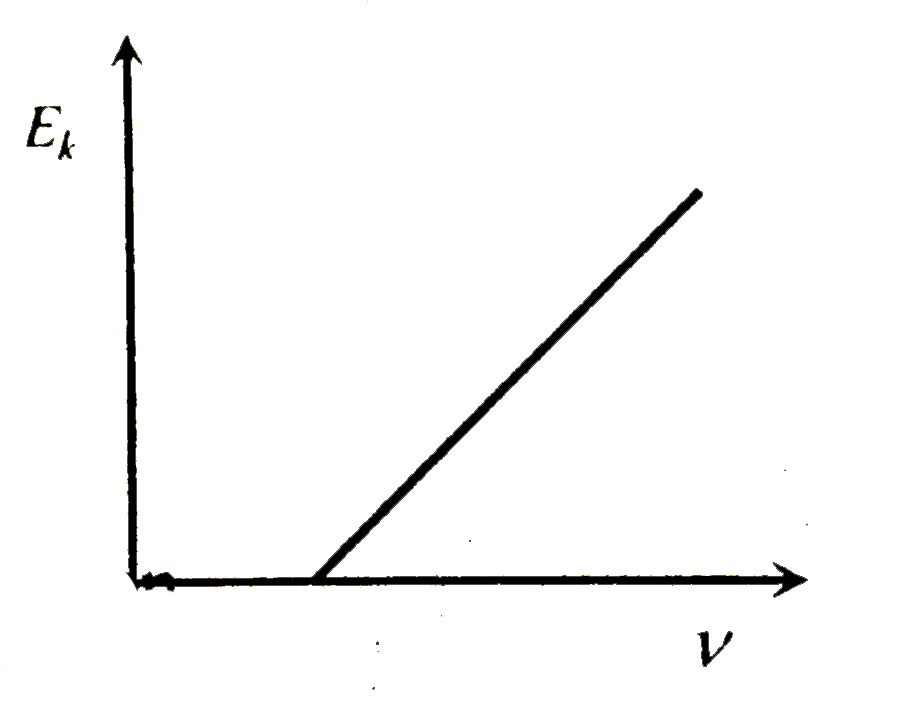
View SolutionFor the photoelectric effect, the maximum kinetic energy Ek of the emitted photoelectrons is plotted against the frequency of the incident photons as shown in the figure. The slope of the curve gives
 View Solution
The kinetic energy (Ek) of a photoelectron varies with the frequency (v) of the incident radiation as which of the following graph ?
View SolutionFor the photoelectric effect, the maximum kinetic energy Ek of the emitted photoelectrons is plotted against the frequency ν of the incident photons as shown in the figure. The slope of the curve gives
 View Solution

