Four Students W, X, Y, Z appeared in four papers I, II, III and IV in a test. Their scores out of 100 are given below :
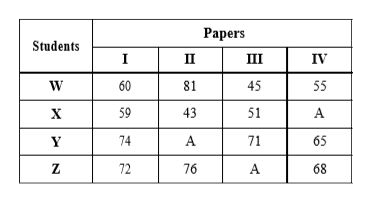
Where A stands for absent. Read the above table and answer below mentioned question
Which student has obtained the lowest average in aggregate ?
W
X
Y
Z
Step by step video & image solution for Four Students W, X, Y, Z appeared in four papers I, II, III and IV in a test. Their scores out of 100 are given below : Where A stands for absent. Read the above table and answer below mentioned question Which student has obtained the lowest average in aggregate ? by Maths experts to help you in doubts & scoring excellent marks in Class 12 exams.
Topper's Solved these Questions
- BOOK - XII BOARDS PREVIOUS YEARCHAPTER - CUET MOCK TEST SET 2EXERCISE - MULTIPLE CHOICE QUESTIONS (DATA INTERPRETATION)5videos
CUET MOCK TEST SET 2
- BOOK - XII BOARDS PREVIOUS YEARCHAPTER - CUET MOCK TEST SET 1EXERCISE - PART – B (SECTION – III MATHEMATICS )25videos
CUET MOCK TEST SET 1
- BOOK - XII BOARDS PREVIOUS YEARCHAPTER - CUET MOCK TEST SET 3EXERCISE - Part - A11videos
CUET MOCK TEST SET 3
Similar Questions
Given below is a frequency distribution table. Read it and answer the questions that follow:
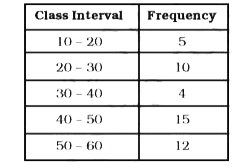
Which interval has the lowest frequency?View SolutionThe bar graph shows average marks scored in a 100 marks Science exam by student of 7 divisions of Standard X. Study the diagram and answer the following questions.
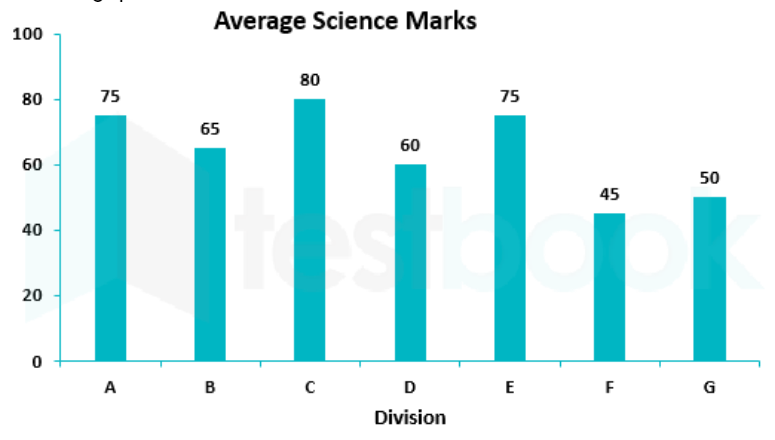
Which division scored the second lowest marks?View Solution
Knowledge Check
- Question 1 - Select One
Read the following graph and answer the questions given below
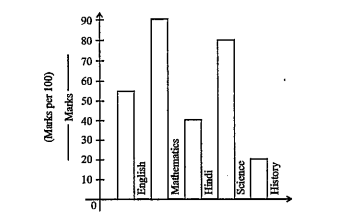
average marks obtained by the student isA57B63C80D48 - Question 2 - Select One
The bar graph shows average marks scored in a 100 mark Science exam by students of 7 divisions of Standard X. Study the diagram and answer the following questions.
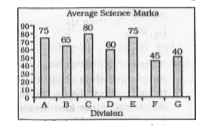
Marks of division F were lesser than that of Division C byAFBBCGDD - Question 3 - Select One
Four students, A, B, C and D, make the records given below, for the parts marked X and Y in this diagram.

The correct record, out these, is that of student:AABBCCDD
Study the following table cerafully to answer the questions given below ,

The average marks obtained by all students in Maths is :View SolutionRead the frequency distribution table given below and answer the questions that follow:
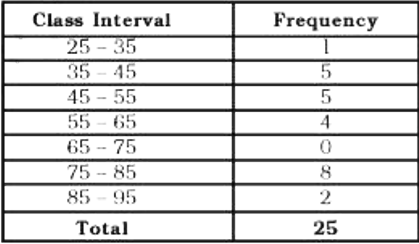
Class interval which has the lowest frequency.View SolutionThe bar graph shows average marks scored in a 100 marks History exam by students of 7 divisions of Standard x. Study the diagram and answer the following questions.
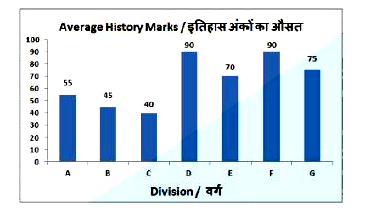
Which division scored the second lowest marks ?View SolutionThe following column represents the marks obtained by five students in three different subjects out of 50 marks in each subjects. Study the column carefully and answer the question given below.
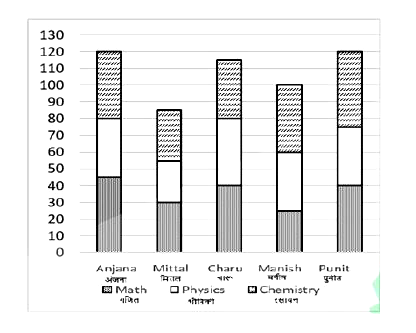
Which students got minimum marks in Math?View SolutionThe following column represents the marks obtained by five students in three different subjects out of 50 marks in each subjects. Study the column carefully and answer the question given below.
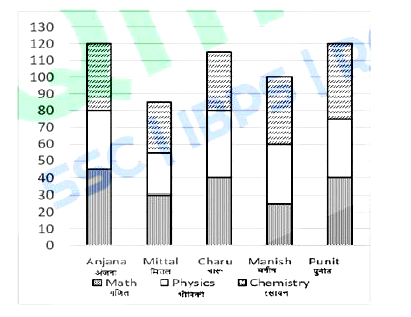
Which student got maximum marks in Physics?View Solution

