Which of the following graph best represents the kinetic energy (K.E) of a freely falling body and its height h above the ground?


The correct Answer is:A
mgh=K+mgh.
⇒h.=h−Kmg
Topper's Solved these Questions
- WORK AND ENERGYBOOK - MTG IIT JEE FOUNDATIONCHAPTER - WORK AND ENERGYEXERCISE - Exercise (Comprehension Type)
5 Videos
- WORK AND ENERGYBOOK - MTG IIT JEE FOUNDATIONCHAPTER - WORK AND ENERGYEXERCISE - Exercise (Subjective Problems Very short Answer Type)
16 Videos
- WORK AND ENERGYBOOK - MTG IIT JEE FOUNDATIONCHAPTER - WORK AND ENERGYEXERCISE - Exercise (Multiple Choice Questions Level -1)
30 Videos
- THRUST AND PRESSUREBOOK - MTG IIT JEE FOUNDATIONCHAPTER - THRUST AND PRESSUREEXERCISE - Olympiad/HOTS Corner
15 Videos
Similar Questions
Which of the following graph is correct between kinetic energy E, potential energy (U) and height (h) from the ground of the partical
View SolutionA body moves from rest with a constant acceleration. Which one of the following graphs represents the variation of its kinetic energy K with the distance travelled x?
View Solution
Knowledge Check
Which of the following graph is correct between kinetic energy E, potential energy (U) and height (h) from the ground of the partical
A B
B C
C D
D
Which of the following graph is correct between kinetic energy E, potential energy (U) and height (h) from the ground of the partical
A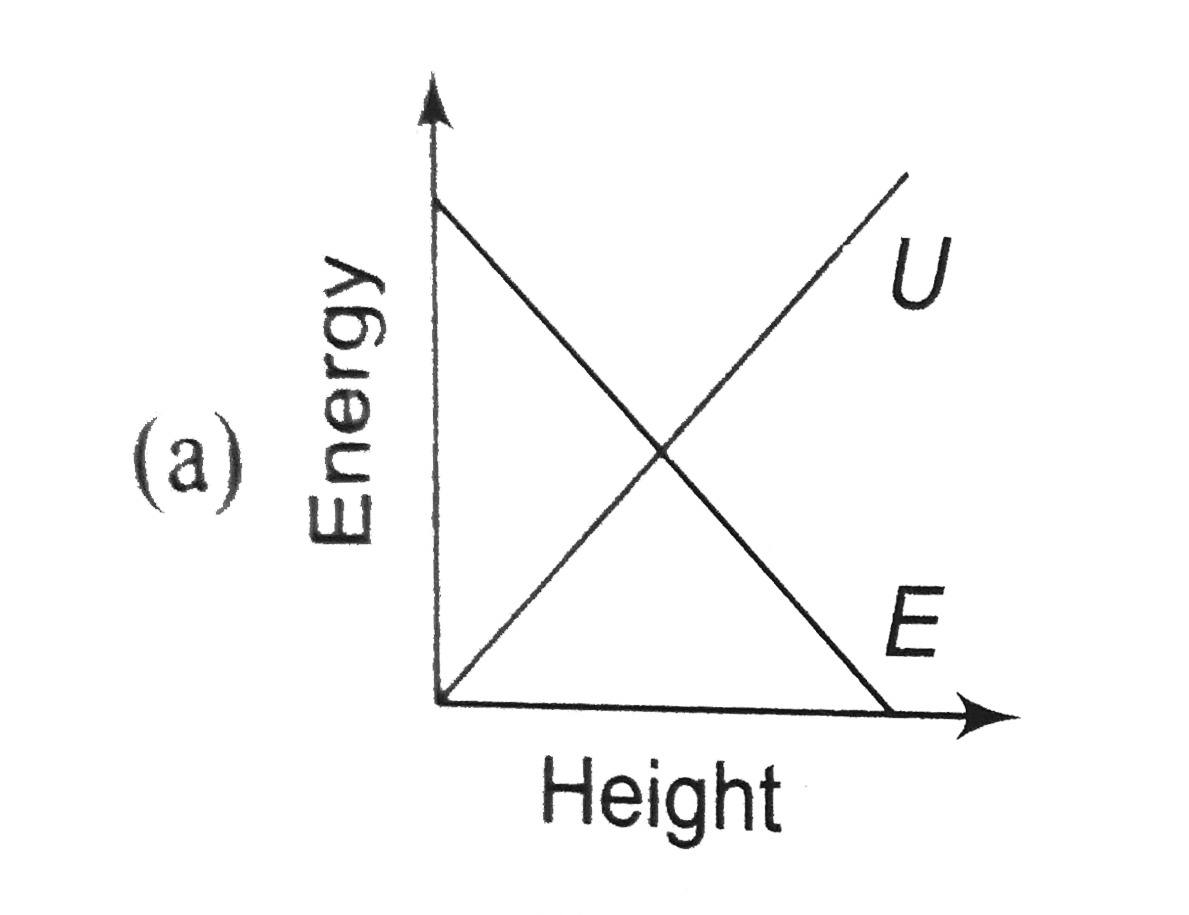 B
B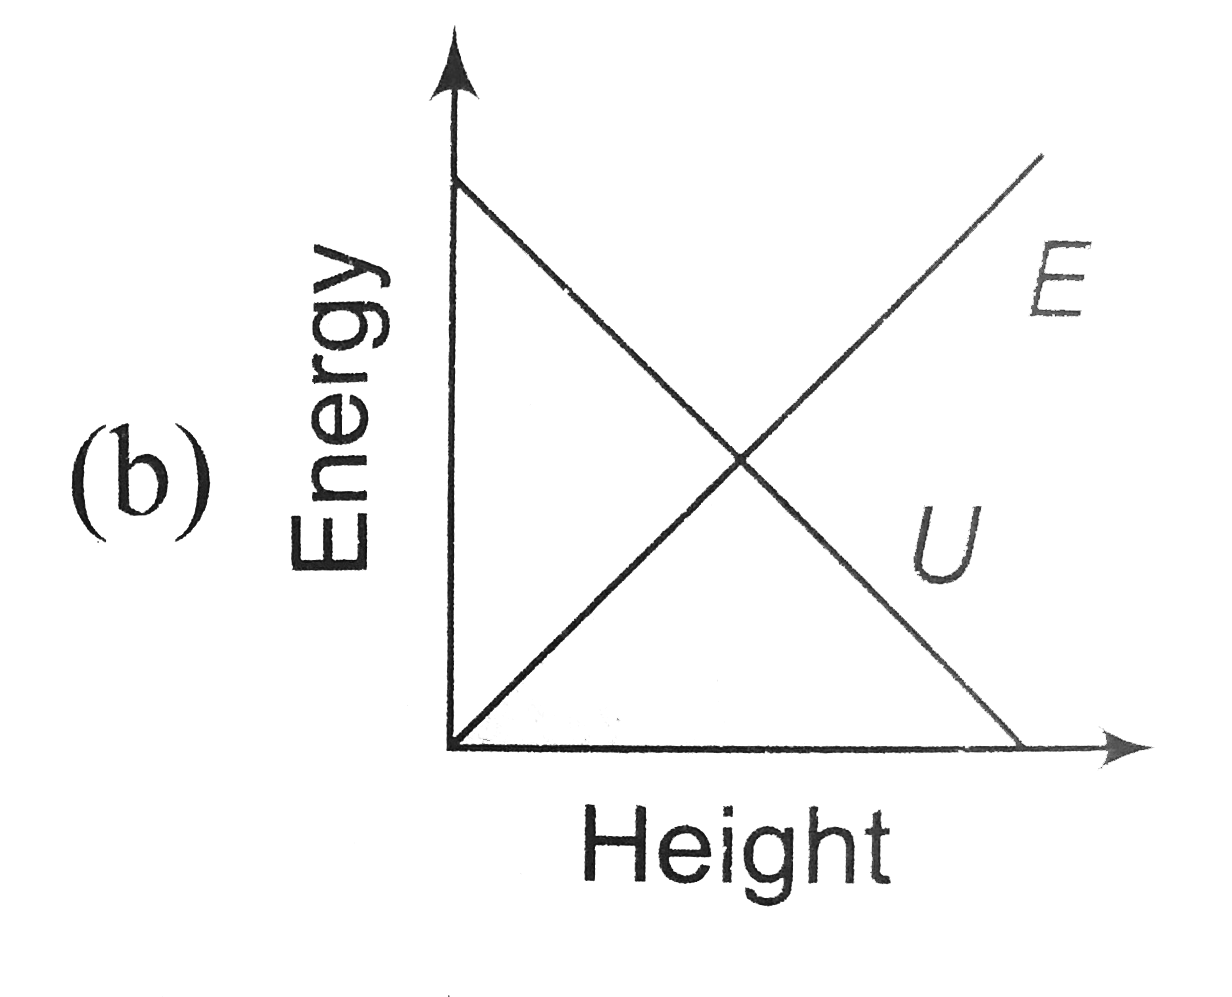 C
C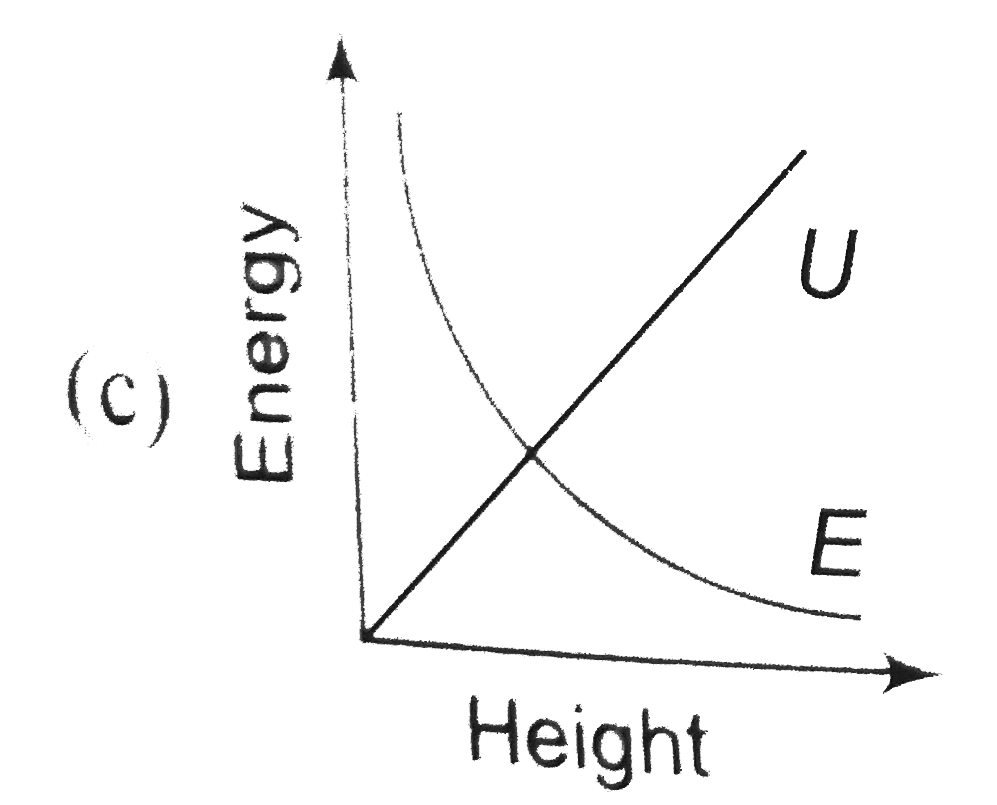 D
D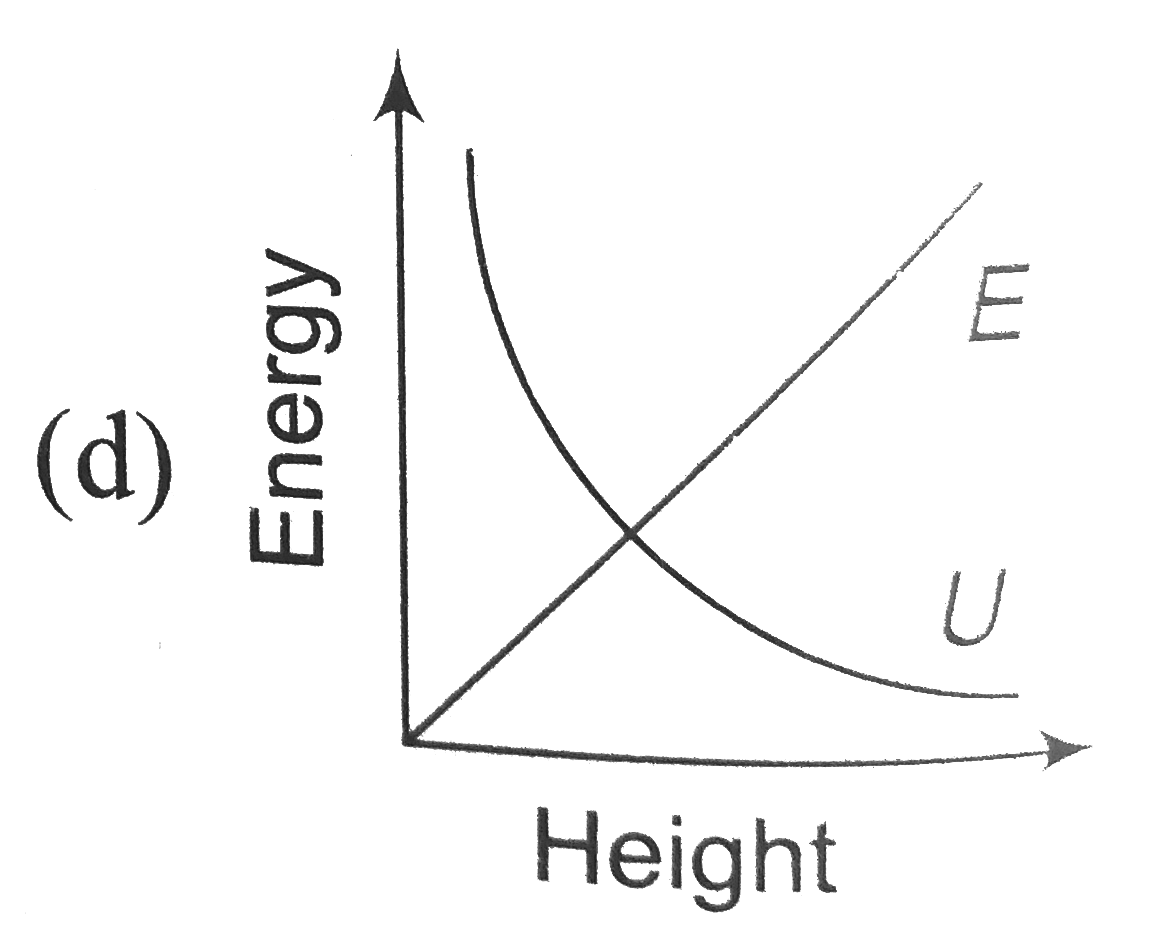
A body moves from rest with a constant ac- celeration. Which of the following graphs represents the variation of its kinetic energy (E) with distance travelled (x)?
A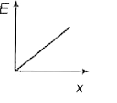 B
B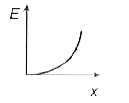 C
C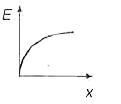 D
D
A body moves from rest with a constant acceleration. Which one of the following graphs represents the variation of its kinetic energy K with the distance travelled x?
View SolutionWhich of the following graph best represents the relationship between absolute temperature of gas and the average kinetic energy of the gas molecules?
View SolutionWhich of the following graphs represents the graphical relation between momentum (p) and kinetic energy (K) for a body in motion?
View SolutionA body moves from rest with a constant acceleration. Which one of the following graphs represents the variation of its kinetic energy K with the distance travelled x?
View SolutionA body moves from rest with a constant acceleration. Which one of the following graphs represents the variation of its kinetic energy K with the distance travelled x?
View Solution
