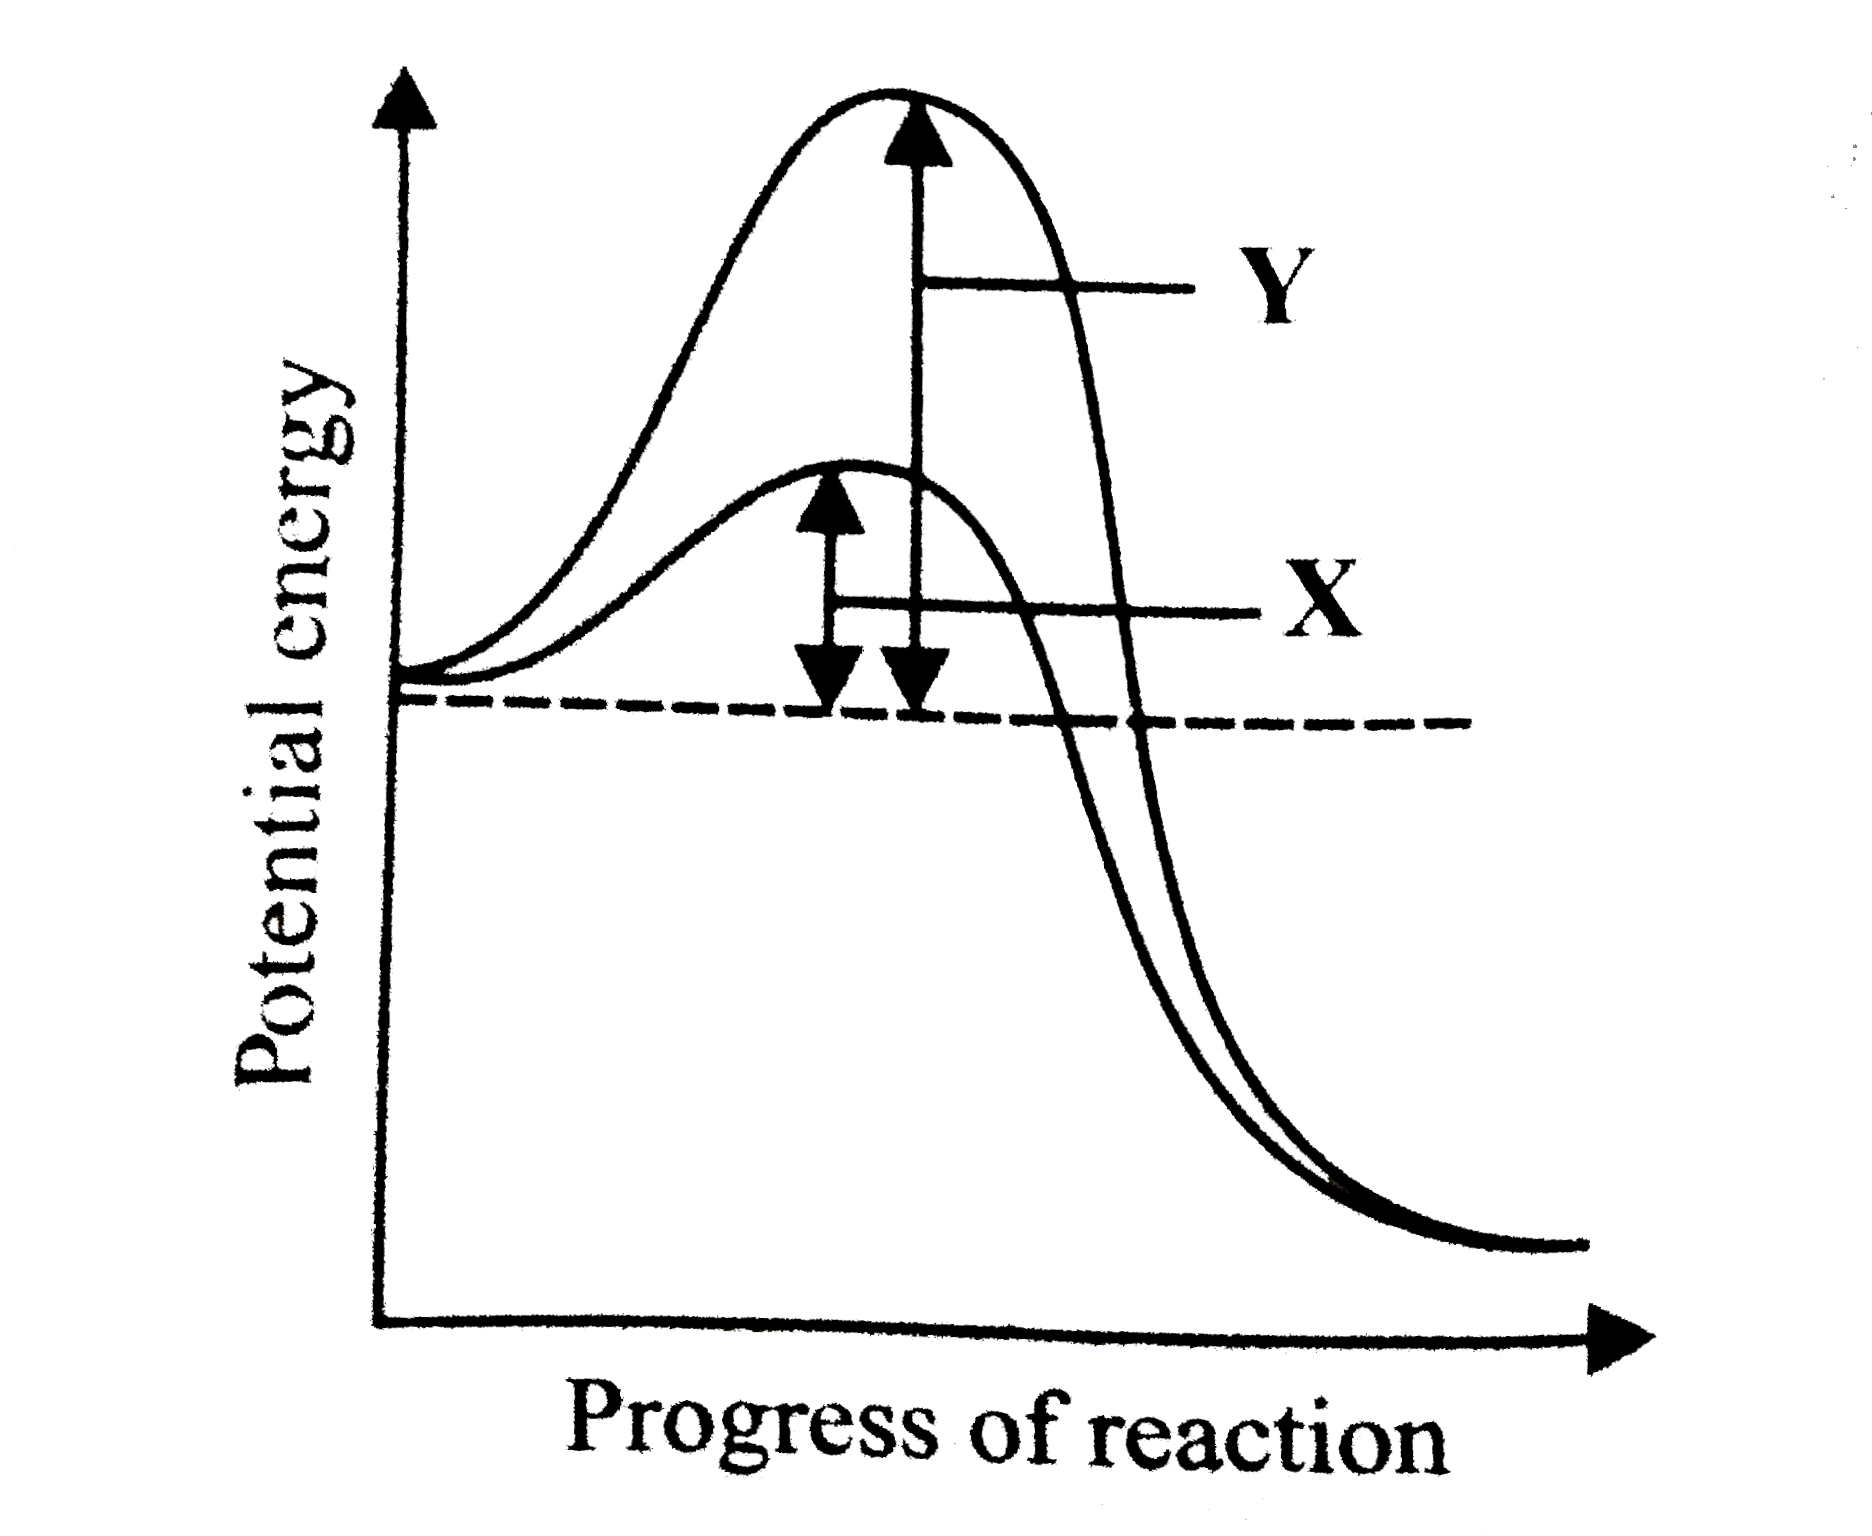
The given graph depicts two different methods of disposal of biodegradable solid wastes.
What can be inferred from the given graph ?

Waste disposed through process X can be used for vermicomposting.
Some non-biodegradable wastes like used syringes, urine bags, etc., can also be disposed off by process Y.
X may be safe and pollution free whereas Y may generate some gaseous wastes.
All of these
The correct Answer is:D
According to the given graph, process X is composting and process Y is incineration.
Topper's Solved these Questions
- GARBAGE IN , GARBAGE OUT BOOK - MTG IIT JEE FOUNDATIONCHAPTER - GARBAGE IN , GARBAGE OUT EXERCISE - Exercise (Subjective Questions) Long Answer Type
4 Videos
- FOOD : WHERE DOES IT COME FROM?BOOK - MTG IIT JEE FOUNDATIONCHAPTER - FOOD : WHERE DOES IT COME FROM?EXERCISE - OLYMPIAD/HOTS CORNER
5 Videos
- GETTING TO KNOW PLANTS BOOK - MTG IIT JEE FOUNDATIONCHAPTER - GETTING TO KNOW PLANTS EXERCISE - OLYMPIAD/HOTS CORNER
15 Videos
Similar Questions
Knowledge Check
What is denoted by and Y in the given graph ?
 A X YActivation energy without enzymeActivation energy with enzymeB X YActivation energy with enzymeActivation energy without enzymeC X YSubstrate concentration with enzymeSubstrate concentration without enzymeD X YSubstrate concentration without enzymeSubstrate concentration with enzyme
Which of the following is the best method to dispose of biological wastes from hospitals ?
AlandfillBrecyclingCincinerationDcompostingThe municipal solid waste generated in India is about 40% organic matter .Composting is the best method of disposal of organic solid waste .Where was the country 's first aerobic composting plant set up in 1992 ?
ADelhiBMumbaiCCalcuttaDChennai
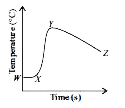
Excess of sodium hydroxide pellets are added to dilute hydrochloric acid and the temperature change of the mixture was measured over a period of time. The given graph shows the temperature change Time (s) with time.
What can be inferred from the graph?

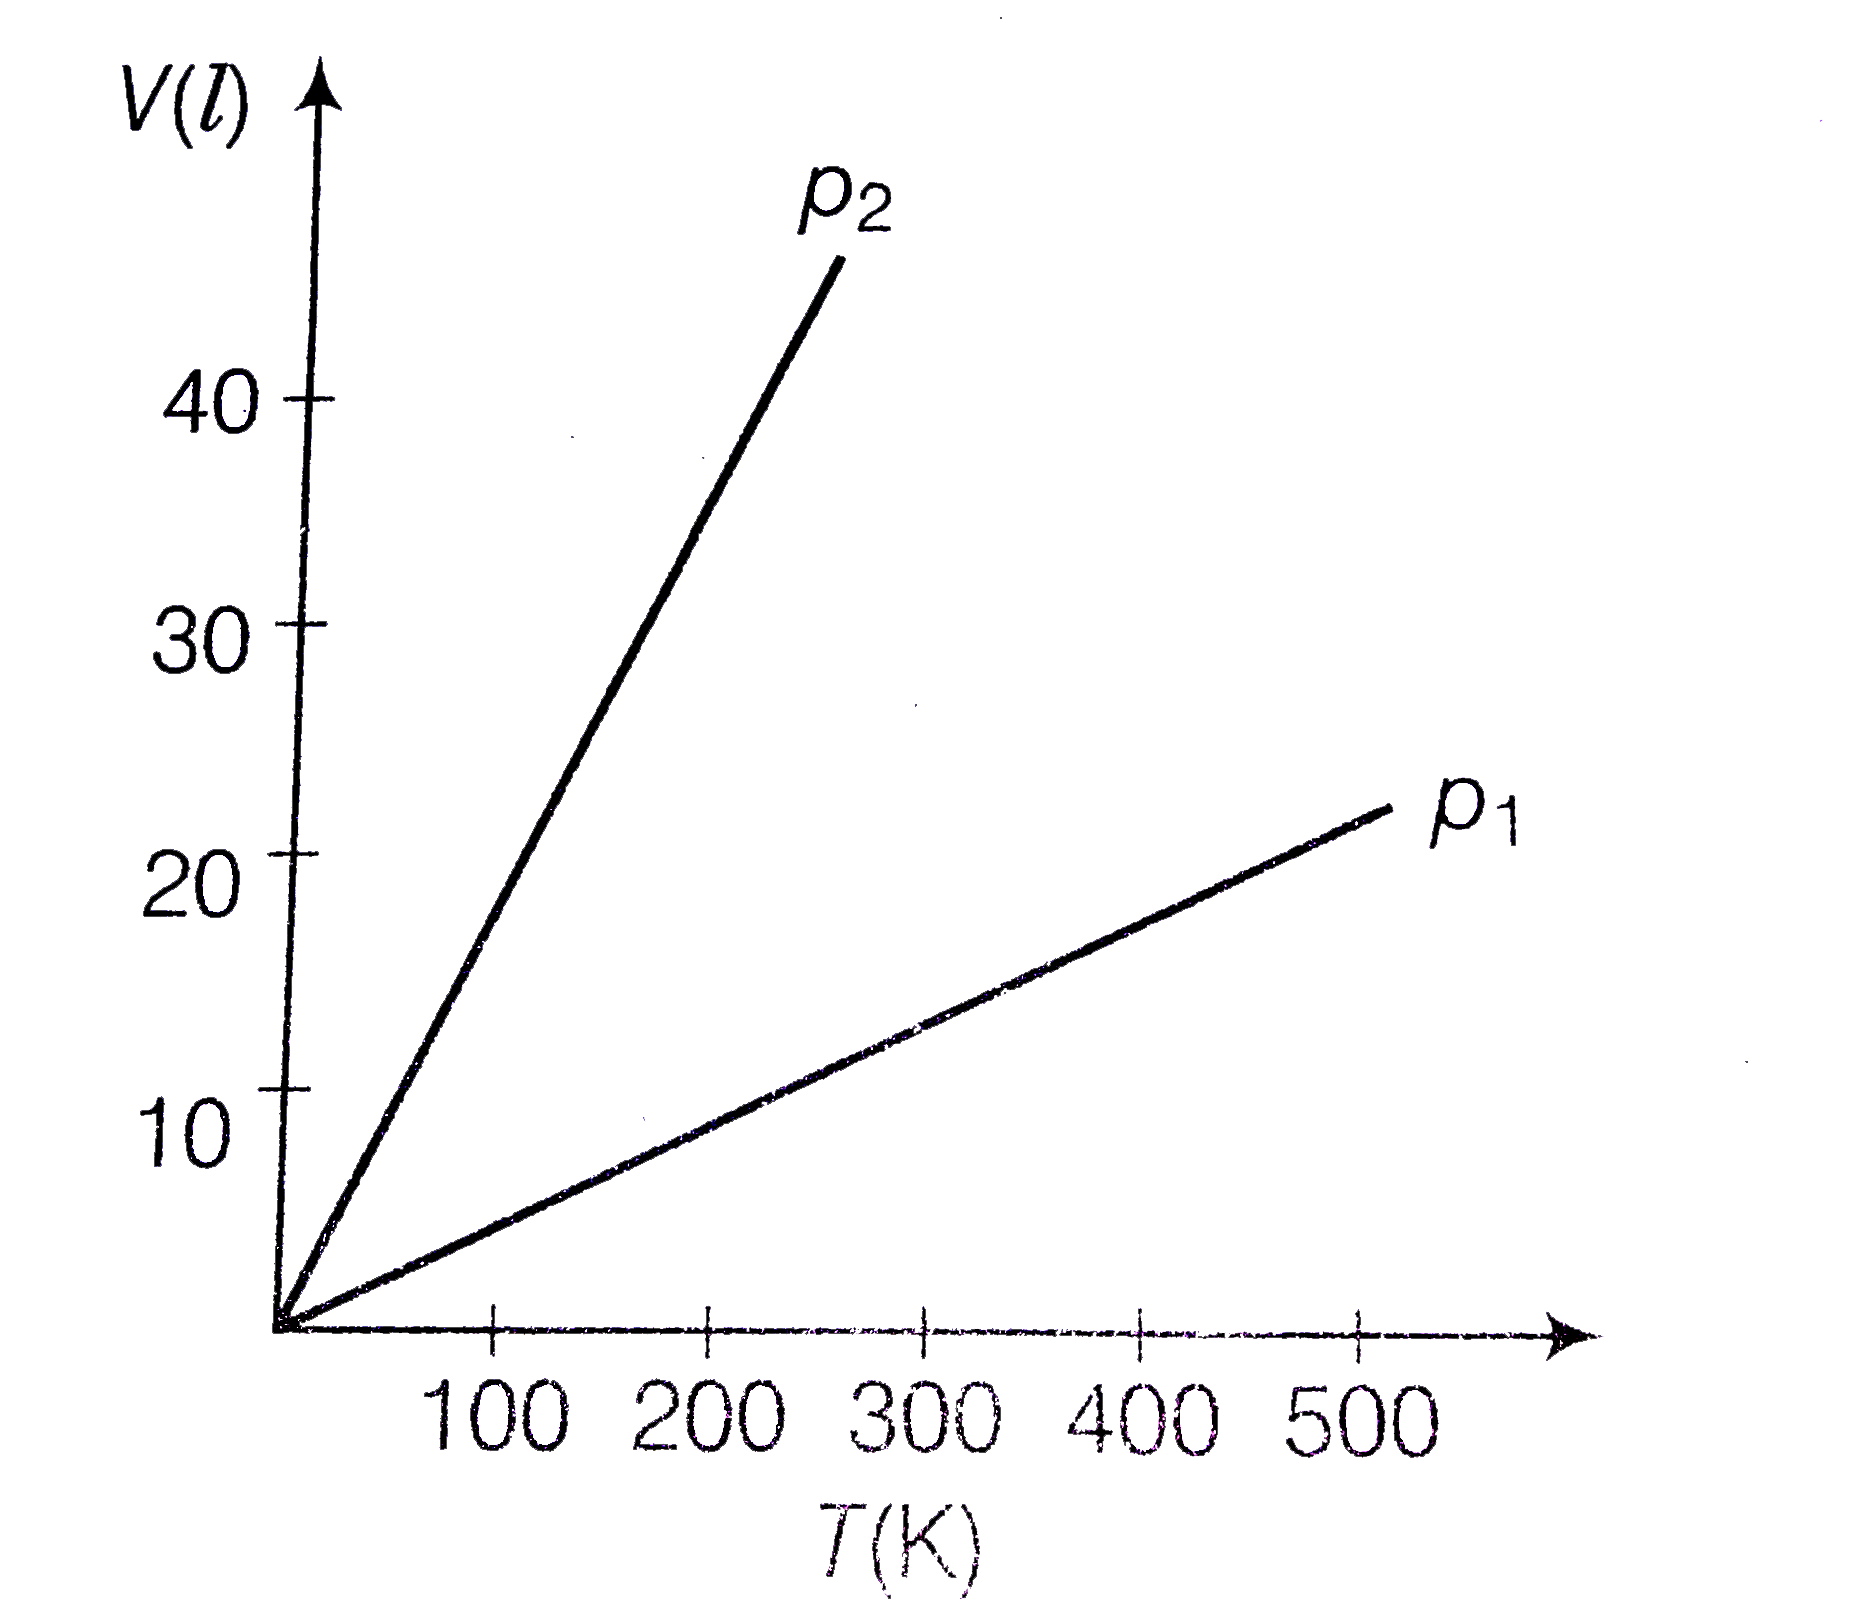
View SolutionVolume versus temperature graphs for a given mass of an ideal gas are shown in figure. At two different values of constant pressure. What can be inferred about relation between P1 and P2 ?

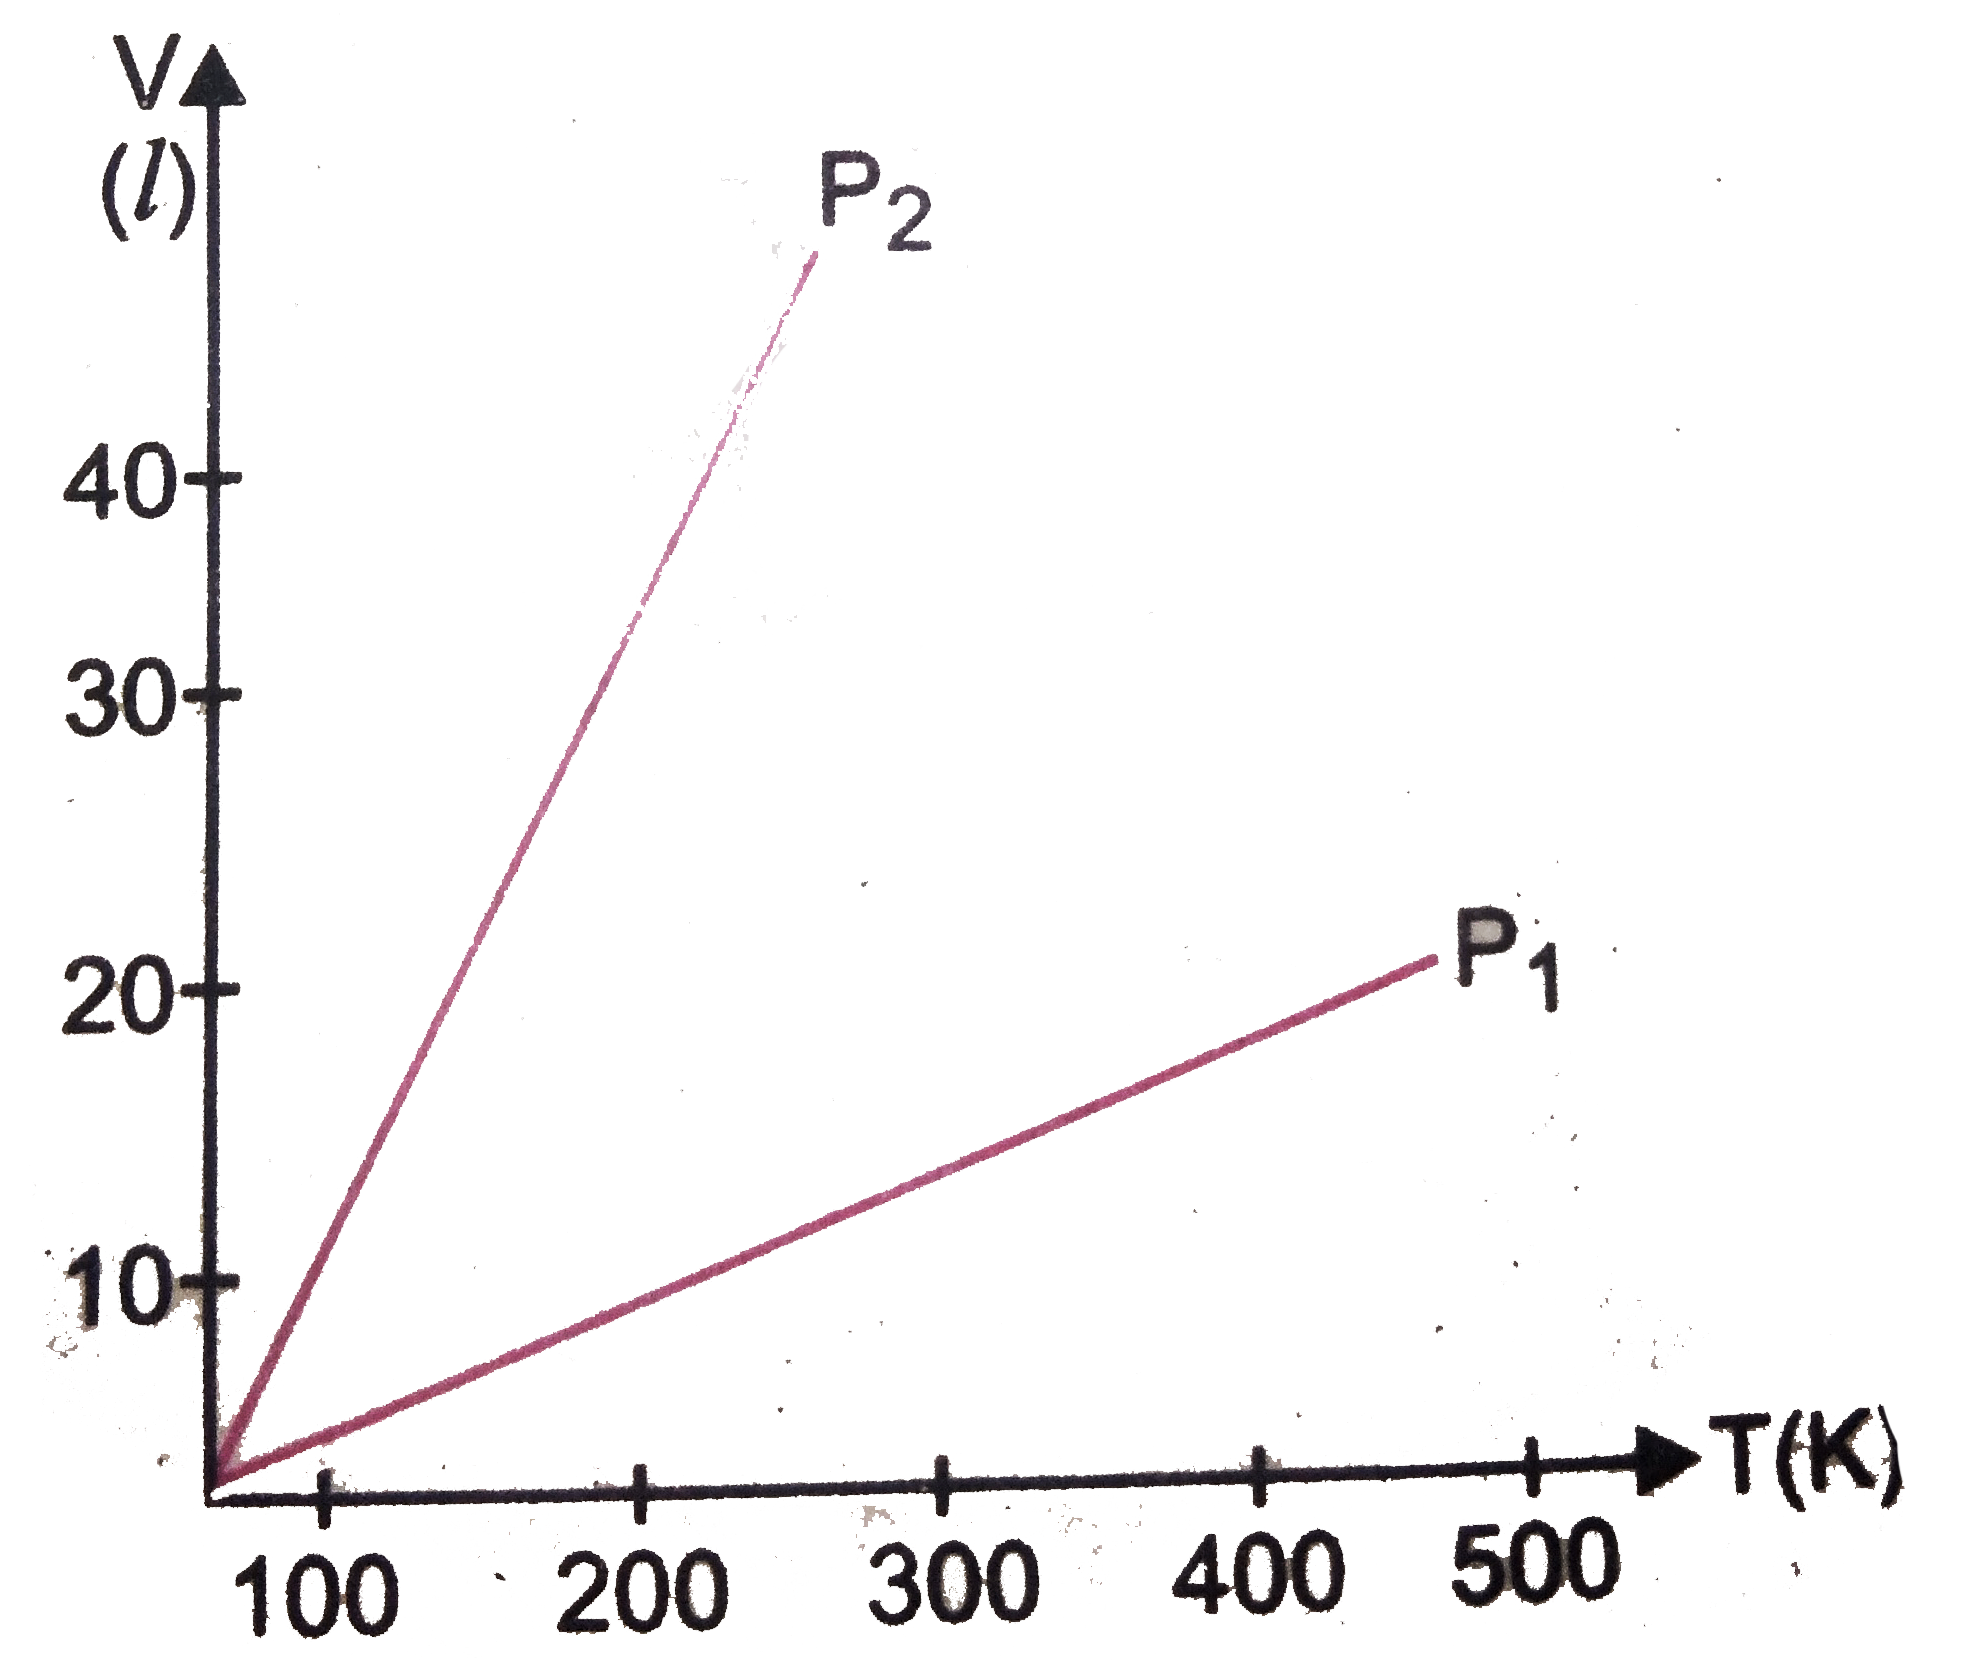
View SolutionVolume versus temperature graphs for a given mass of an ideal gas are shown in figure. At two different values of constant pressure. What can be inferred about relation between P1 and P2 ?

View SolutionVolume versus temperature graphs for a given mass of an ideal gas are shown in Fig. at two different values of constant pressure. What can be inferred about relation between P1andP2?

View SolutionVolume versus temperature graphs for a given mass of an ideal gas are shown in figure. At two different values of constant pressure. What can be inferred about relation between P1 and P2 ?

View Solution
