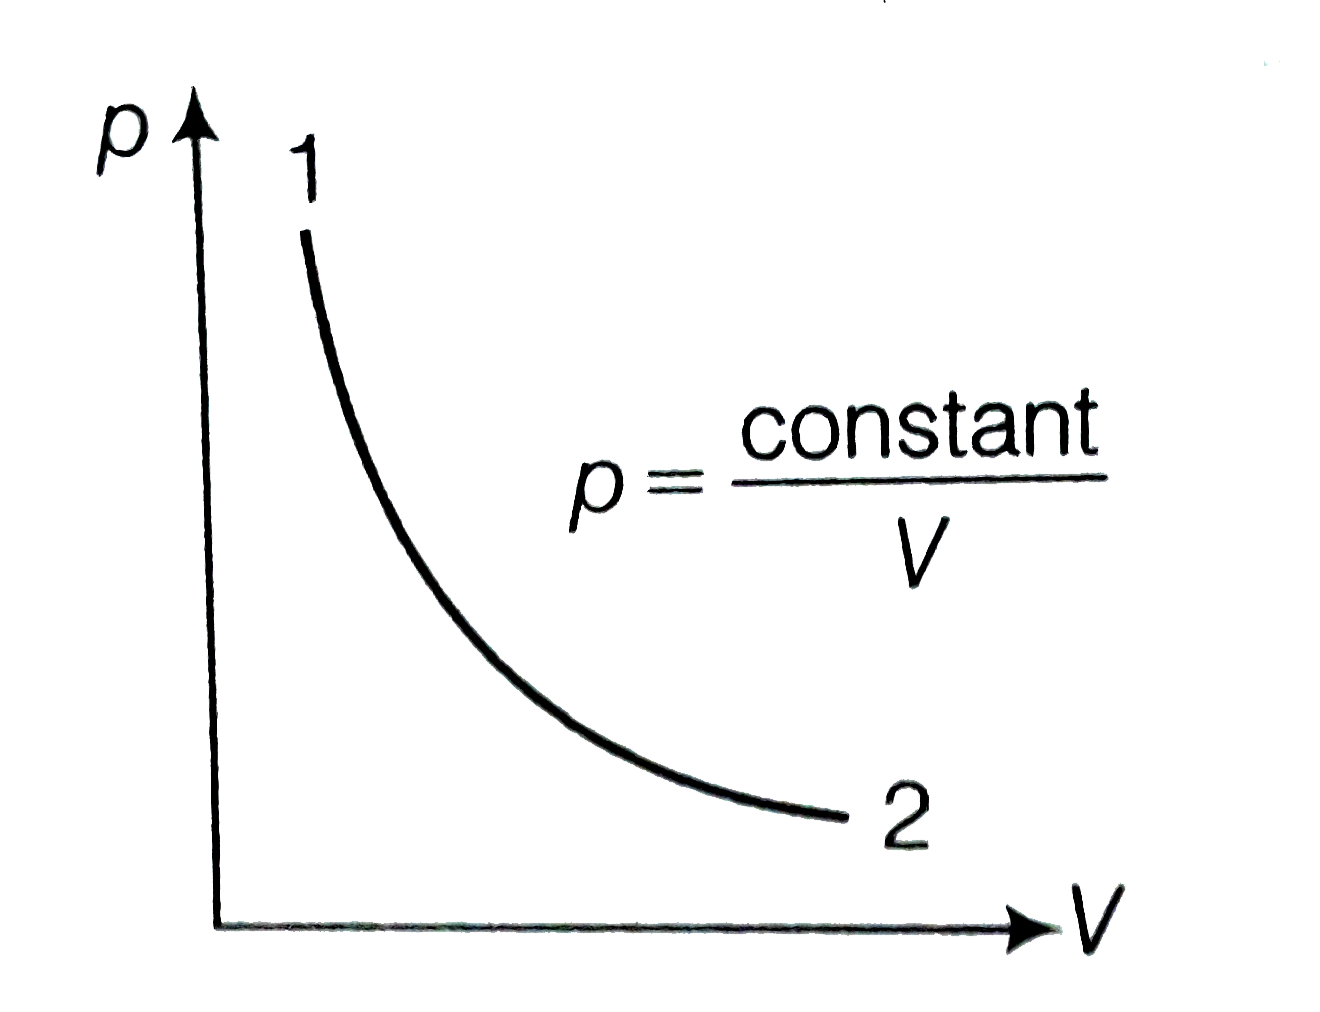
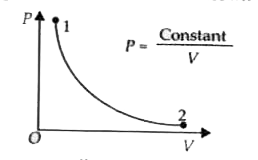
Consider p-V diagram for an ideal gas shown in figure.
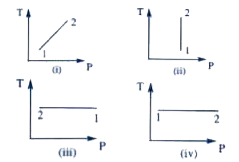
Out of the following diagrams, which figure represents the T−p diagram ?
(i) 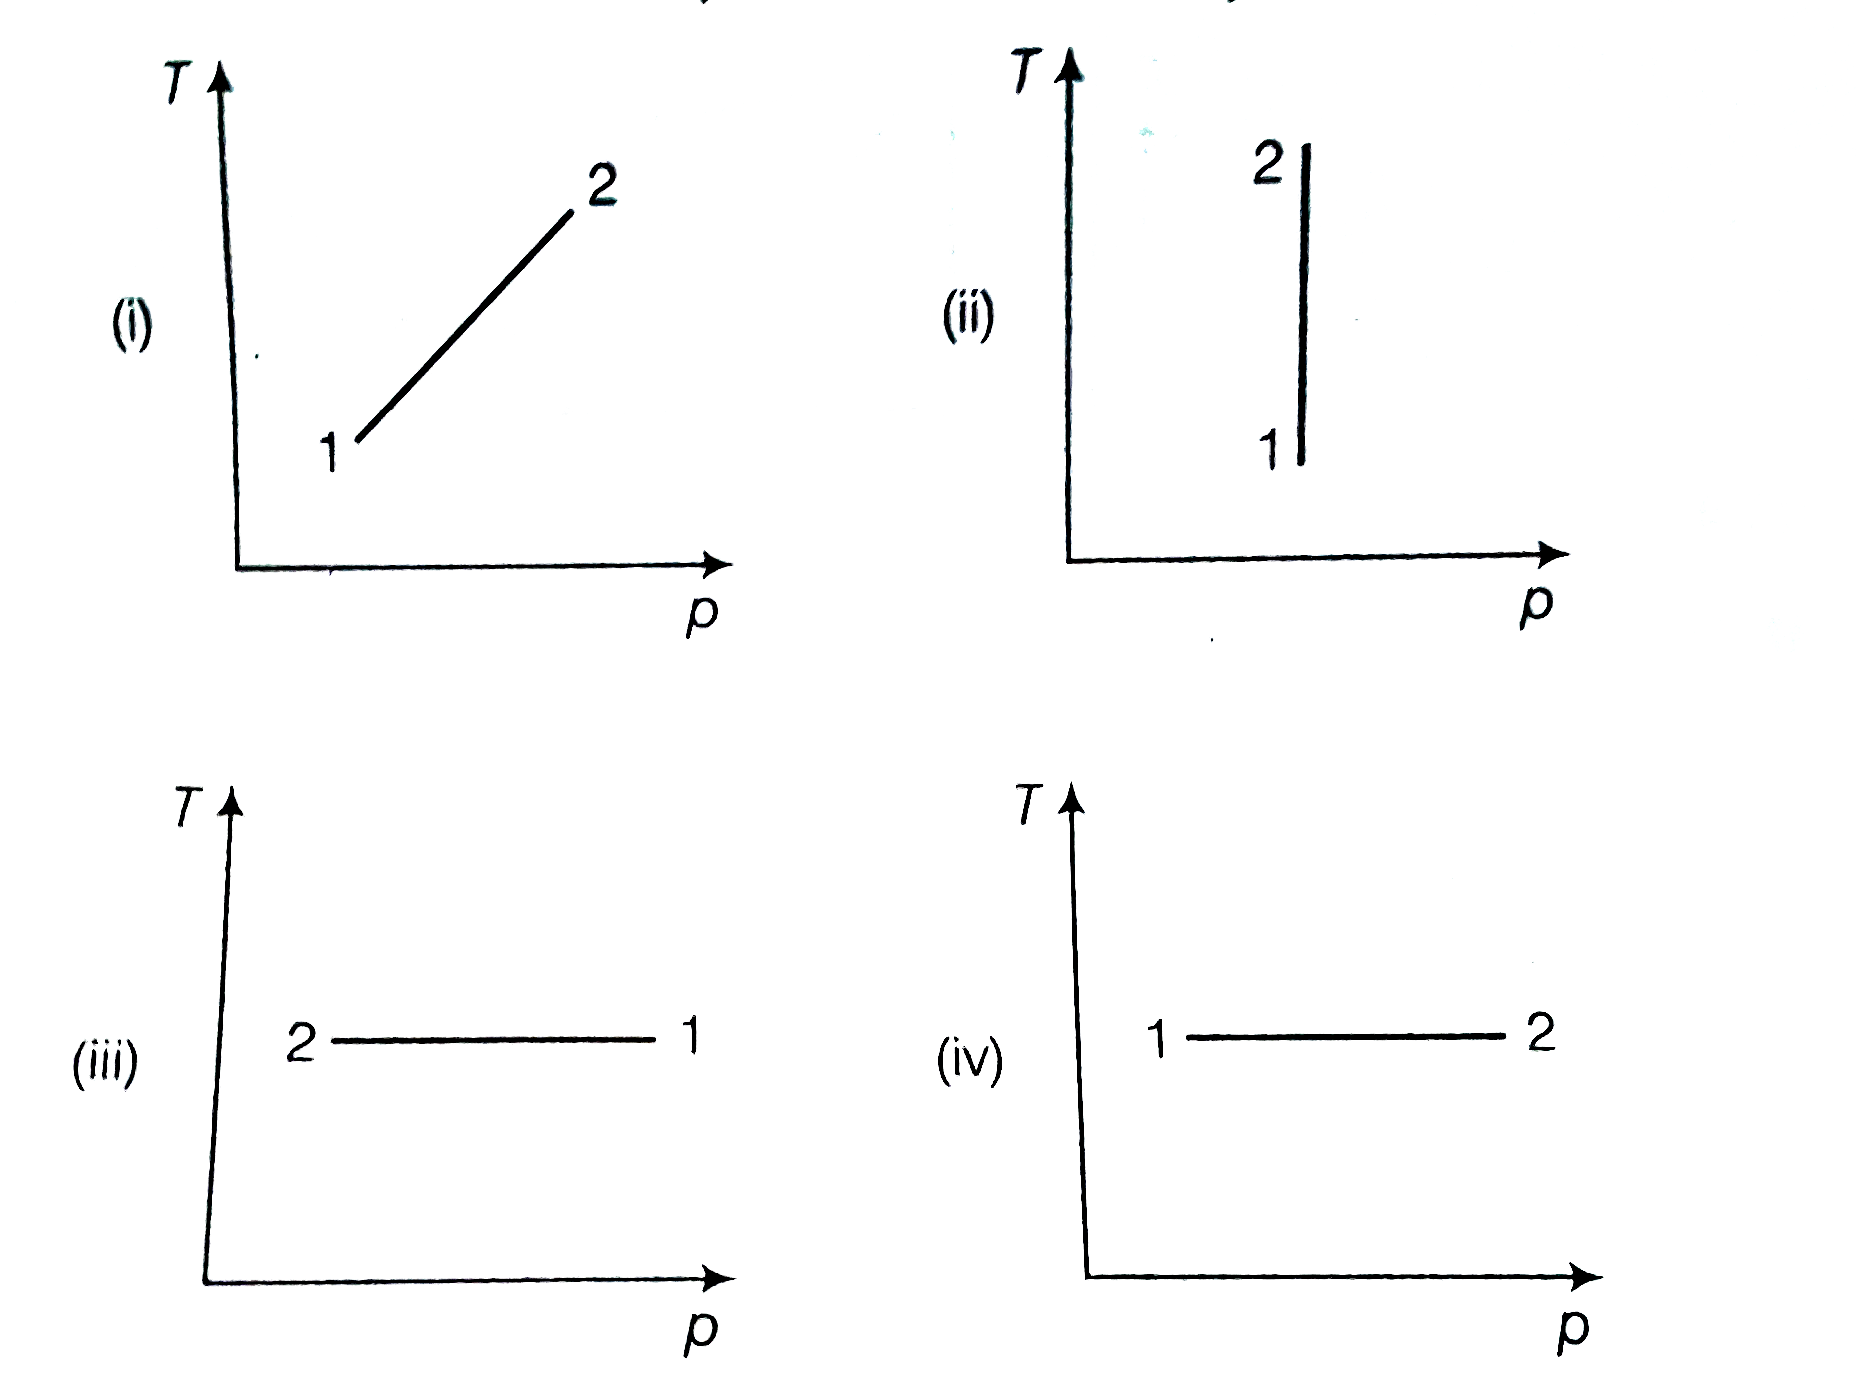
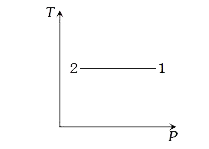
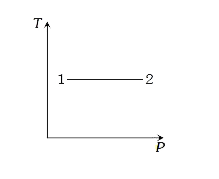
The correct Answer is:C
According to the question given that PV = constant
Hence, we can say that the gas is going through an isothermal process.
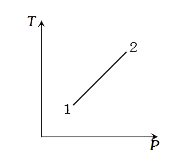
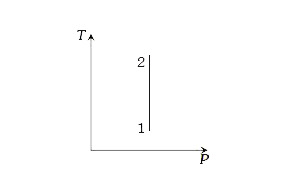
Clearly, from the graph that between process 1 and 2 temperature is constant and the gas expands and pressure decreases Le. P2<P1 which corresponds to diagram (c).
Similar Questions
The P-V diagram for an ideal gas is shown in figure.
Out of the following diagrams which one represents the T-P diagram ?
View SolutionConsider p-V diagram for an ideal gas shown in figure.

Out of the following diagrams, which figure represents the T−p diagram ?
(i)
View SolutionA cyclic process ABCA shown in the V-T diagram is performed with a constant mass of an ideal gas. Show the same process on a p-V diagram, In the figure, CA is parallel to the V-axis and BC is parallel to the T-axis.
View SolutionConsider p - V diagram for an ideal gas shown in figure. Out of the following diagrams, which figure represents the T-p diagram ? (i)
View SolutionP-V diagram of an ideal gas for a process ABC is as shown in the figure.

Change in internal energy of the gas during the process ABC
View SolutionConsider P-V diagram for an ideal gas shown in Fig 12.2. Out of the following diagrams which represents the T-P diagram ?

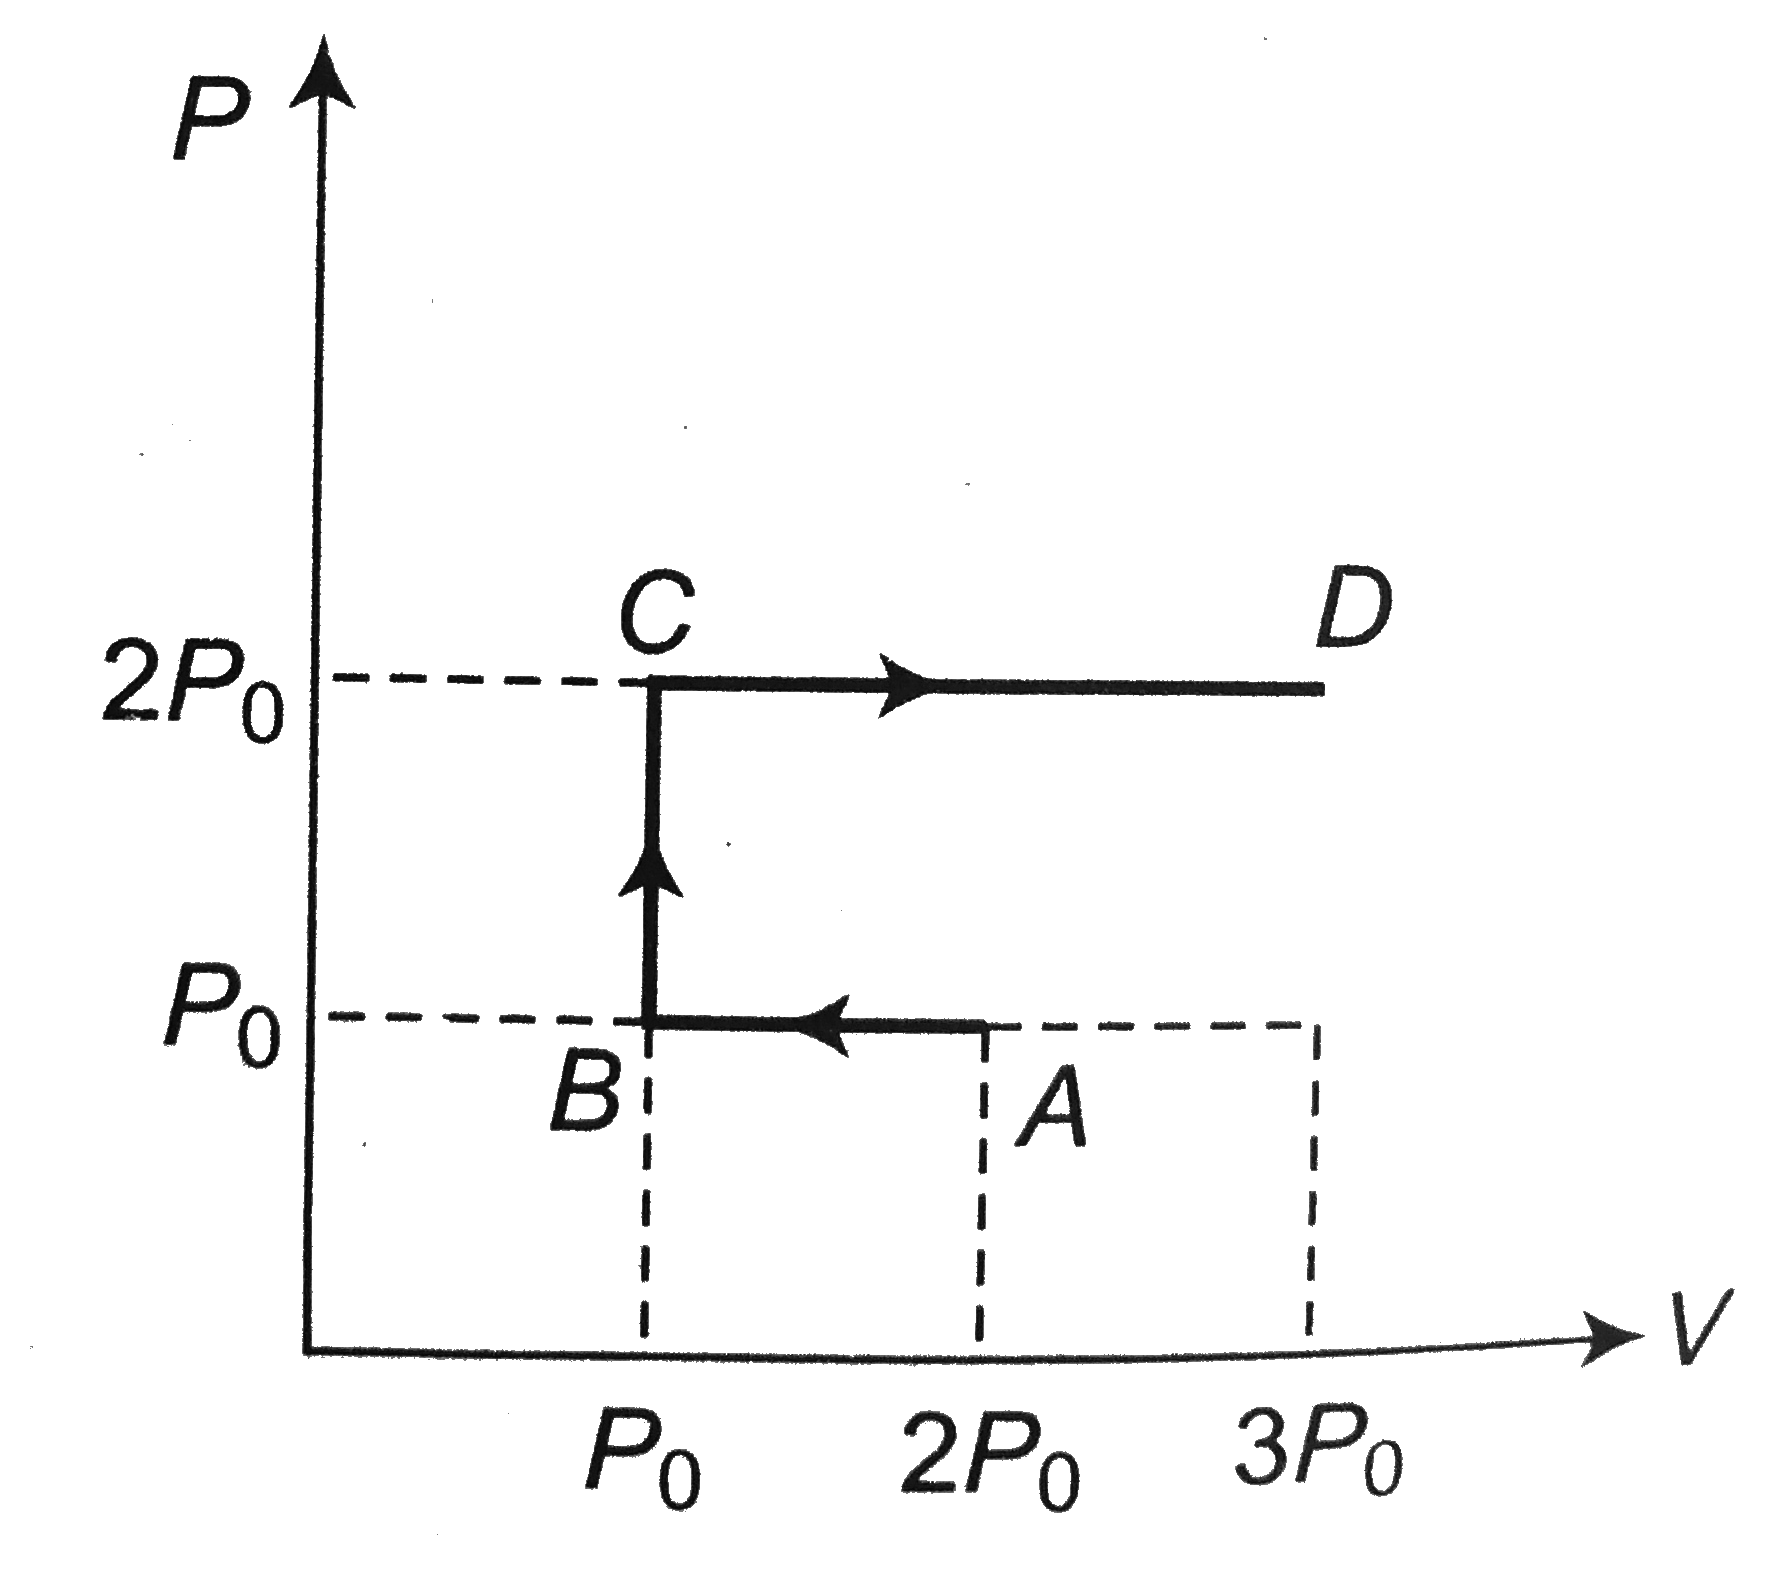
View SolutionP-V diagram of an ideal gas is shown in the figure. Work done by the gas in the process ABCD is

View SolutionP−V diagram of an ideal gas is as shown in figure. Work done by the gas in process ABCD is
View Solution
