PV versus T graph of equal masses of H2,HeandO2 is shown in fig. Choose the correct altermative

C corresponds to H2,B to HeandA to O2
A corresponds to He, B to H2andC to O2
A corresponds to He, B to O2andC to H2
A corresponds to O2,B to H_2 and C to He
The correct Answer is:A
PV=mMRT⇒PVT∝1M
(PVT)A<(PVT)B<(PVT)C
⇒MA>MB>MC
Similar Questions
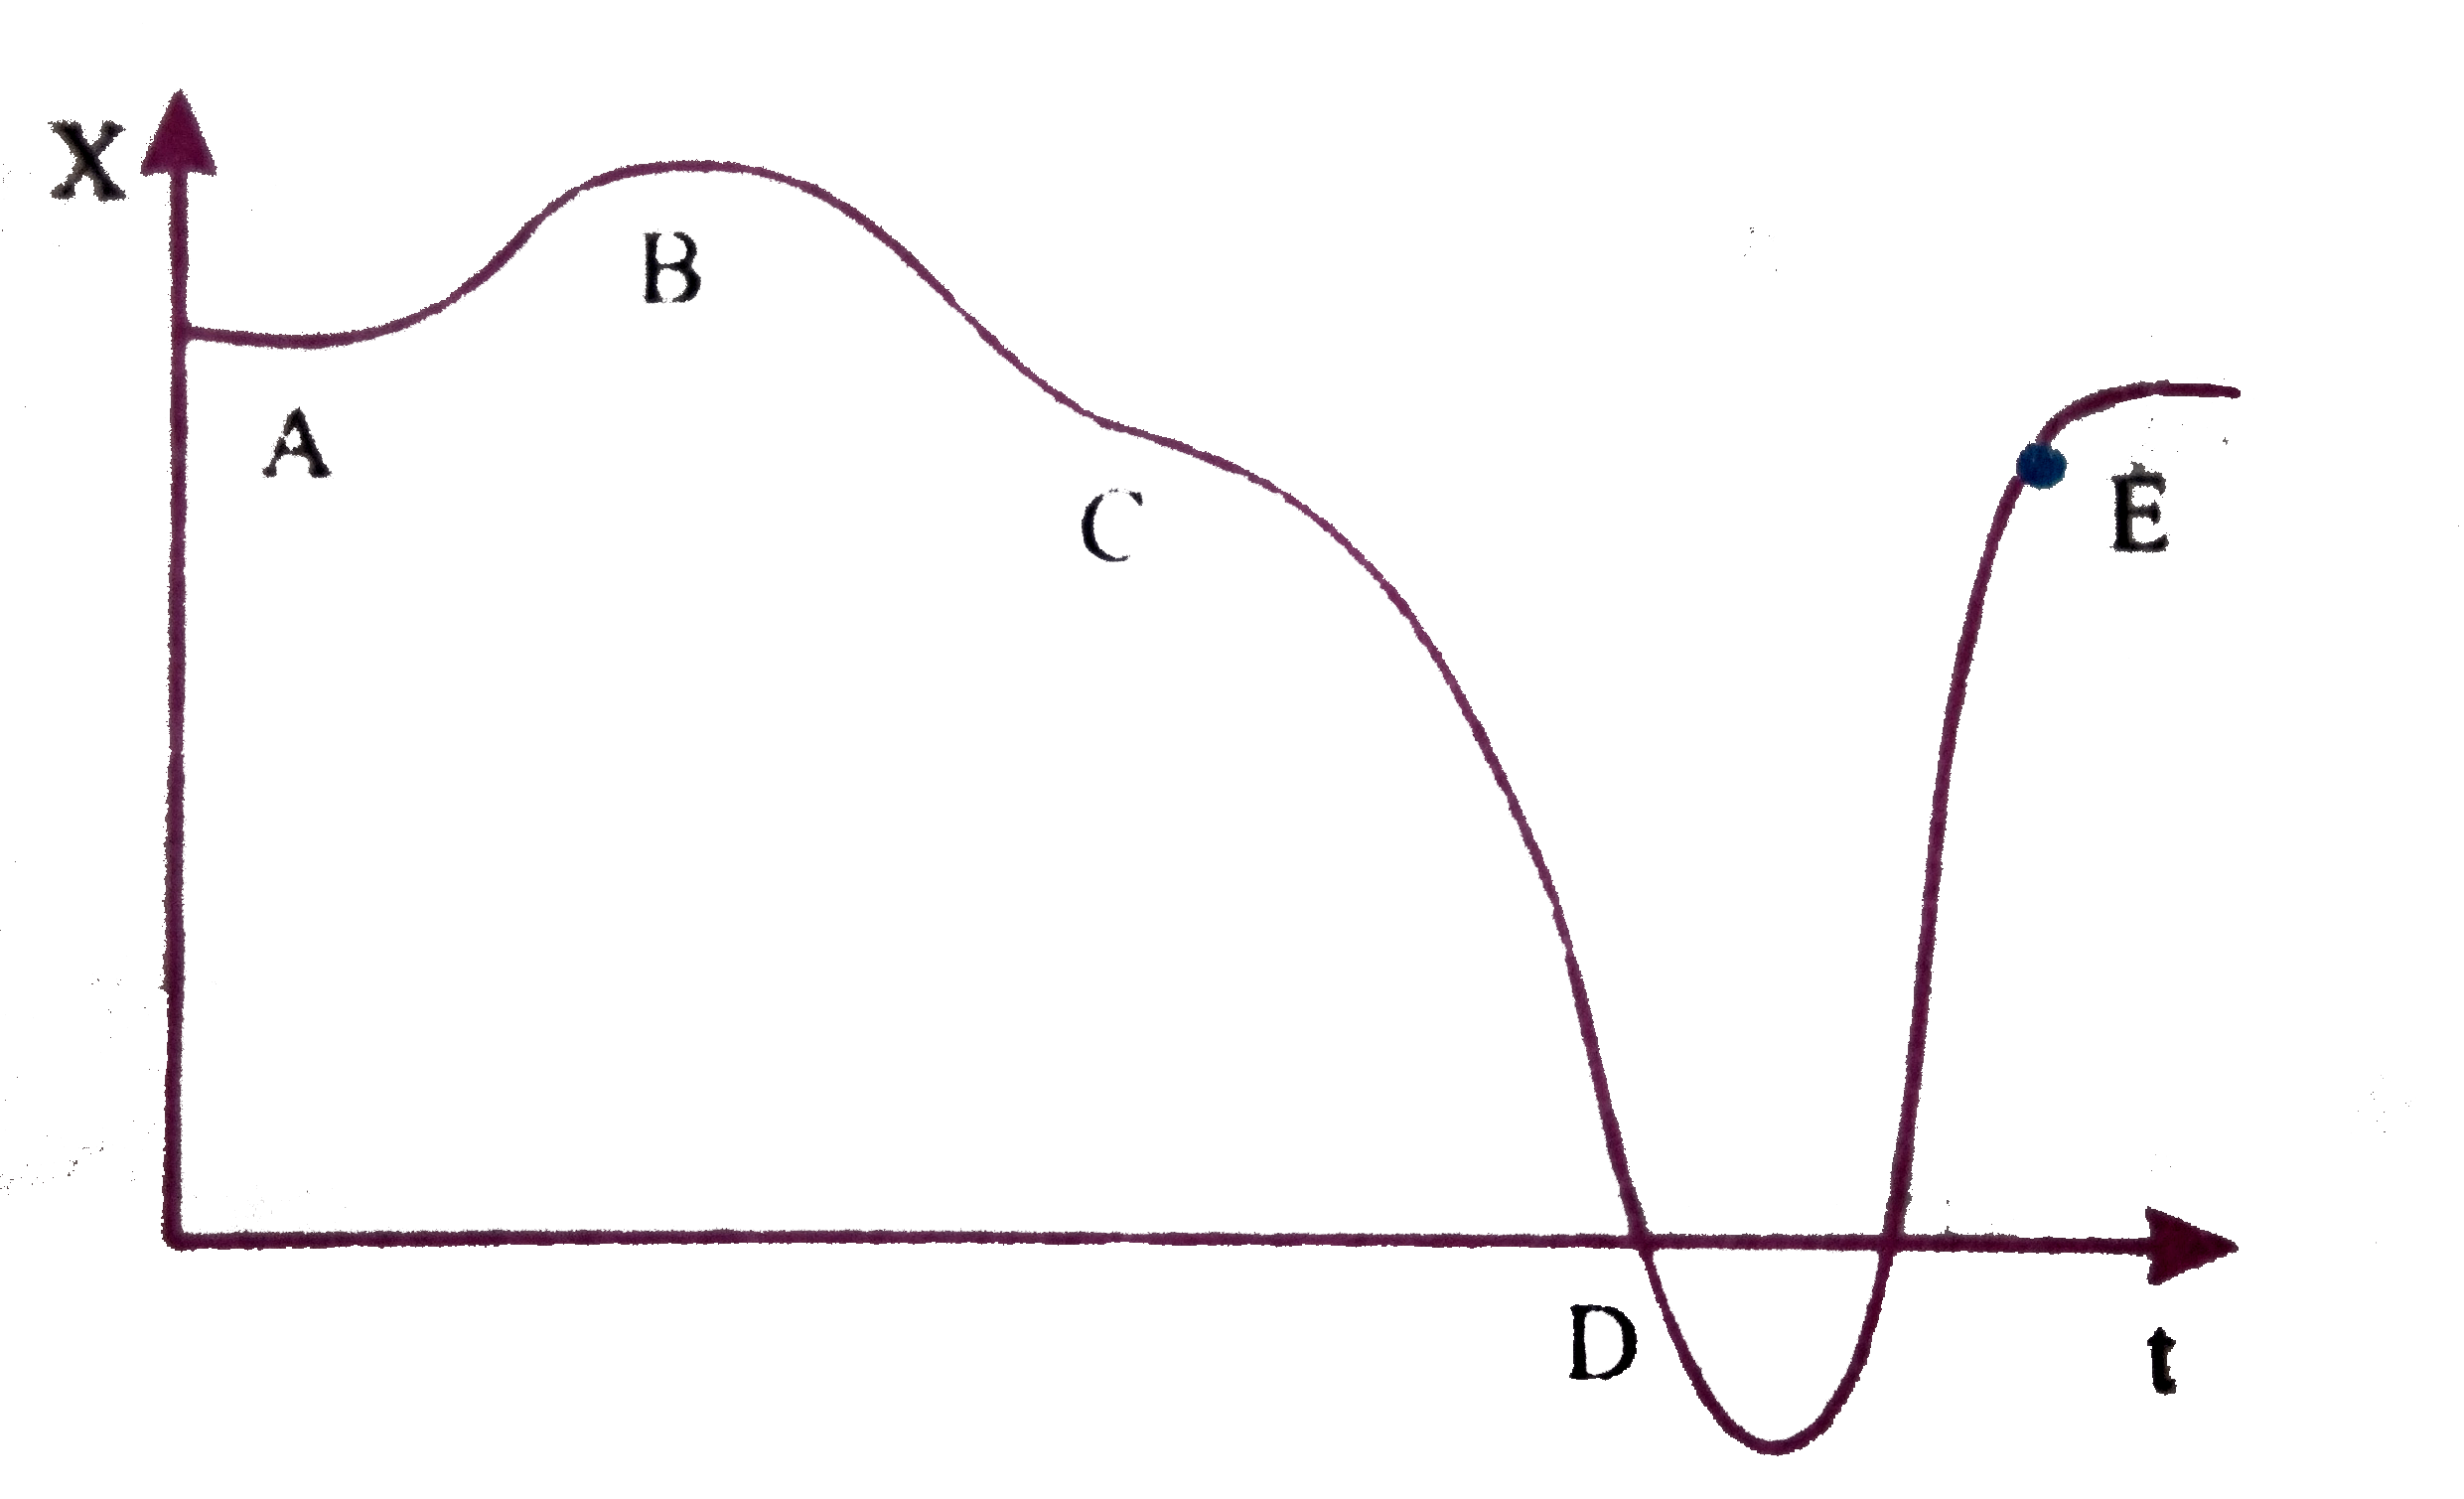
A graph of x versus t is shown in figure. Choose correct alternatives given below.
View Solution
A graph of x versus t is shown in figure. Choose correct alternative from below.
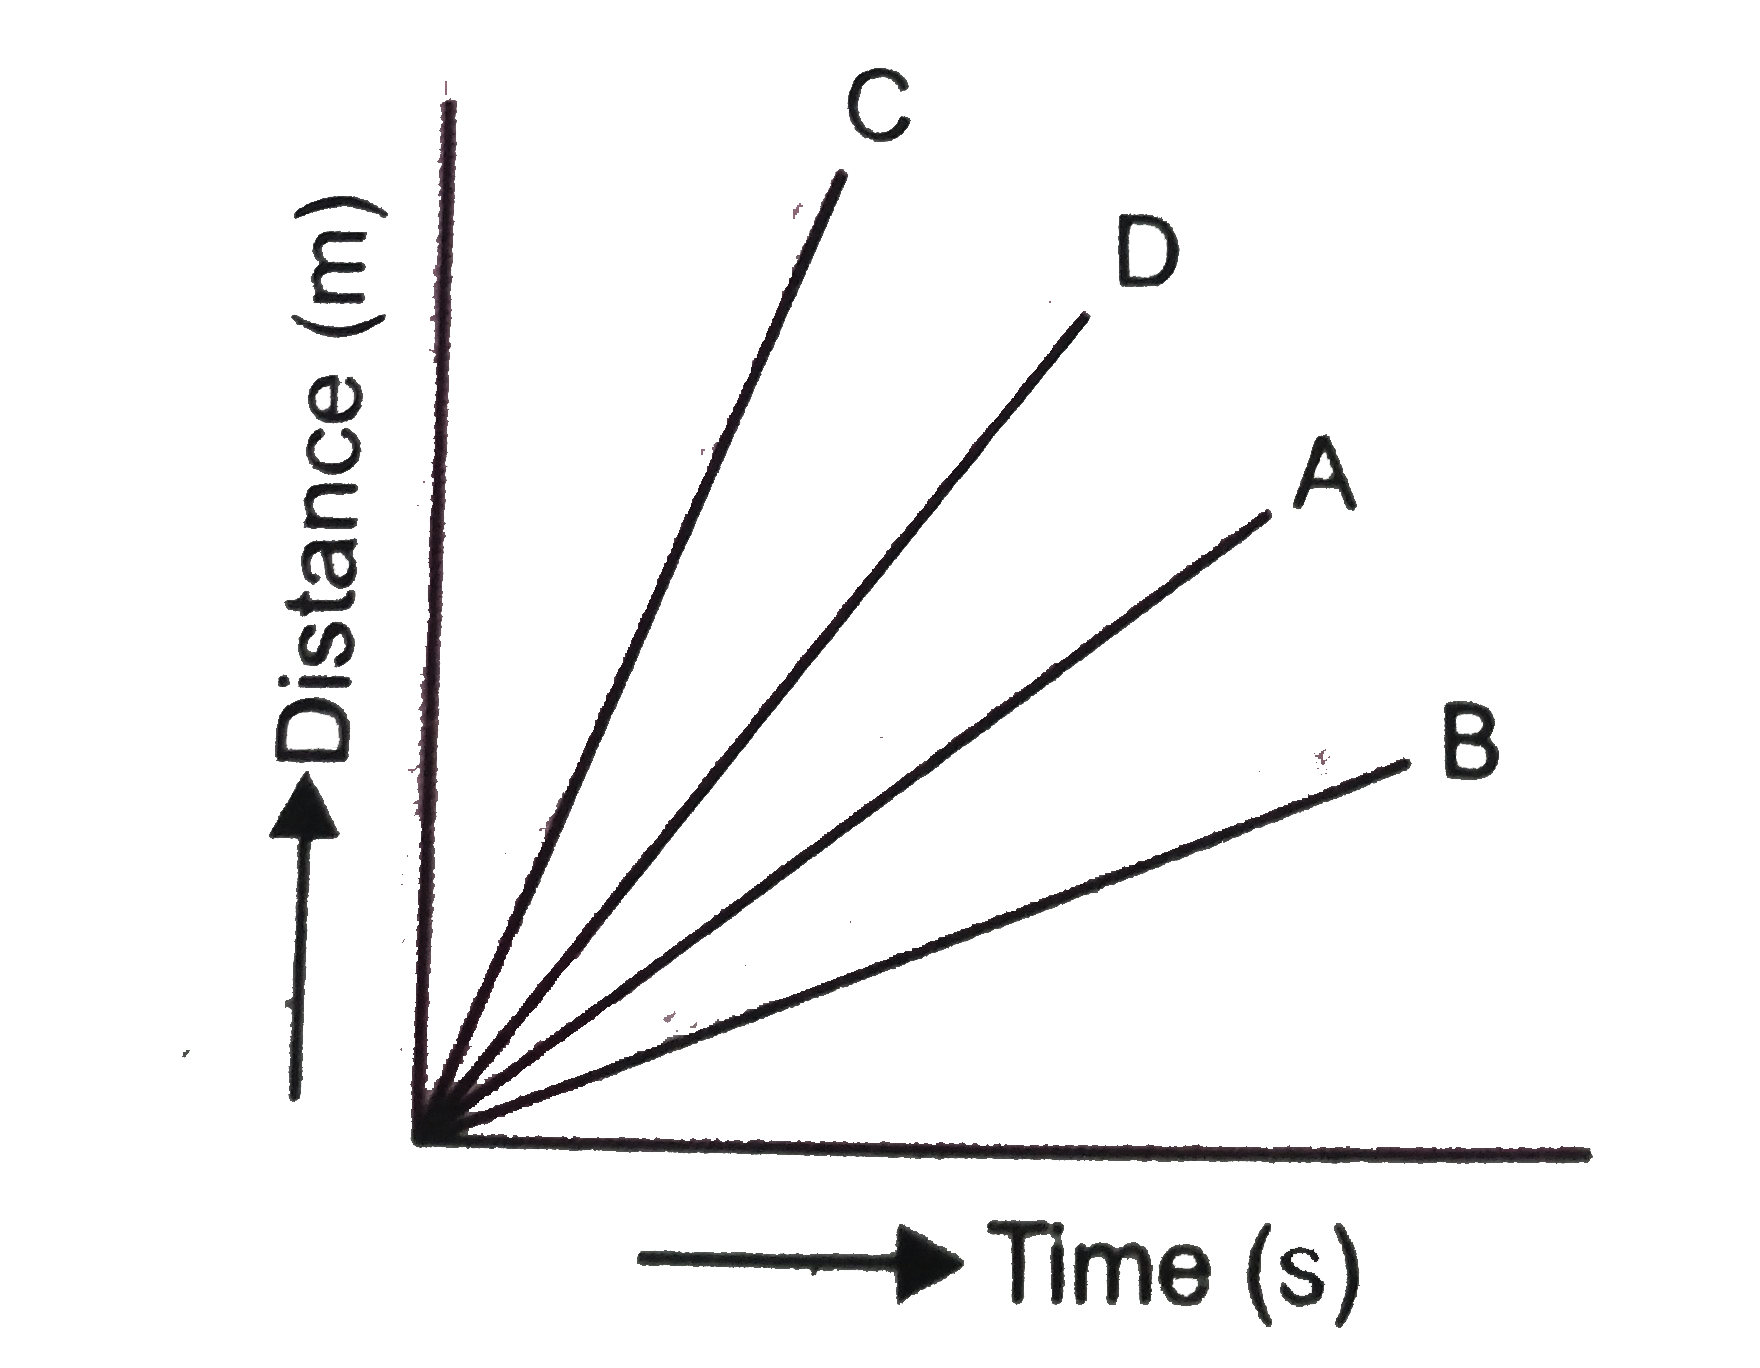
View SolutionFour cars A,B and C are moving on a levelled road. Their distance versus time graphs are shown in Fig. Choose the correct statement

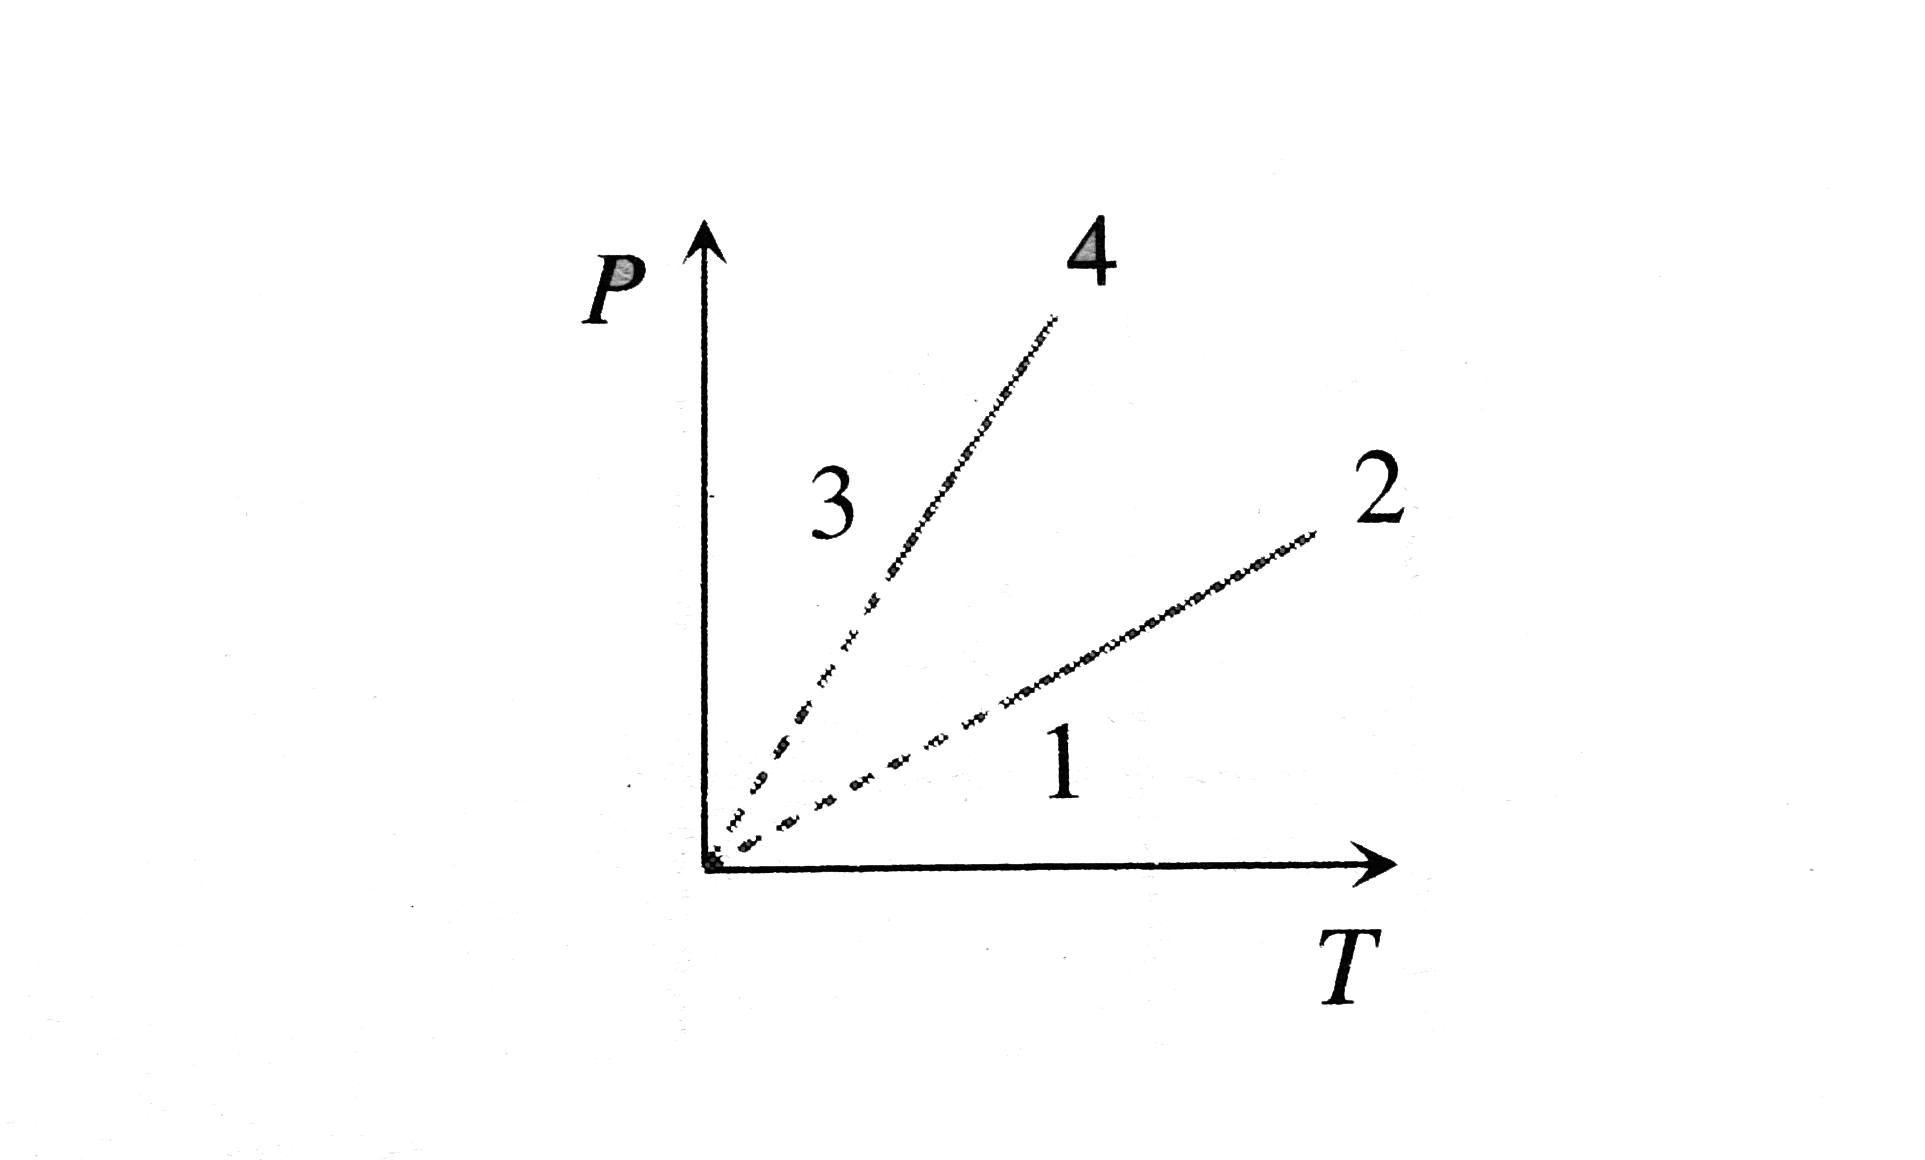
View SolutionPressure versus temperature graph of an ideal gas of equal number of moles of different volumes is plotted as shown in Fig. Choose the correct alternative.

View SolutionFor a given mass of a gas, what is the shape of (pV) versus (T) graph on isothermal process ?
View SolutionPressure versus temperature graph of an ideal gas of equal number of moles of different volumes is plotted as shown in Fig. Choose the correct alternative.
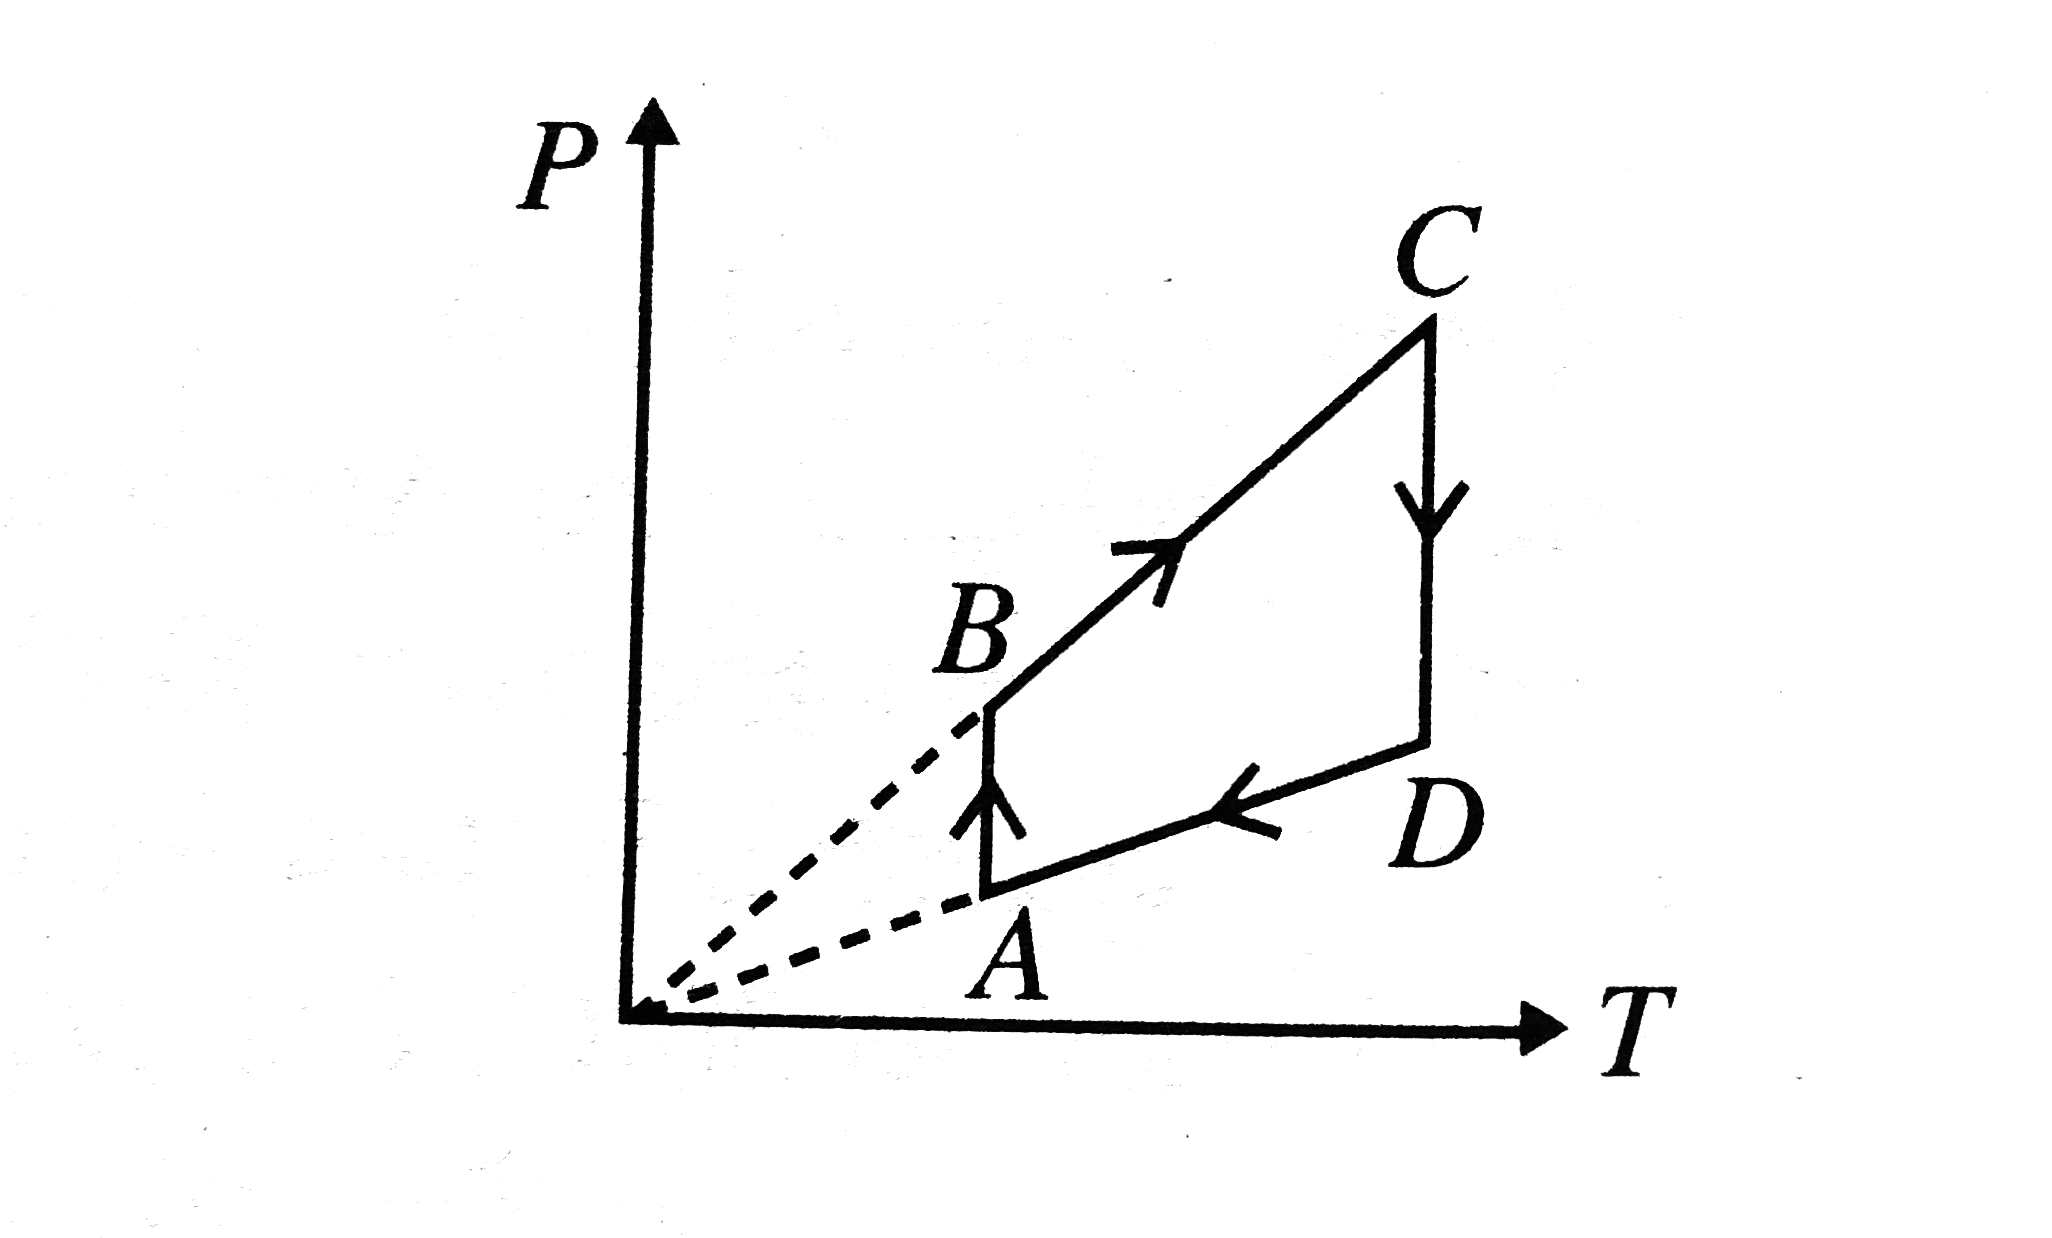
View SolutionPressure versus temperature graph of an ideal gas as shown in Fig.
Corresponding density (ρ) versus volume (V) graph will be

View SolutionVolume versus temperature (V-T) graph of an ideal gas of equal number of moles is plotted as shown in the figure. Choose the correct alternative.
View Solution