The following graph shows the variation of photoelectric current for a photosensitive metal .
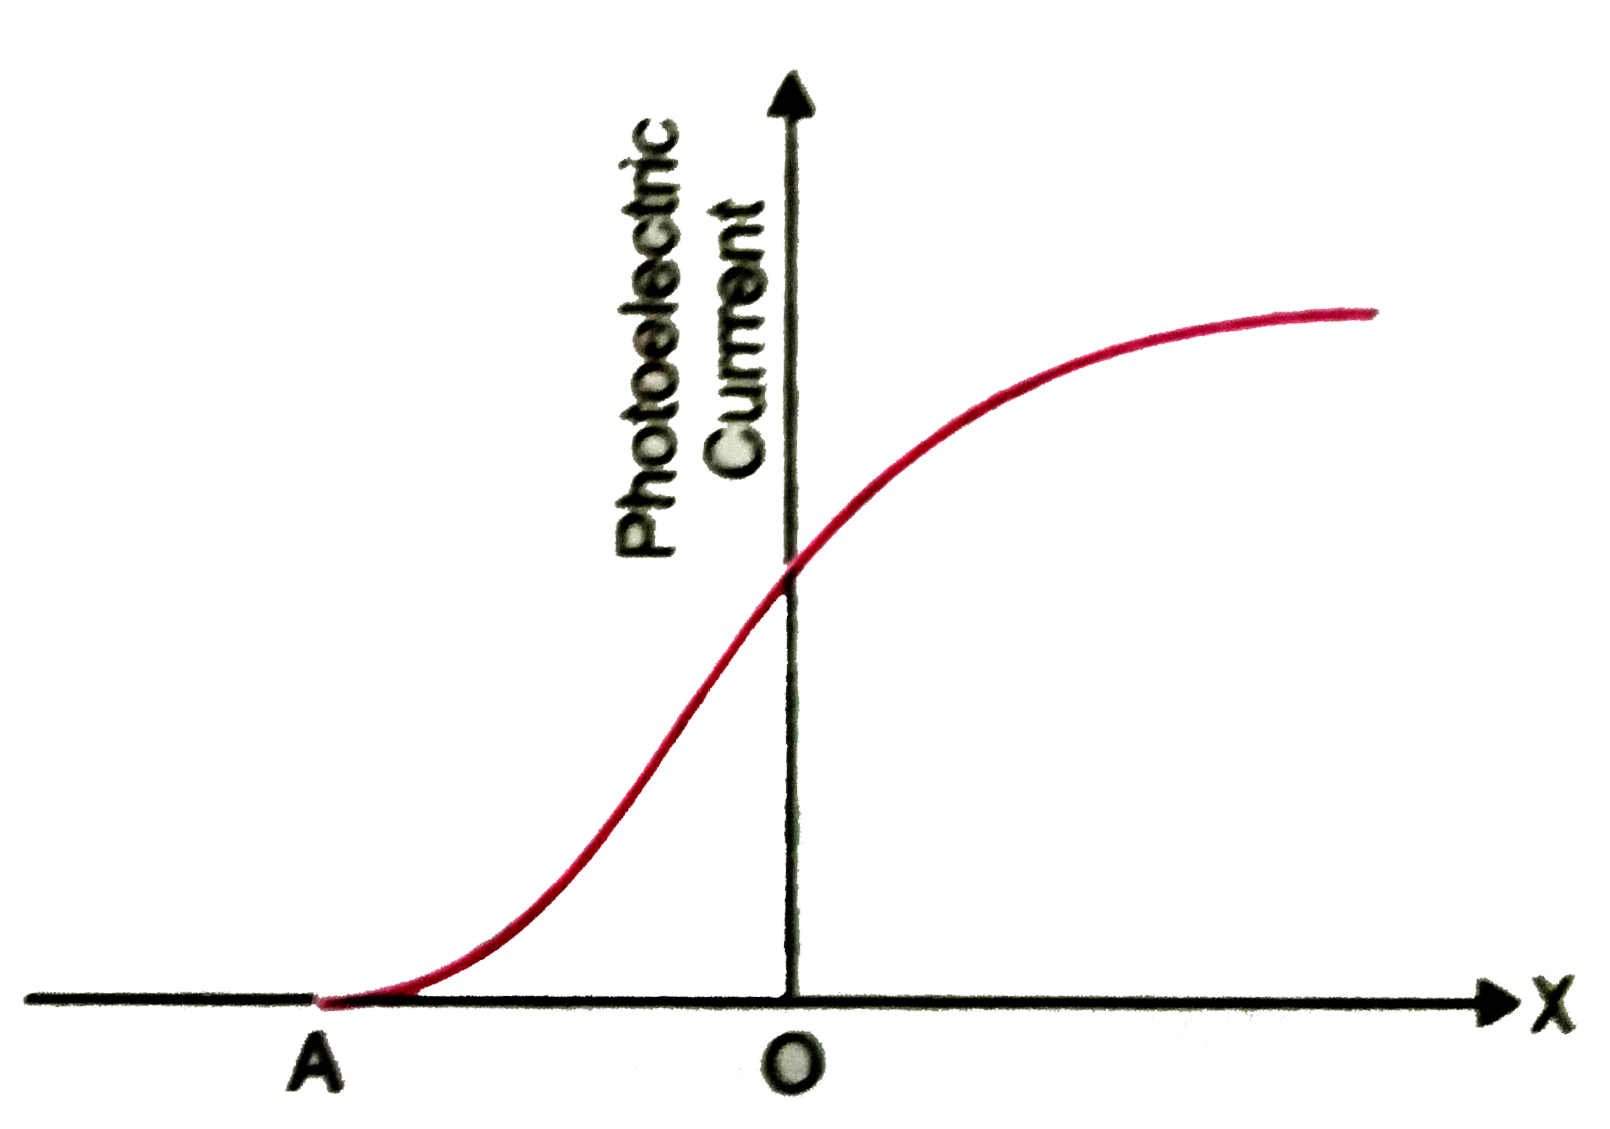
(a) Identify the variable X on the horizontal line.
(b) What does the point A on the horizontal axis represent?
(c) Draw this graph for three different values of frequencies of incident radiation for same intensity.
(d) Draw this graph for three different values of intensities of incident radiation having same frequency.
Step by step video & image solution for The following graph shows the variation of photoelectric current for a photosensitive metal . (a) Identify the variable X on the horizontal line. (b) What does the point A on the horizontal axis represent? (c) Draw this graph for three different values of frequencies of incident radiation v_1, v_2 and v_3 (v_1gtv_2gtv_3) for same intensity. (d) Draw this graph for three different values of intensities of incident radiation I_1,I_2,I_3 (I_1gtI_2gtI_3) having same frequency. by Physics experts to help you in doubts & scoring excellent marks in Class 12 exams.
Updated on:21/07/2023Topper's Solved these Questions
- SAMPLE PAPER 2023 TERM IBOOK - CBSE MODEL PAPERCHAPTER - SAMPLE PAPER 2023 TERM IEXERCISE - SECTION D
4 Videos
- SAMPLE PAPER 2023 TERM IBOOK - CBSE MODEL PAPERCHAPTER - SAMPLE PAPER 2023 TERM IEXERCISE - SECTION B
9 Videos
- SAMPLE PAPER 2022 TERM IIBOOK - CBSE MODEL PAPERCHAPTER - SAMPLE PAPER 2022 TERM IIEXERCISE - SECTION B
16 Videos
- SAMPLE QUESTION PAPER (THEORY)BOOK - CBSE MODEL PAPERCHAPTER - SAMPLE QUESTION PAPER (THEORY)EXERCISE - Section – E
6 Videos
Similar Questions
Plot a graph showing the variation of photoelectric current with anode potential for two light beam of same wavelength but different intensity.
View SolutionDraw a plot showing the variation of photoelectric current versus the intensity of incident radiation on a given photosensitive surface.
View Solution
Knowledge Check
Which one of the following graphs in figure shows the variation of photoelectric current (I) with voltage (V) between the electrodes in a photoelectric cell?
A B
B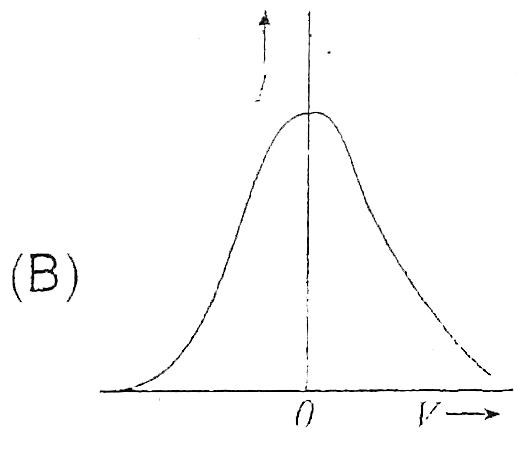 C
C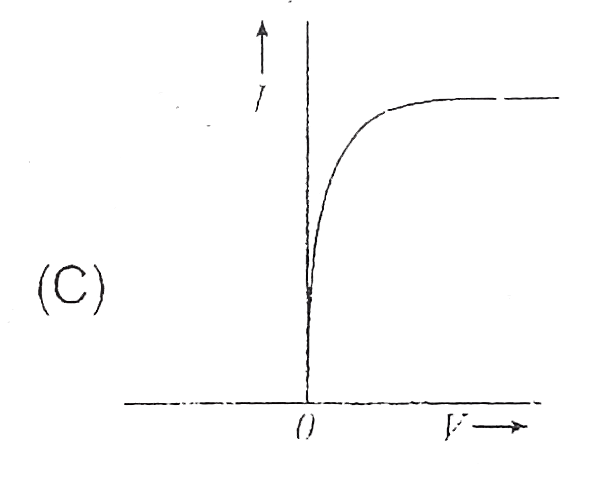 D
D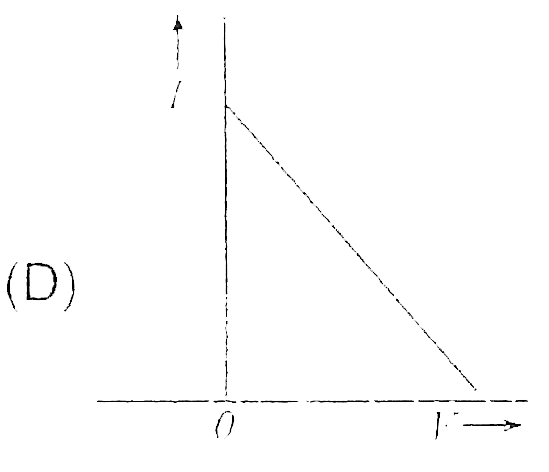
Draw a plot showing the variation of photoelectric current versus the intensity of incident radiation on a given photosenstive surface.
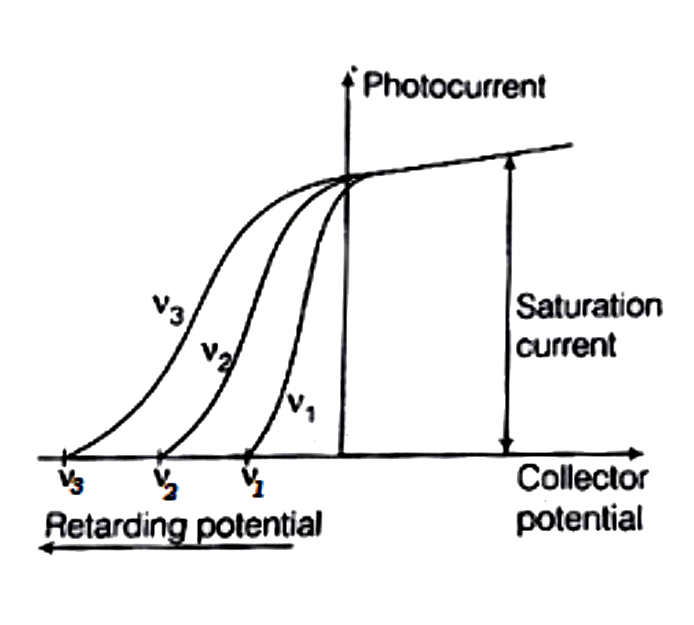
View SolutionThe variation of photocurrent with collector potential for different frequencies of incident radiation v1,v2,v3 is as shown in the the graph , then
View SolutionDraw a plot showing the variation of photoelectric current versus the intensity of incident radiation on a given photosenstive surface.
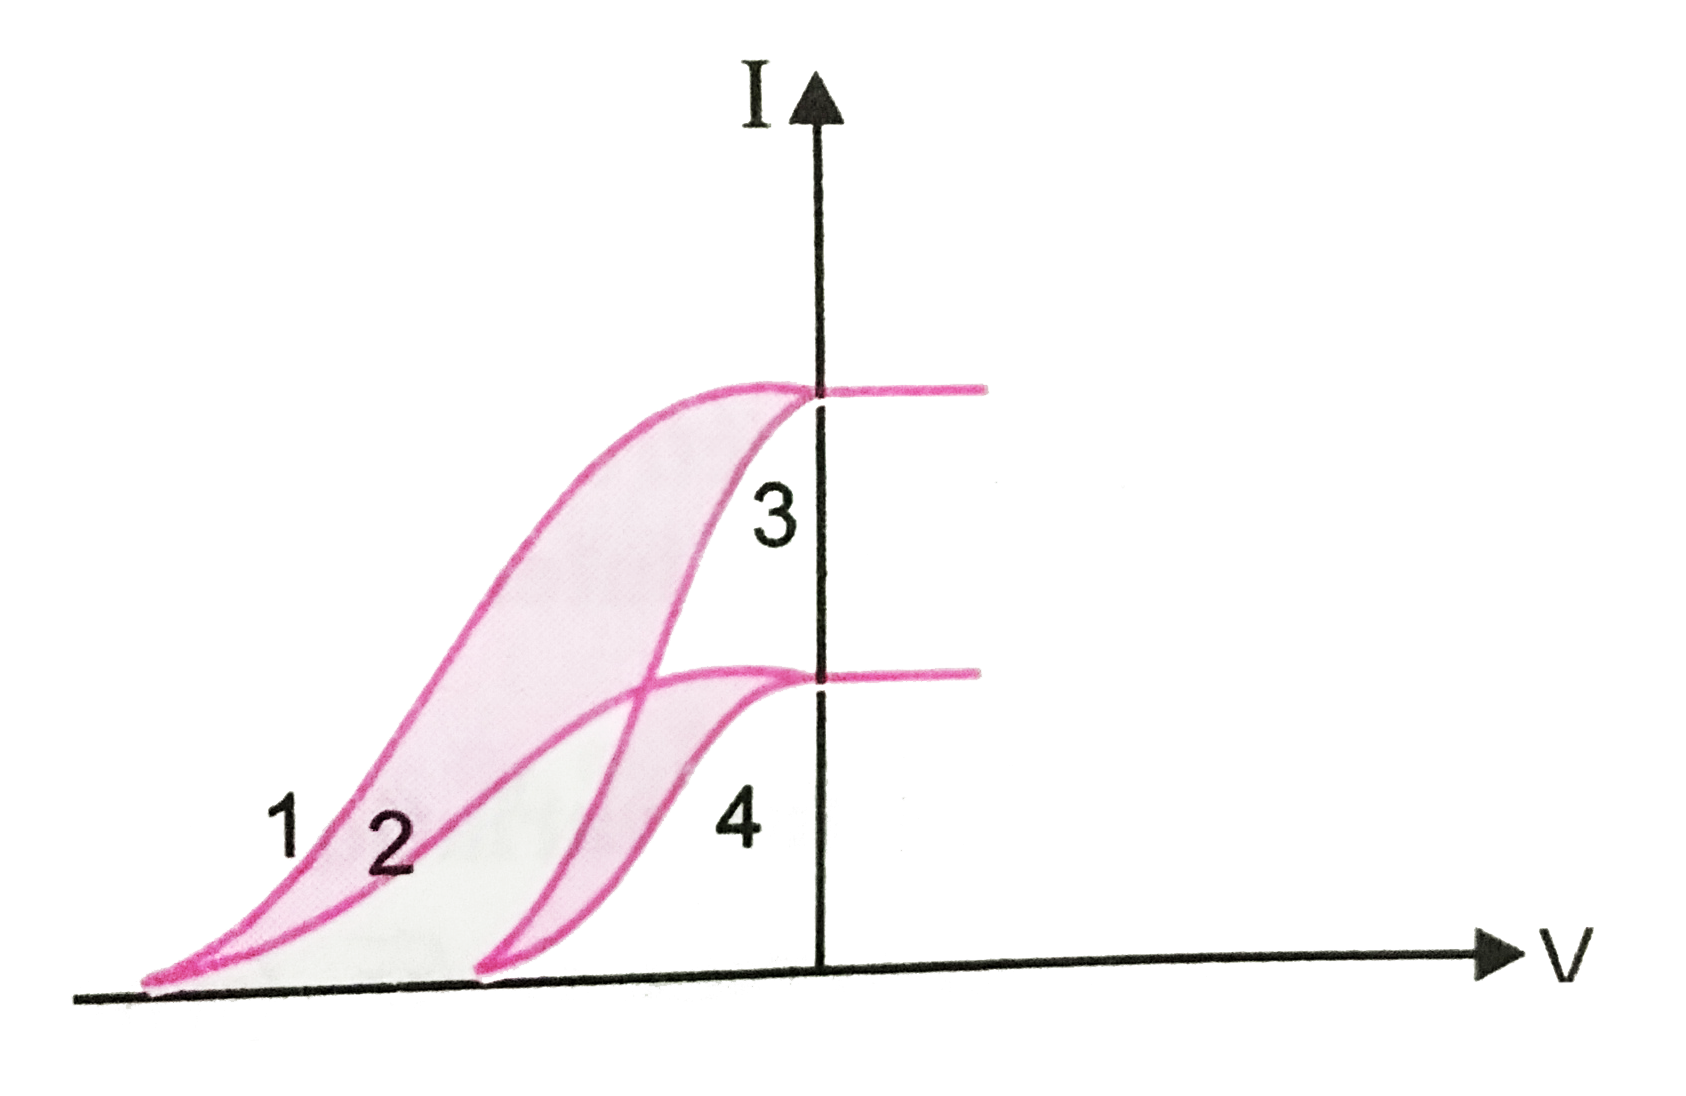
View SolutionThe graph of Fig. shows the variation of photoelectric current (I) versus applied voltage (V) for the two different photosensitive materials for two different intensities of the incident radiation. Identify the pairs of curves that correspond to different materials but same intensity of incident radiation.
View SolutionDraw a graph between intensity of light and photoelectric current for a given frequency .
View SolutionDefine photoelectric effect. Draw a graph to show the variation of stopping potential with frequency of incident radiation on a metal plate.
View SolutionDraw graphs showing variation of photoelectric current with applied voltage for three incident radiations of equal frequency and different intensities. Mark the graph for the radiation of higher intensity.
View Solution
