.A cell of emf E and internal resistance r is connected across a variable resistor. Plot a graph showing variation of terminal voltage V of cell versus the current.
Step by step video solution for .A cell of emf E and internal resistance r is connected across a variable resistor. Plot a graph showing variation of terminal voltage V of cell versus the current. by Physics experts to help you in doubts & scoring excellent marks in Class 12 exams.
Topper's Solved these Questions
Similar Questions
A cell of emf ε and internal resistance r is connected across a variable resistor R. Plot a graph showing variation of terminal voltage V of the cell versus the current I. Using the plot, show how the emf of the cell and its internal resistance can be determined.
View SolutionA cell of emf 'ε' and internal resistance 'r' is connected across a variable resistor 'R'. Plot a graph showing variation of terminal voltage 'V' of the cell versus the current 'l'. Using the plot, show how the emf of the cell and its internal resistance can be determined.
View Solution
Knowledge Check
- Question 1 - Select One
A cell of emf 'E' and internal resistance 'r' is connected to a variable external resistor 'R'. The graph which gives the terminal voltage of cell 'V' with respect to R is :
A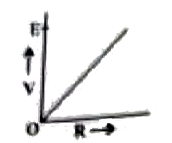 B
B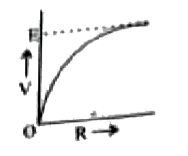 C
C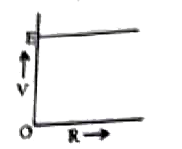 D
D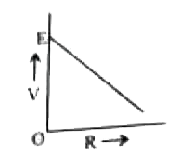
- Question 2 - Select One
A battery of emf E and internal resistance r is connected to a variable resistor R as shown in figure. Which one of the following is true ?
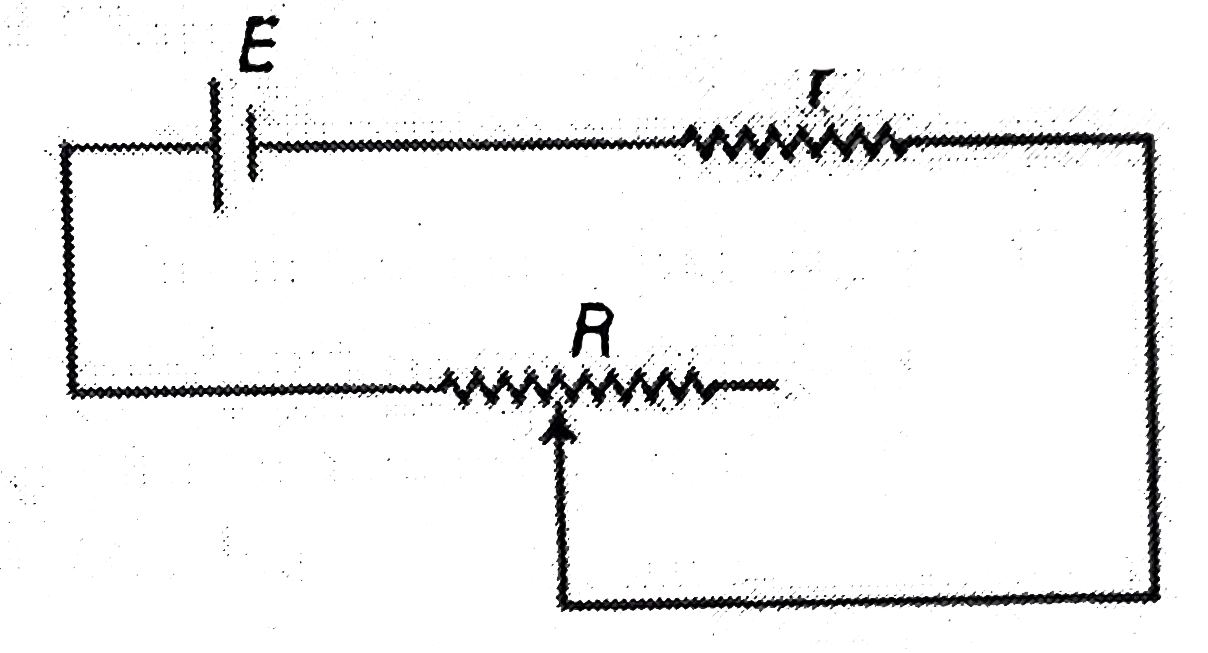 APotenital difference across the terminals of the battery is maximum, when R=rBPower delivered to the resistor is maximum when R=rCCurrent in the circuit is maximum when R=rDCurrent in the circuit is maximum when R>>r
 - Question 3 - Select One
A cell of emf (E) and internal resistance r is connected across a variable external resistance . R. The graph of terminal potential difference V as a function of R is
A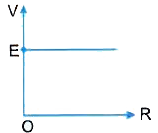 B
B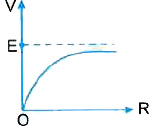 C
C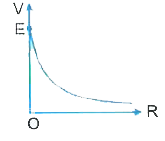 D
D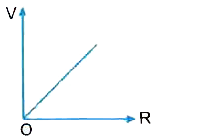
A cell of emf ' ε ' and internal resistance 'r' is connected across a variable resistor 'R'. Plot a graph showing the variation of terminal potential 'V' with resistance R. Predict from the graph the condition under which 'V' becomes equal to 'ε'
View SolutionA cell of emf E and internal resistance r is connected across an external resistance R. Plot a graph showing the variation o P.D. Across R, versesR.
View SolutionA cell of emf ‘E’ and internal resistance ‘r’ is connected across a variable load resistor R. Draw the terminal voltage V versus (i) R and (ii) the current l.
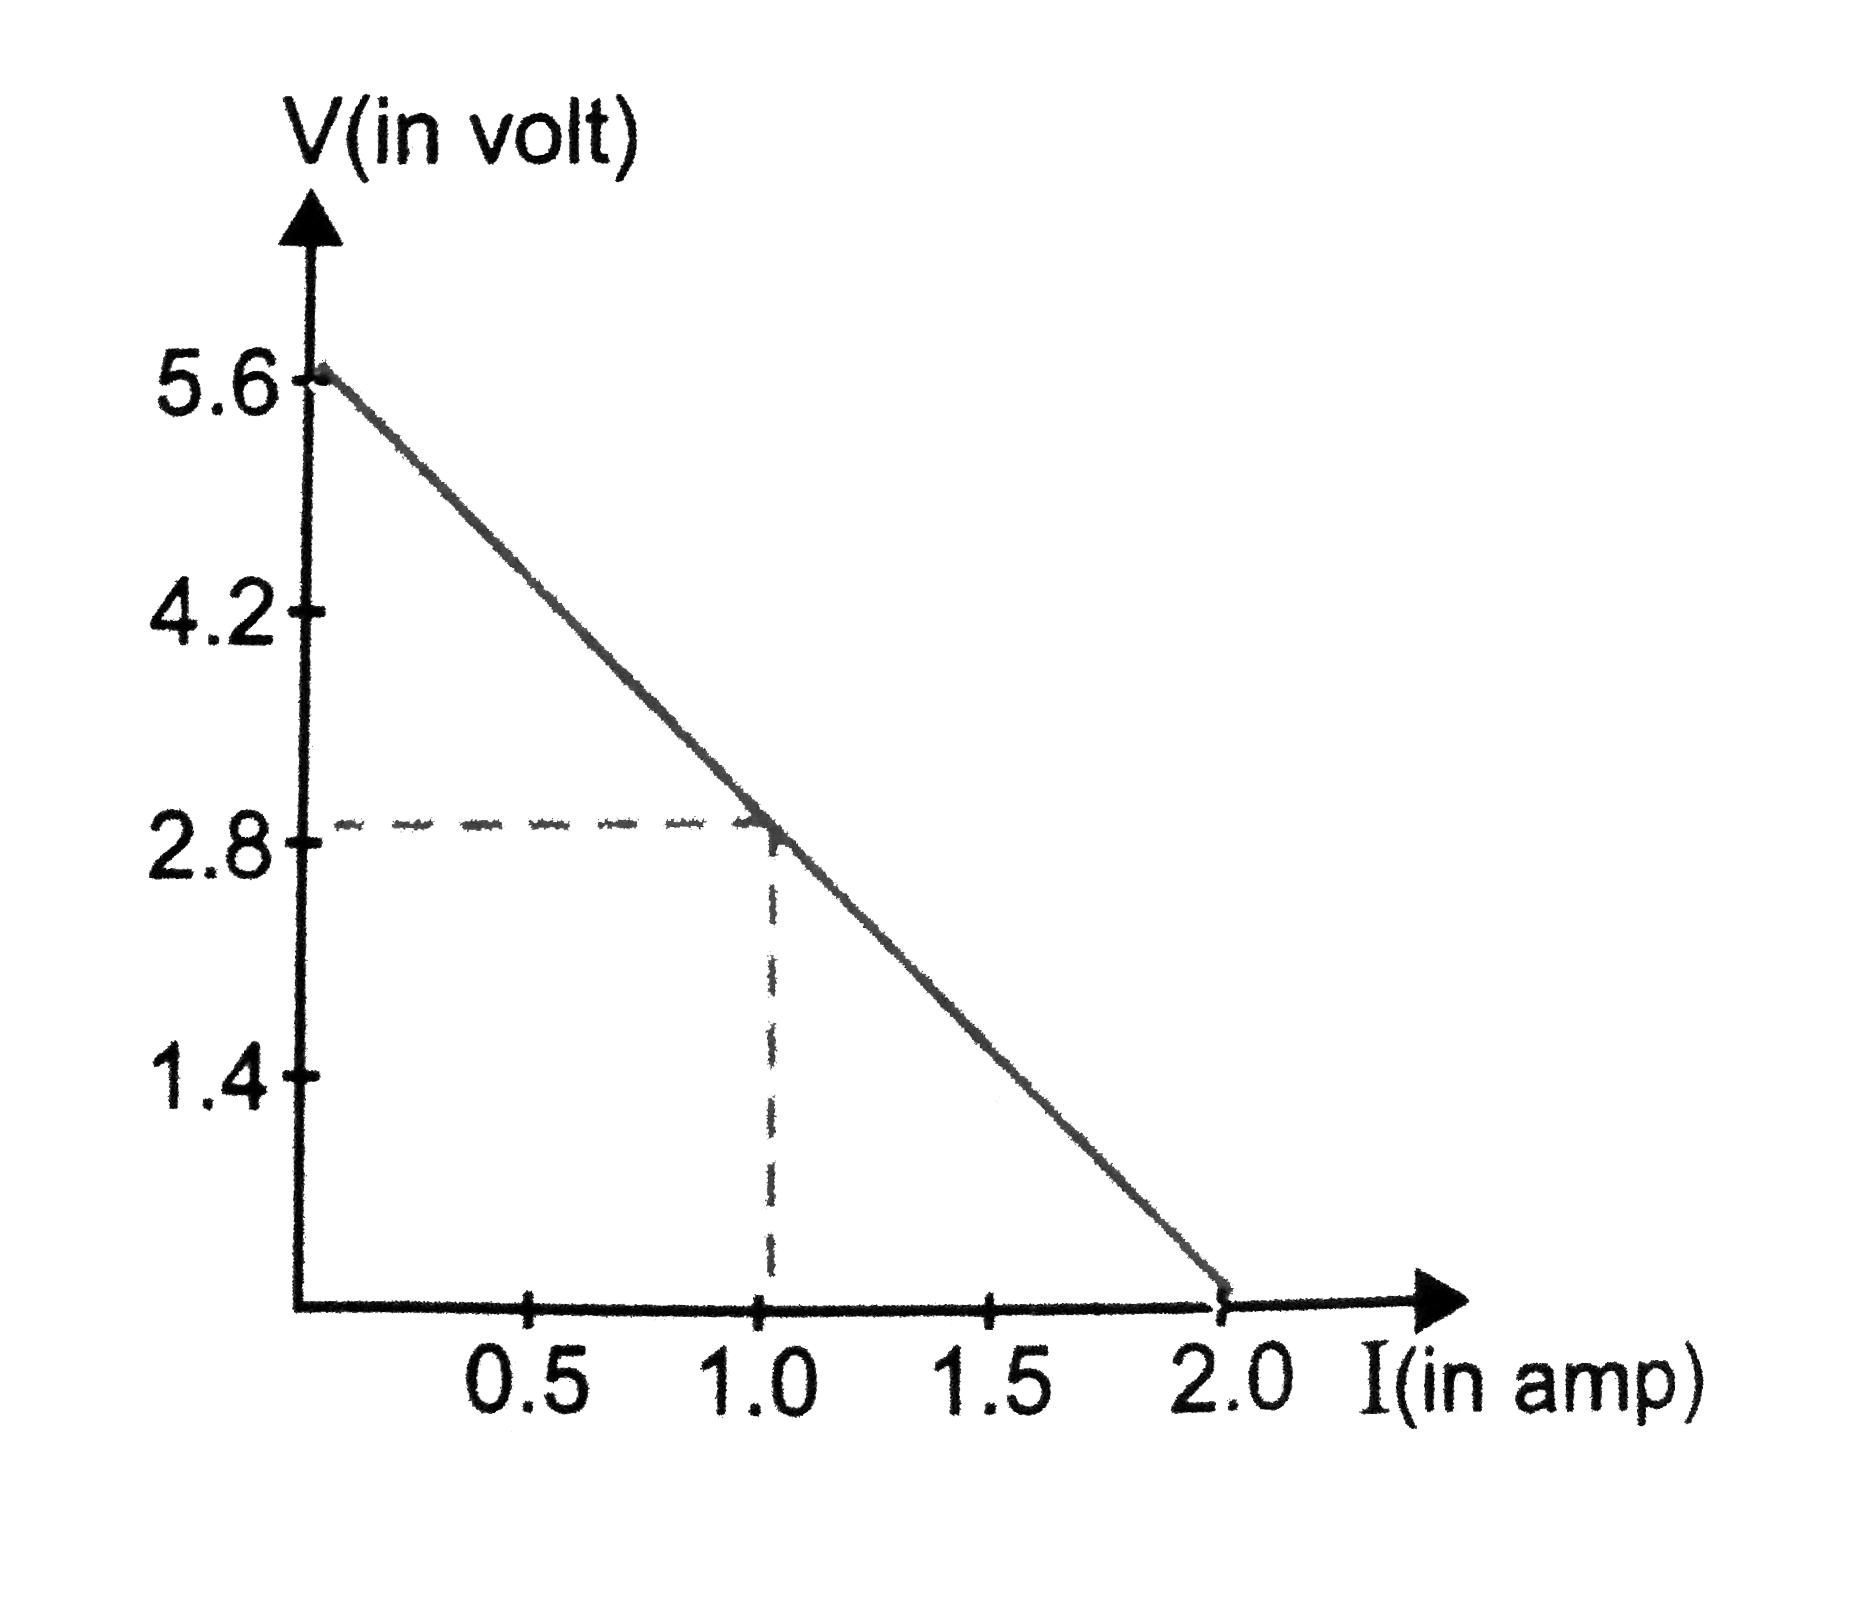
It is found that when R=4Ω, the current is 1 A and when R is increased to 9Ω, the current reduce to 0.5 A. Find the values of the emf E and internal resistance r.View Solution4 cells of identical emf E and internal resistance r, are connected in series to a variable resistor. The following graph shows the variation of termical voltage of the combination with the current output. Fig. MTP 1.2.
(a) What is the emf of each cell used?
(b) For what current from the cells, does maximum power dissipation occur in the circuit?
(c) Calculate the internal resistance of each cell.
 View Solution
A cell of emf ε and internal resistance 'r' is connected across a variable load resistor 'R'. Draw the plots of the terminal voltage 'V' versus (i) R and (ii) the current I.
It is found that when R = 4 Ω , the current is 1 A and when R is increased to 9 Ω , the current reduces to 0.5 A. Find the values of the emf ε and internal resistance r.View Solution

