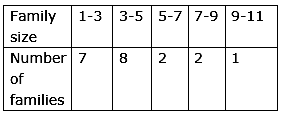
A survey conducted on 20 households in a locality by a group of students resulted in the following frequency table for the number of family members in a household:

Find the median of this data
Step by step video solution for A survey conducted on 20 households in a locality by a group of students resulted in the following frequency table for the number of family members in a household: Find the median of this data by Maths experts to help you in doubts & scoring excellent marks in Class 10 exams.
Updated on:21/07/2023Topper's Solved these Questions
Similar Questions
Knowledge Check
A survey conducted on 20 households in a locality by a group of students resulted in the following frequency table for the number of family members in a household:Find the mode of this data.
 A4B3.8C3.286DNone
The following table shows the weight of 20 students :

The mode and median of the above data are, respectively :A53 and 56B60 and 53C51 and 48D48 and 53
The frequency distribution table shows the number of mango trees in a grove and their yield of mangoes. Find the median of data.

View SolutionThe frequency distribution table shows the number of mango trees in a grove and their yield of mangoes. Find the median of data.

View SolutionThe following table given the daily income of 50 workers of a factory :

Find the mean, mode nad median of above data.
View SolutionThe following table shows frequency distribution of the number of saplings planted by the students of a school :

Find the modal number of saplings planted.
View SolutionFind the mean median of the following frequency distrbution :

Also, find the mode of the following data.
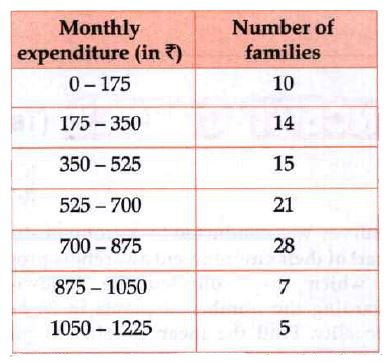
View SolutionMonthly expenditures on milk in 100 families of a housing society are given in the following frequency distribution:
Find the mode and median for this distribution.

View Solution


