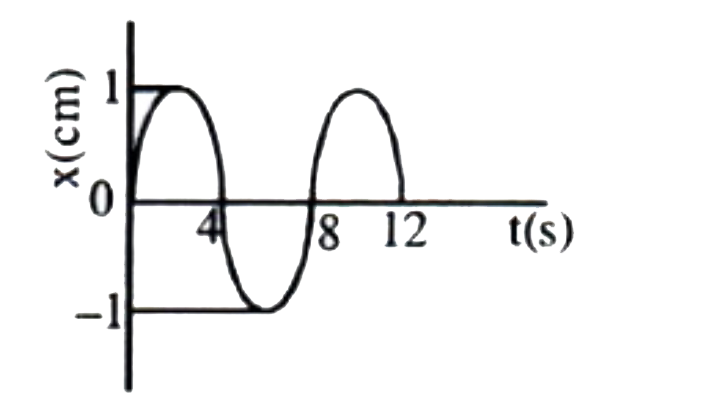
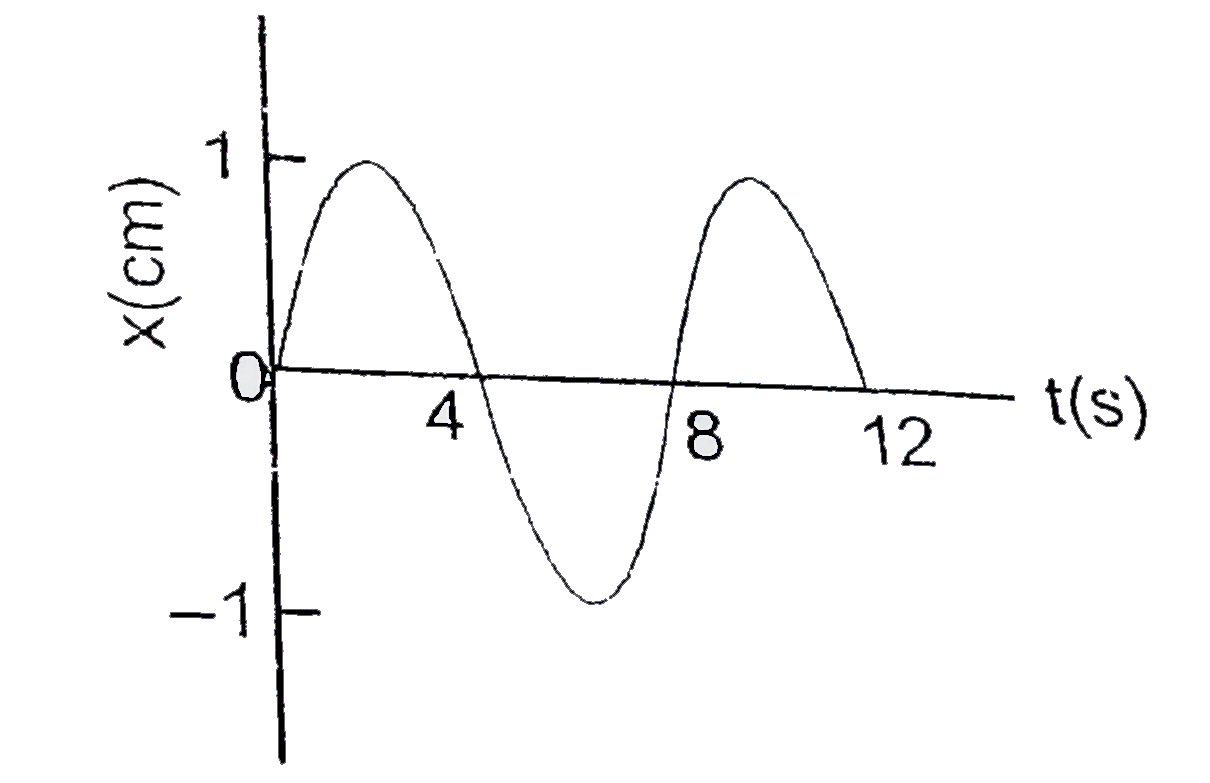
The x-t graph of a particle performing simple harmonic motion is shown in the figure. The acceleration of the particle at t=2s is :
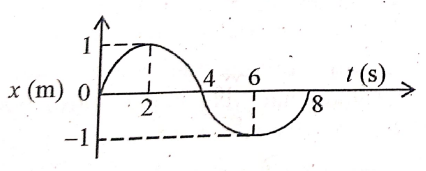
−π28ms−2
π216ms−2
−π216ms−2
π28ms−2
Step by step video solution for The x-t graph of a particle performing simple harmonic motion is shown in the figure. The acceleration of the particle at t=2s is : by Physics experts to help you in doubts & scoring excellent marks in Class 12 exams.
Updated on:21/07/2023Topper's Solved these Questions
Similar Questions
Knowledge Check
The x−t graph of a particle undergoing simple harmonic motion is shown in figure. Acceleration of particle at t=4/3s is
 A√332π2cm/s2B−π232cm/s2Cπ232cm/s2D−√332π2cm/s2
The x-t graph of a particle undergoing simple harmonic motion is shown below. The acceleration of the particle of t=4/3s is
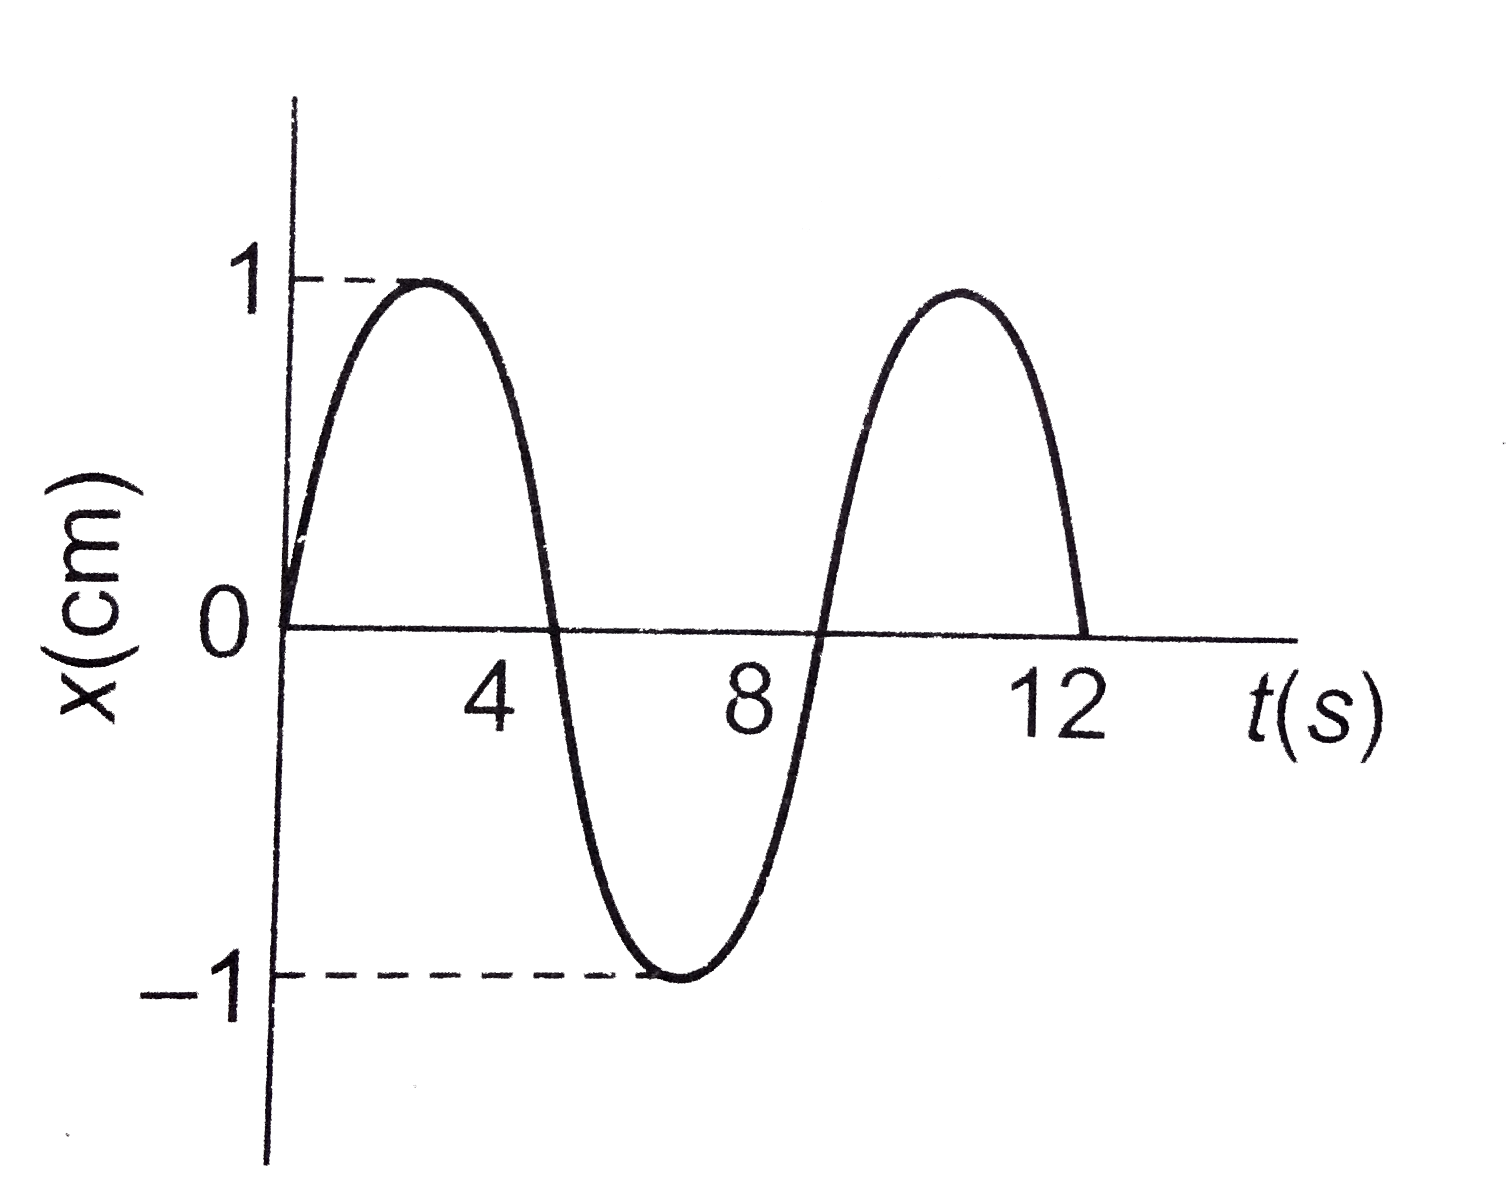 A√332π2cm/s2B−π232cm/s2Cπ232cm/s2D−√332π2cm/s2
The x−t graph of a particle undergoing simple harmonic motion is shown below. The accelertion of the particle at t=4/3s is
 A√332π2cm/s2B−π232cm/s2Cπ232cm/s2D−√332π2cm/s2
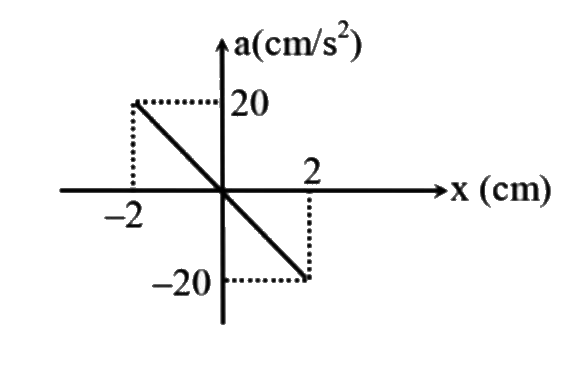
The x-t graph of a particle executing S.H.M.is given as shown in the figure. Then maximum accleration of the particle is given as?
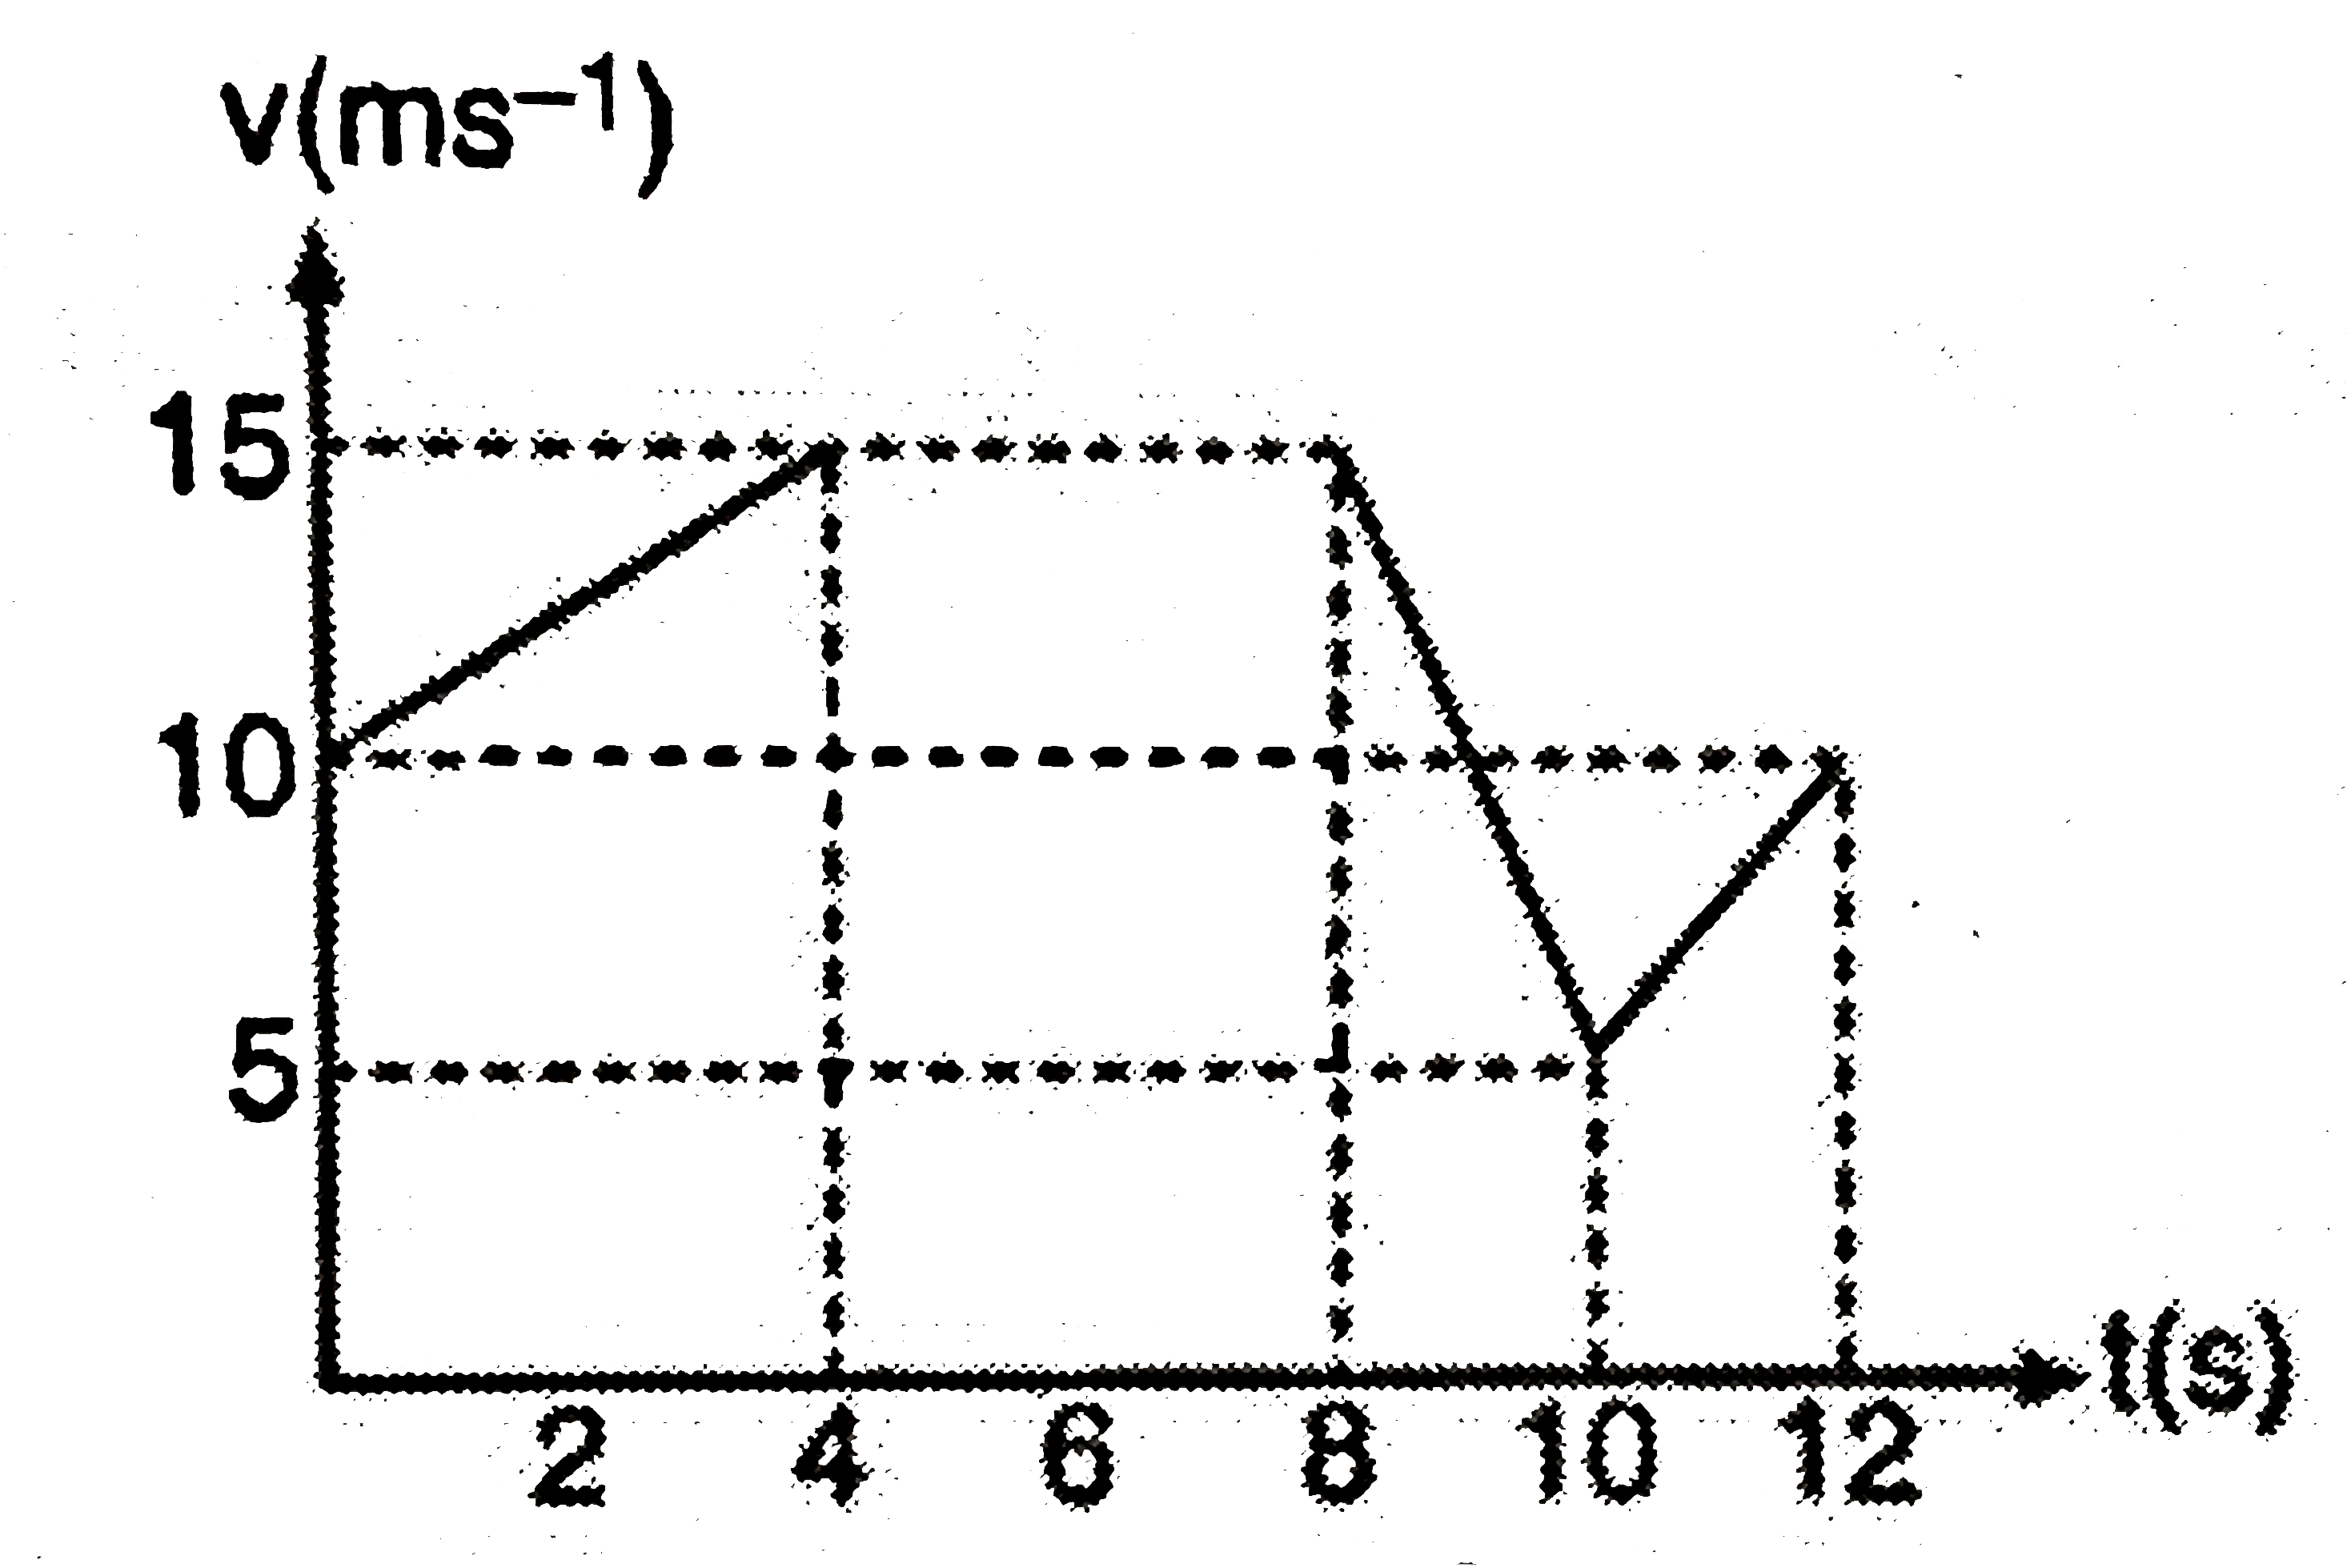
View SolutionThe velocity -time (v−t) graph of a particle moving in a straight line is shown in figure. The acceleration of the particle at t=9 is:
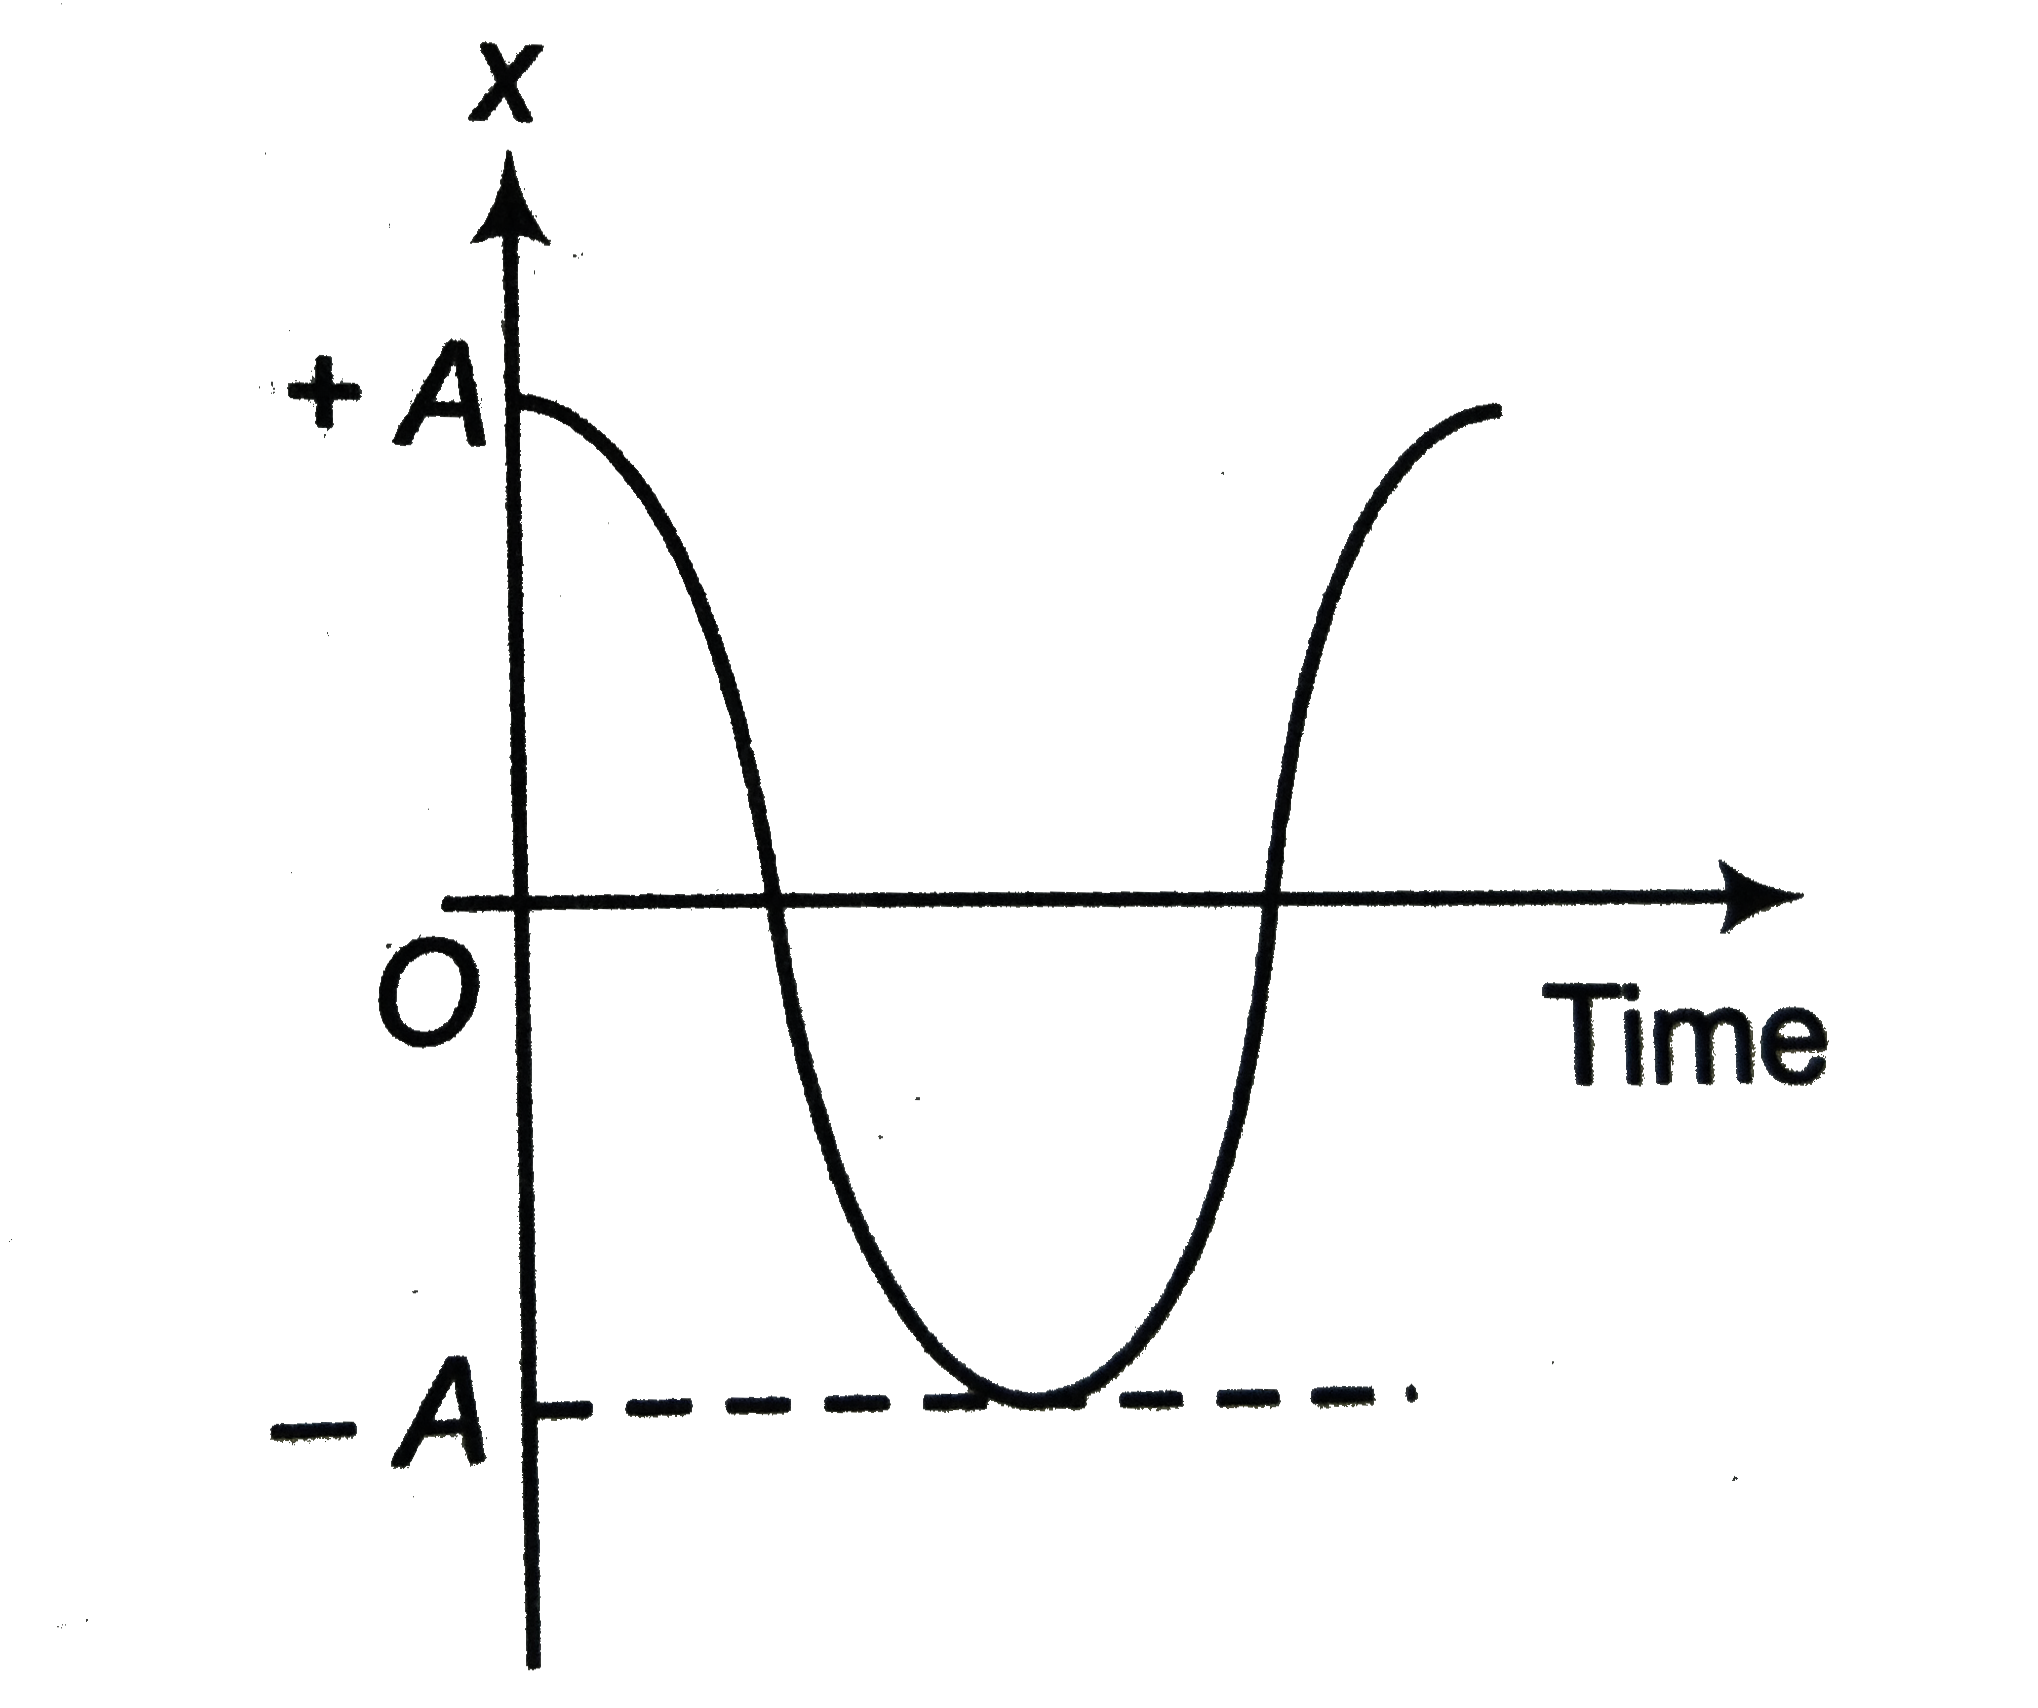
View SolutionThe displacement - time (x−t) graph of a particle executing simple harmonic motion is shown in figure. The correct variation of net force F action on the particle as a function of time is
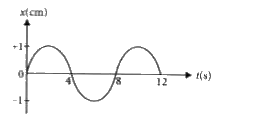
View SolutionThe x-t graph of a particle undergoing SHM is as shown in figure. The acceleration of the particle at t=2/3 is
View SolutionThe velovity-time graph of a particle moving in a straitht line is shown in . The acceleration of the particle at t=9s is.
 .
.
View Solution

