Which of the following is the graph showing stress-strain variation for elastomers ?
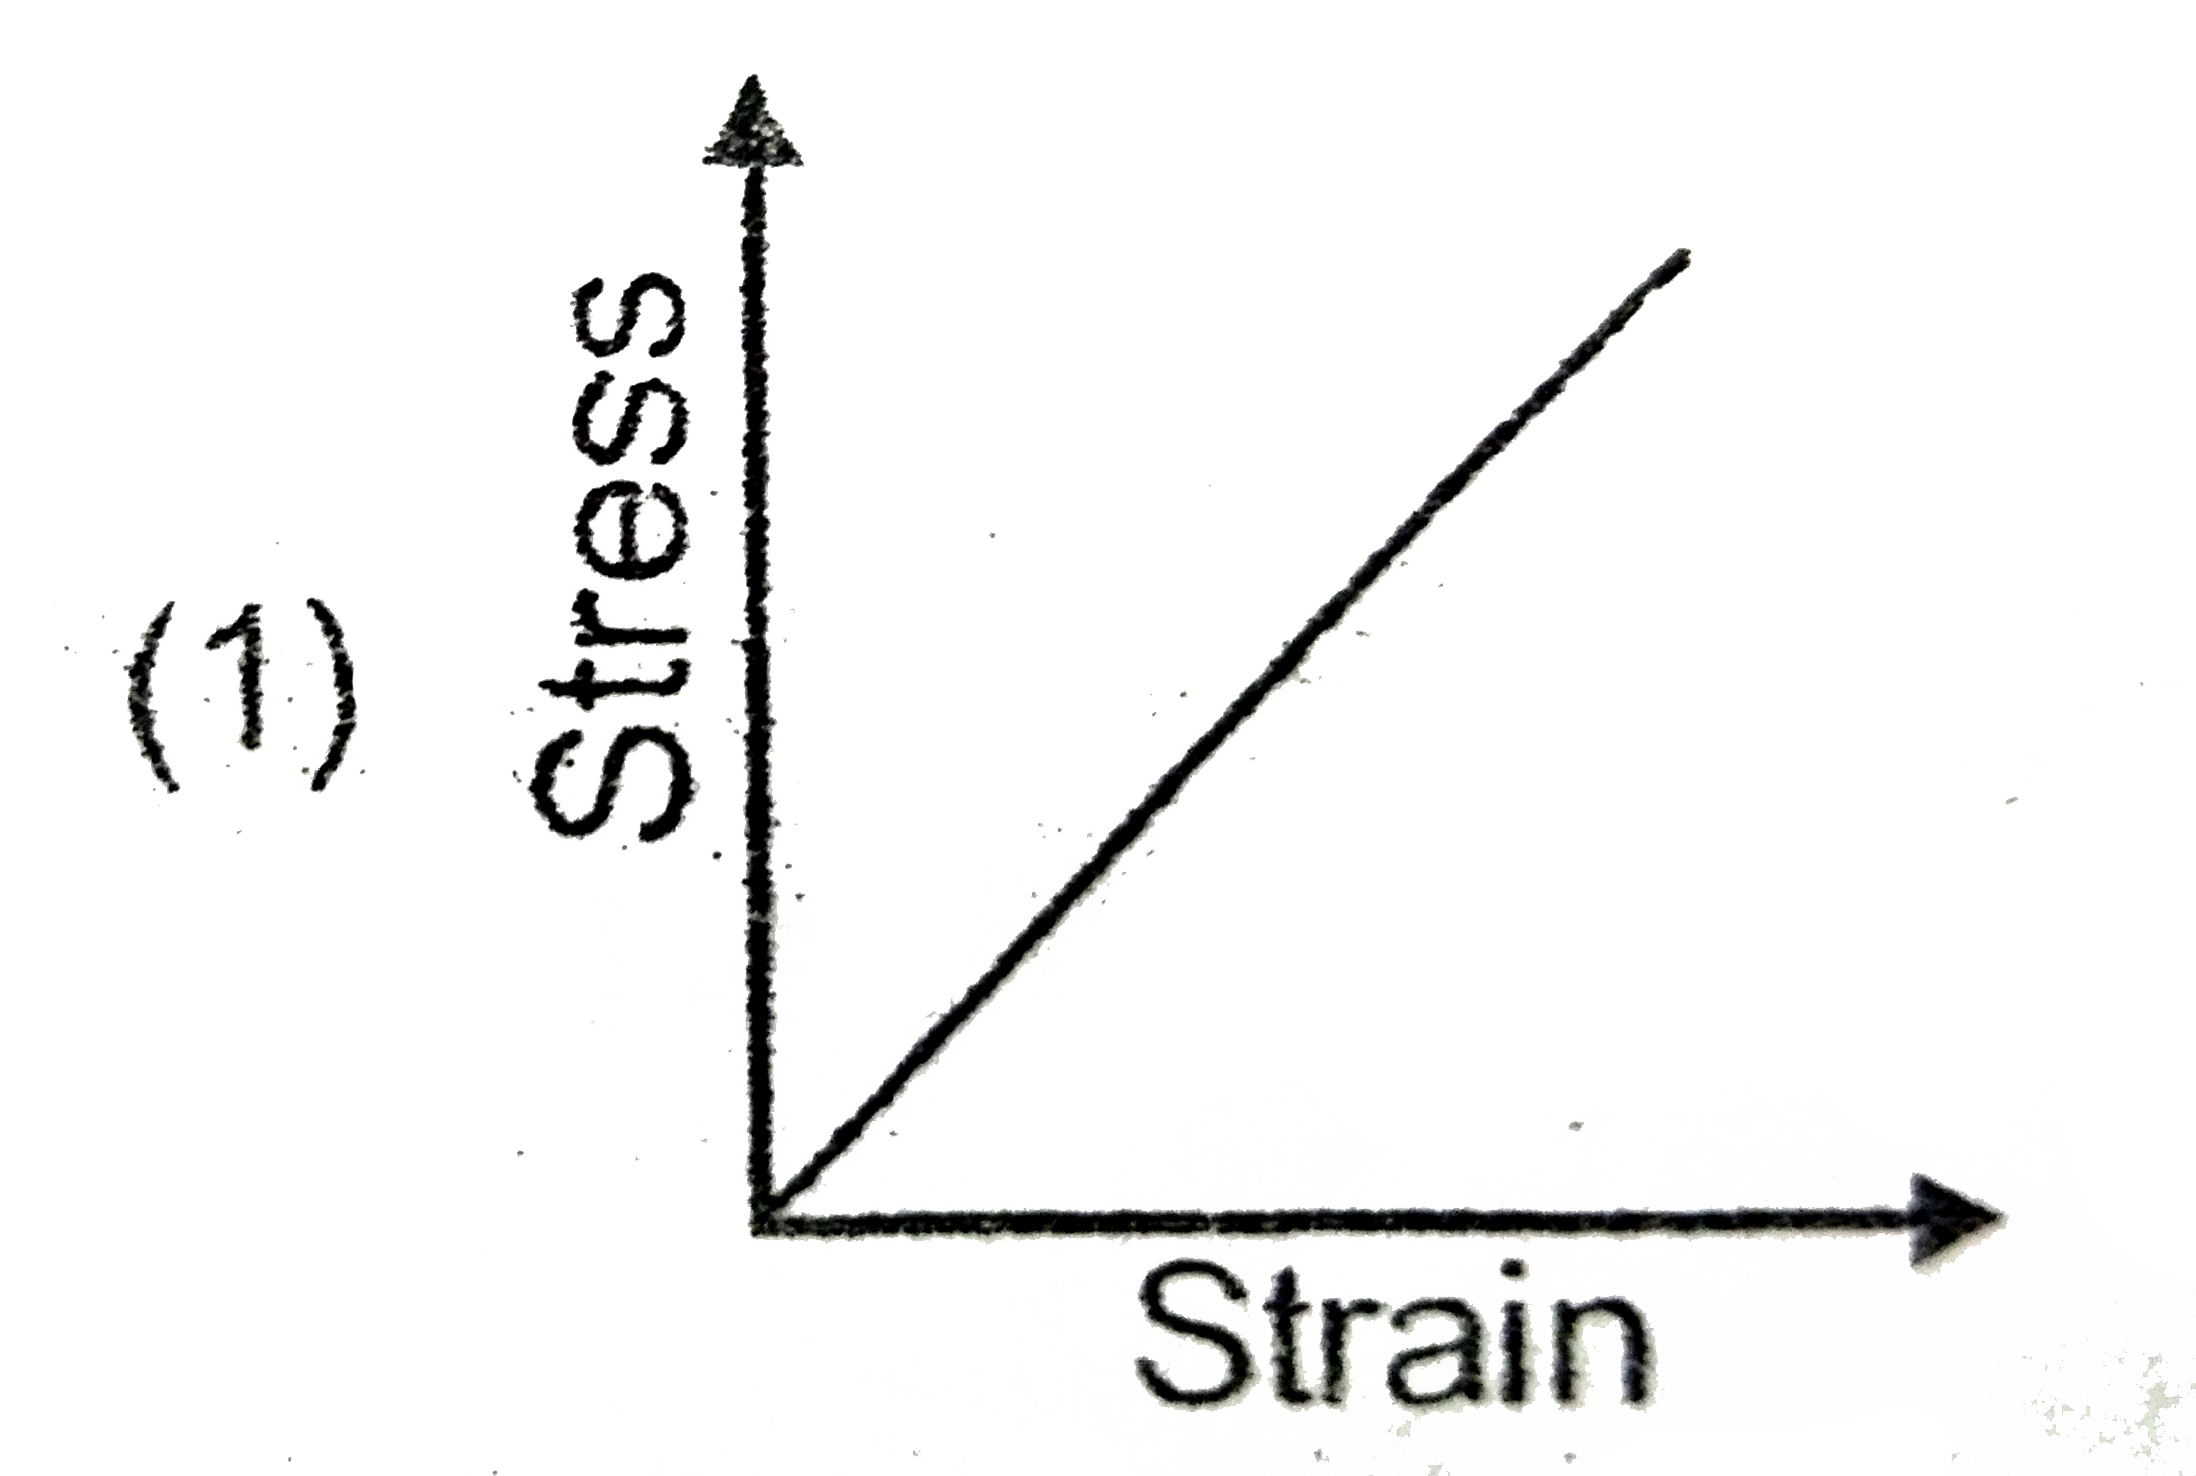
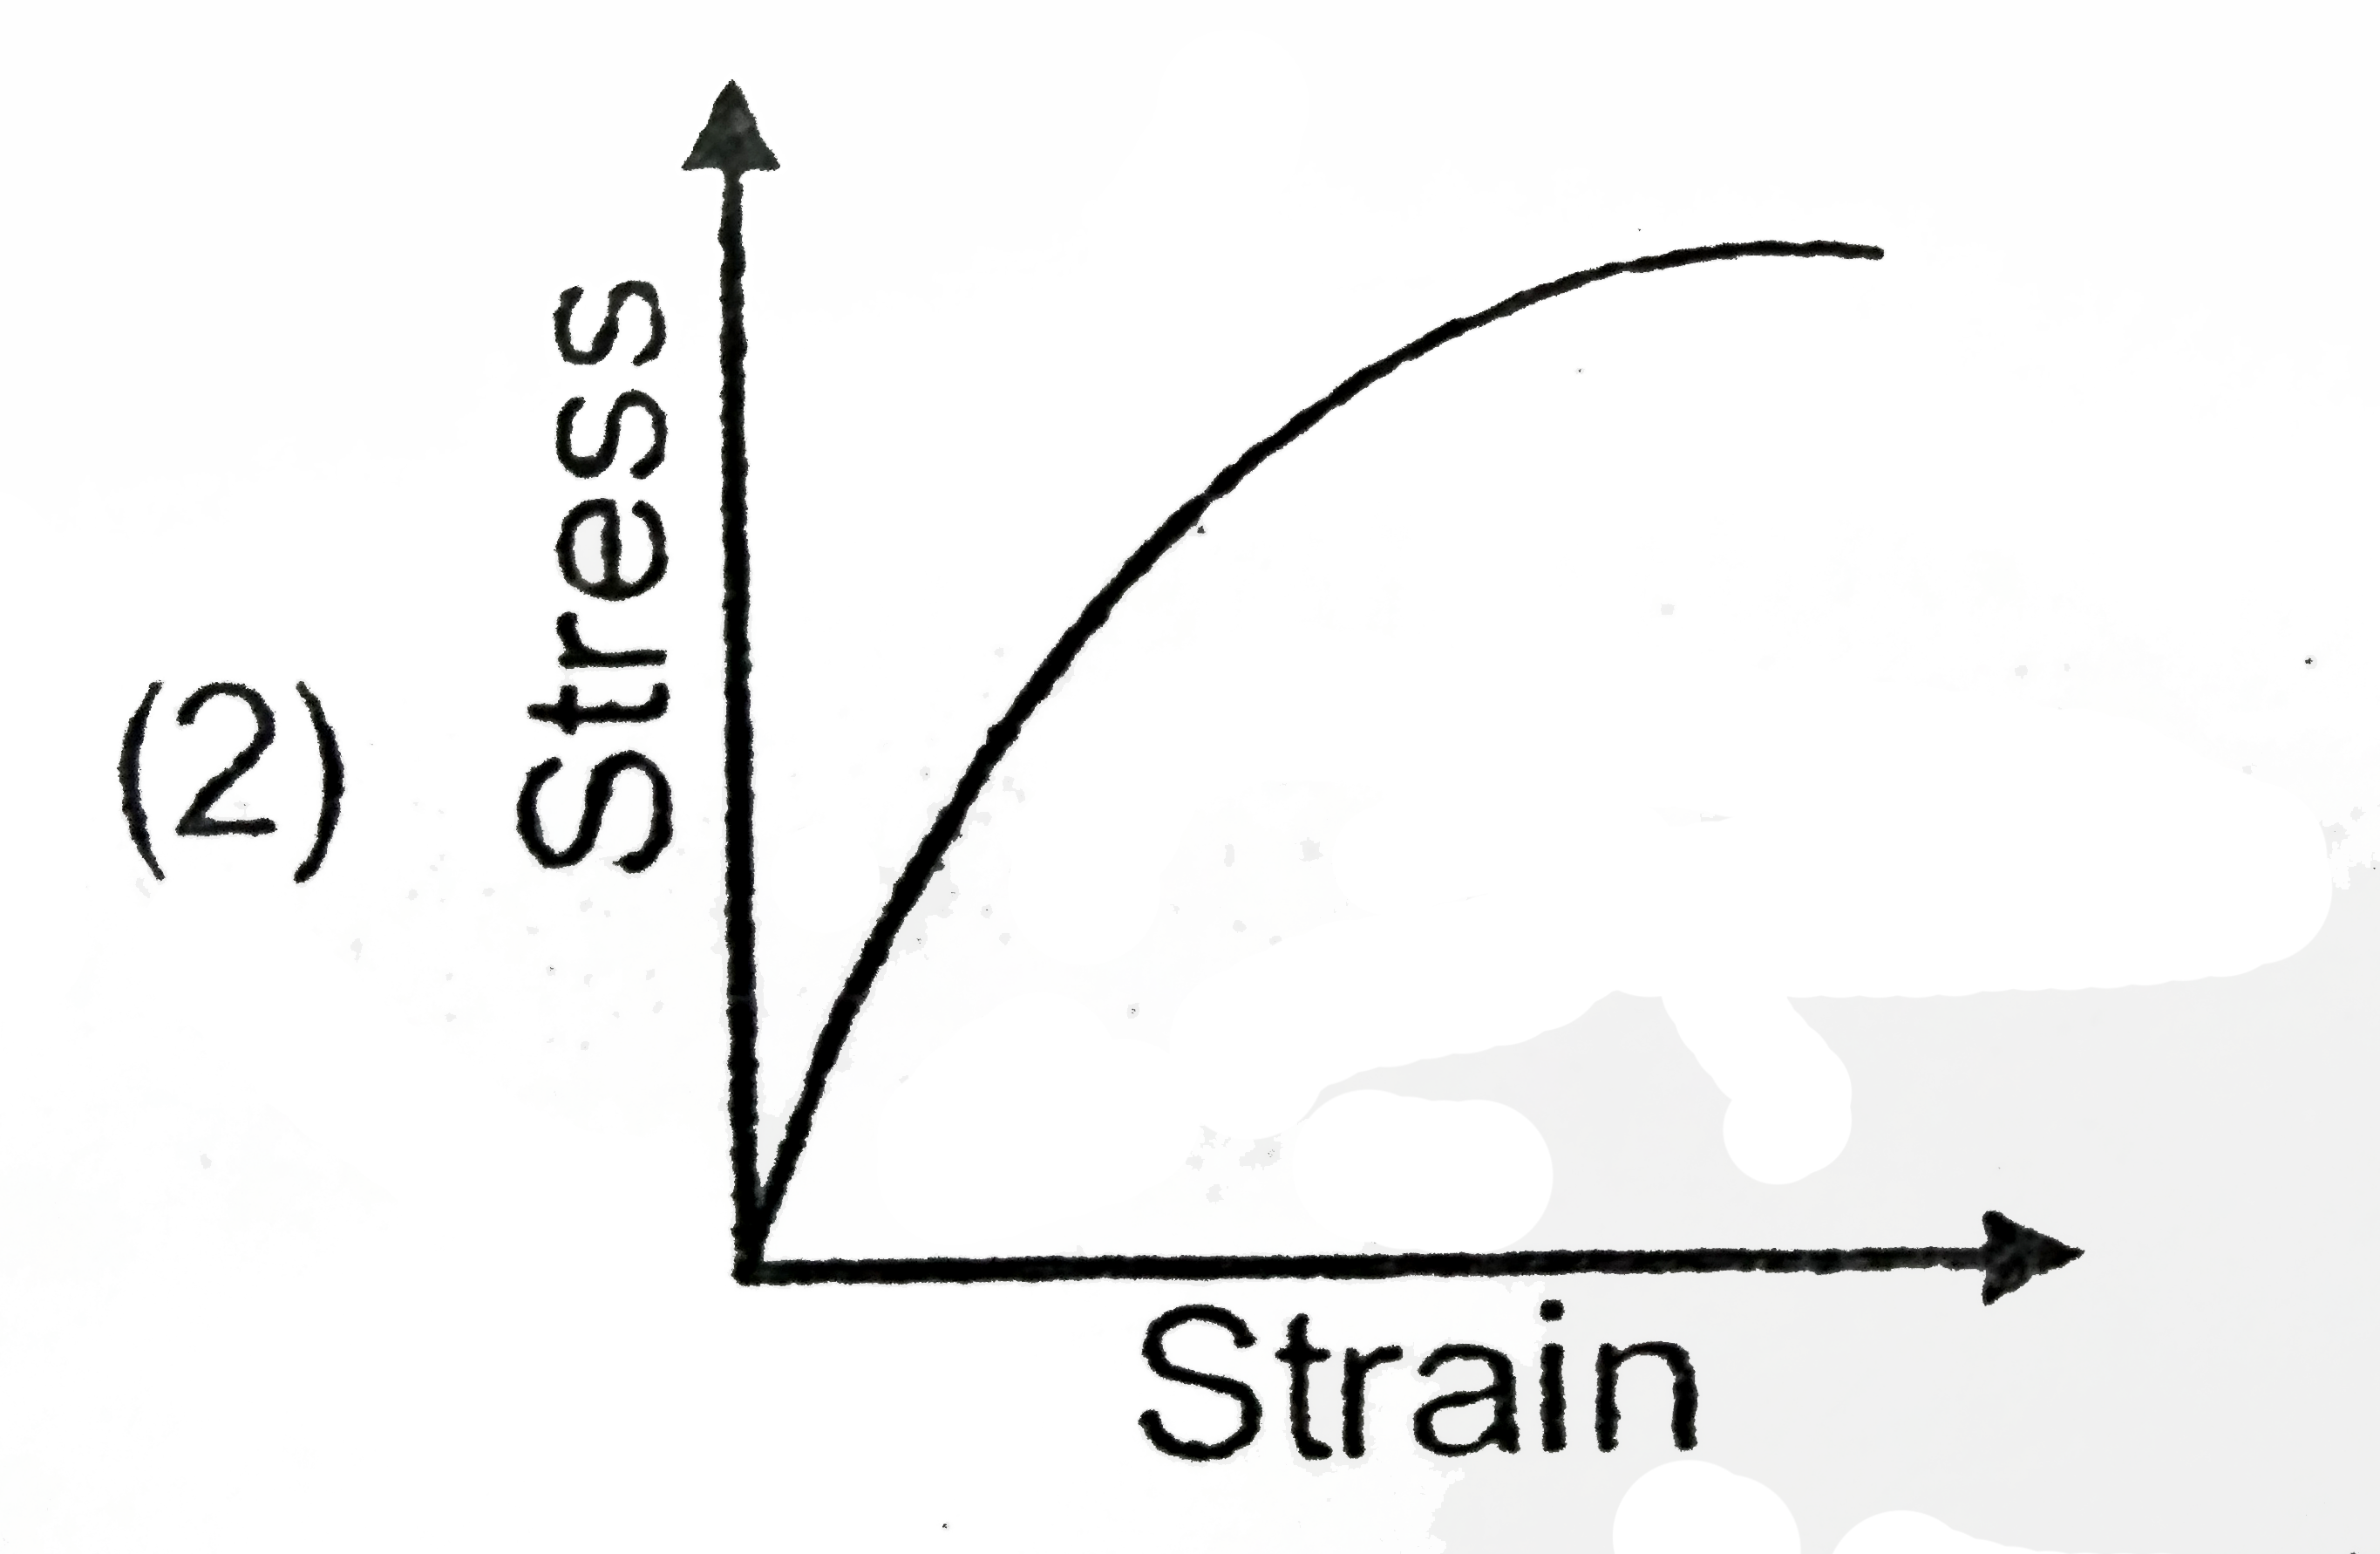
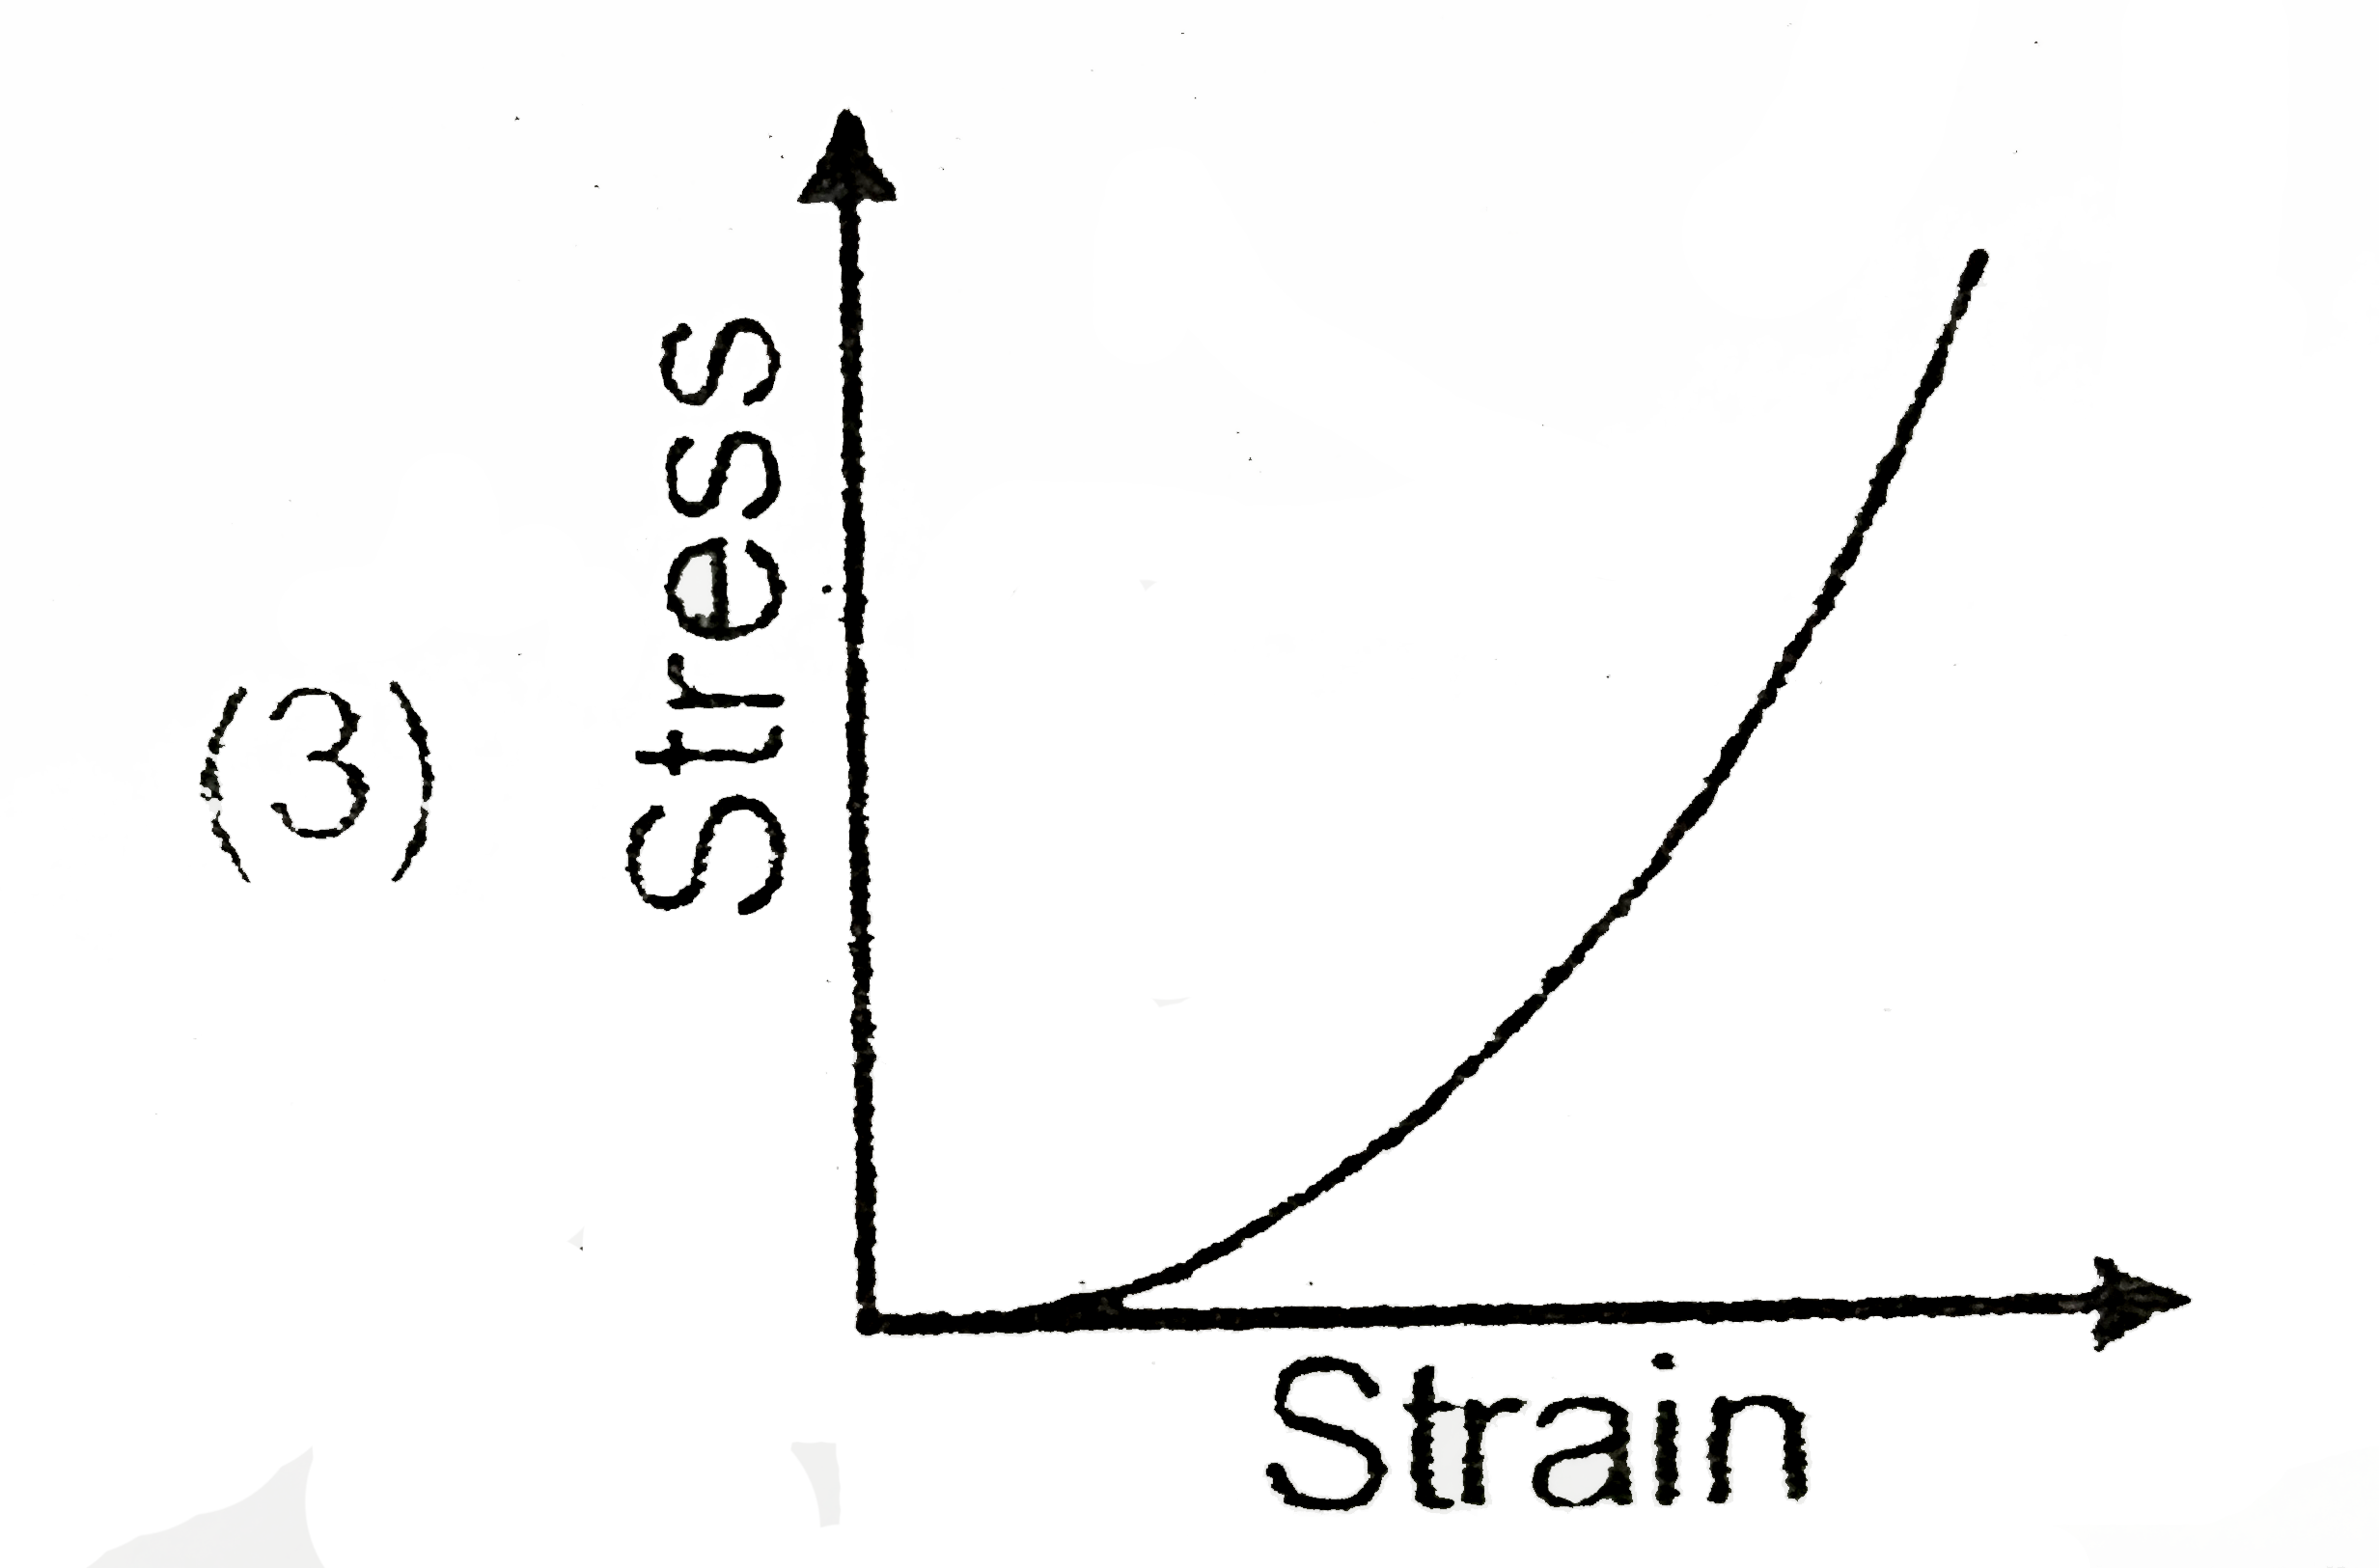
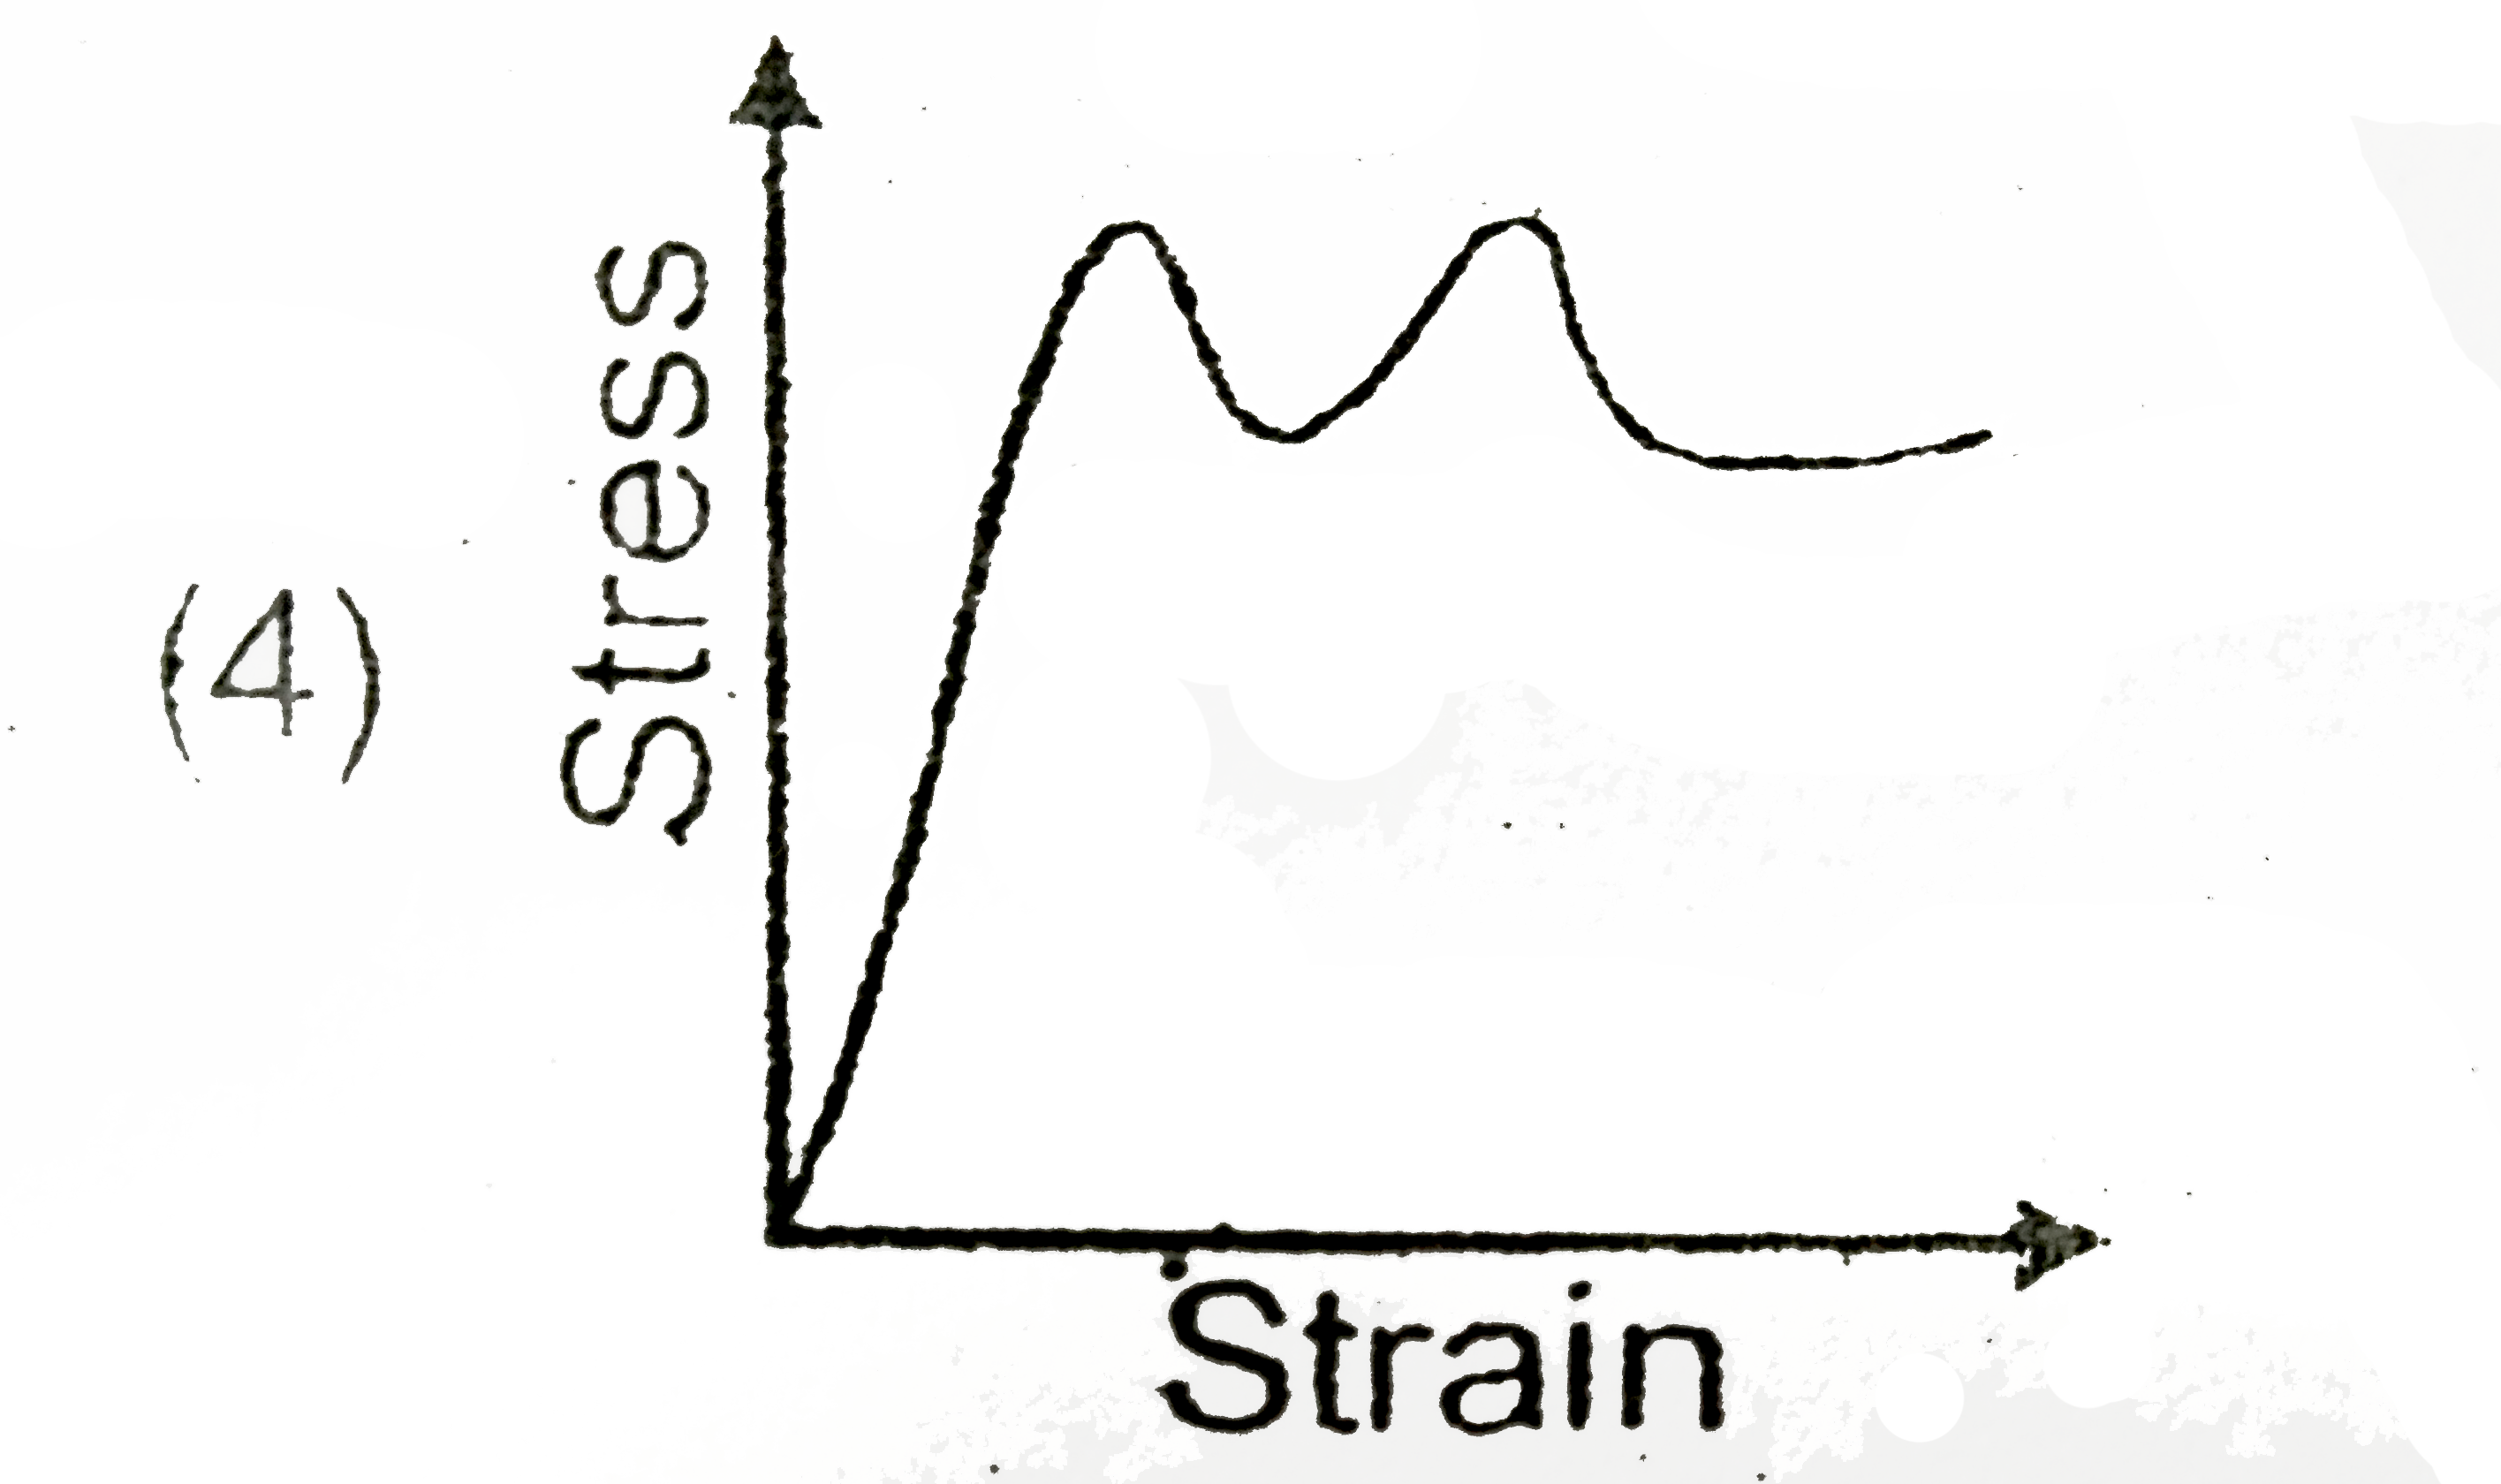
The correct Answer is:C
Step by step video, text & image solution for Which of the following is the graph showing stress-strain variation for elastomers ? by Physics experts to help you in doubts & scoring excellent marks in Class 12 exams.
Updated on:21/07/2023Topper's Solved these Questions
- MECHANICAL PROPERTIES OF SOLIDSBOOK - AAKASH INSTITUTECHAPTER - MECHANICAL PROPERTIES OF SOLIDSEXERCISE - Assignment (SECTION - B)
15 Videos
- MECHANICAL PROPERTIES OF SOLIDSBOOK - AAKASH INSTITUTECHAPTER - MECHANICAL PROPERTIES OF SOLIDSEXERCISE - Assignment (SECTION - C)
2 Videos
- MECHANICAL PROPERTIES OF SOLIDSBOOK - AAKASH INSTITUTECHAPTER - MECHANICAL PROPERTIES OF SOLIDSEXERCISE - Try Yourself
32 Videos
- MECHANICAL PROPERTIES OF FLUIDSBOOK - AAKASH INSTITUTECHAPTER - MECHANICAL PROPERTIES OF FLUIDSEXERCISE - SECTION - J
9 Videos
- Mock test 03BOOK - AAKASH INSTITUTECHAPTER - Mock test 03EXERCISE - EXAMPLE
37 Videos
Similar Questions
Knowledge Check
Which of the following is an elastomer?
ABakeliteBPolytheneCBuna-SDPolystyrenWhich of the following is an elastomer?
AVulcanized rubberBDacronCPolystyreneDMalamineWhich of the following is an elastomer?
AVulcanized rubberBDacronCPolystyreneDMelamine
Which of the following is an example of elastomer ?
View SolutionWhich of the following is FALSE for elastomers?
View SolutionWhich of the following graphs shows the variation of acceleration due to gravity g with depth h from the surface of the earth ?
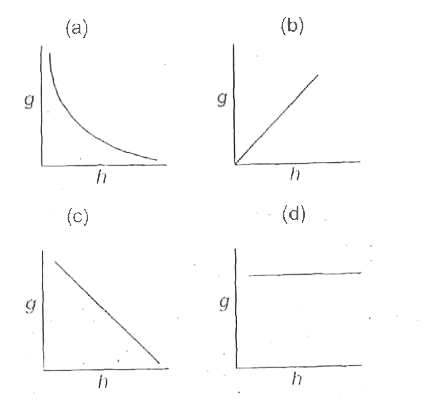
View SolutionWhich one of the following graphs in figure shows the variation of photoelectric current (I) with voltage (V) between the electrodes in a photoelectric cell?
View SolutionWhich of the following graphs shows the correct variation in intensity of heat radiations by black body and frequency at a fixed temperature
 .
.
View Solution

