Indicator Diagram
P-T curve
P-V curve
V-T curve
Q-T curve
The correct Answer is:B
Step by step video, text & image solution for Indicator Diagram by Physics experts to help you in doubts & scoring excellent marks in Class 12 exams.
Topper's Solved these Questions
- BOOK - AAKASH INSTITUTECHAPTER - THERMODYNAMICSEXERCISE - Assignment (Section-B) Objective Type Questions (one option is correct)14videos
THERMODYNAMICS
- BOOK - AAKASH INSTITUTECHAPTER - THERMODYNAMICSEXERCISE - Assignment (Section-C) Objective Type Questions (More than one option are correct)11videos
THERMODYNAMICS
- BOOK - AAKASH INSTITUTECHAPTER - THERMODYNAMICSEXERCISE - ASSIGNMENT (SECTION -D) (Assertion - Reason Type Questions)10videos
THERMODYNAMICS
- BOOK - AAKASH INSTITUTECHAPTER - THERMAL PROPERTIES OF MATTEREXERCISE - Assignment (Section-J) Akash Challengers Questions7videos
THERMAL PROPERTIES OF MATTER
- BOOK - AAKASH INSTITUTECHAPTER - UNITS AND MEASUREMENTSEXERCISE - ASSIGNMENT (SECTION - D)15videos
UNITS AND MEASUREMENTS
Similar Questions
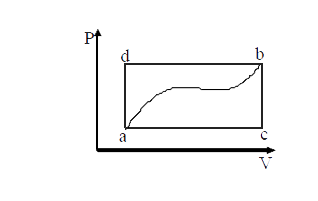
In the adjoined figure the indicator diagram of an ideal thermodynamic gas system is represented. If the change in internal energy along the path acb is 10 calorie then change in internal energy along the path bda will be
 View Solution
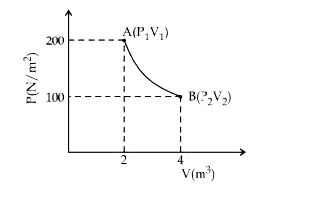
One mole of an ideal gas at 27∘C is taken from A to B as shown in the given PV indicator diagram. The work done by the system be …………… ×10−1J.
[Given : R = 8.3 J/mole K, In2 = 0.6931] (Round off to the nearest integer)
 View Solution
Knowledge Check
- Question 1 - Select One
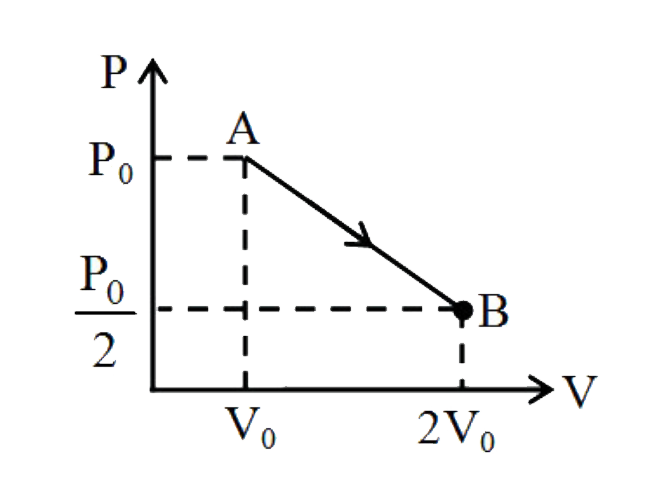
An ideal monoatomic gas undergoes an expansion from state A to state B following a process which is shown in the indicator diagram. If initially during the expansion, the gas was absorbing heat and later on it was rejecting heat, then what was the volume of the gas when it started rejecting the heat?
 AV=32V0BV=85V0CV=158V0DV=127V0
 - Question 2 - Select One
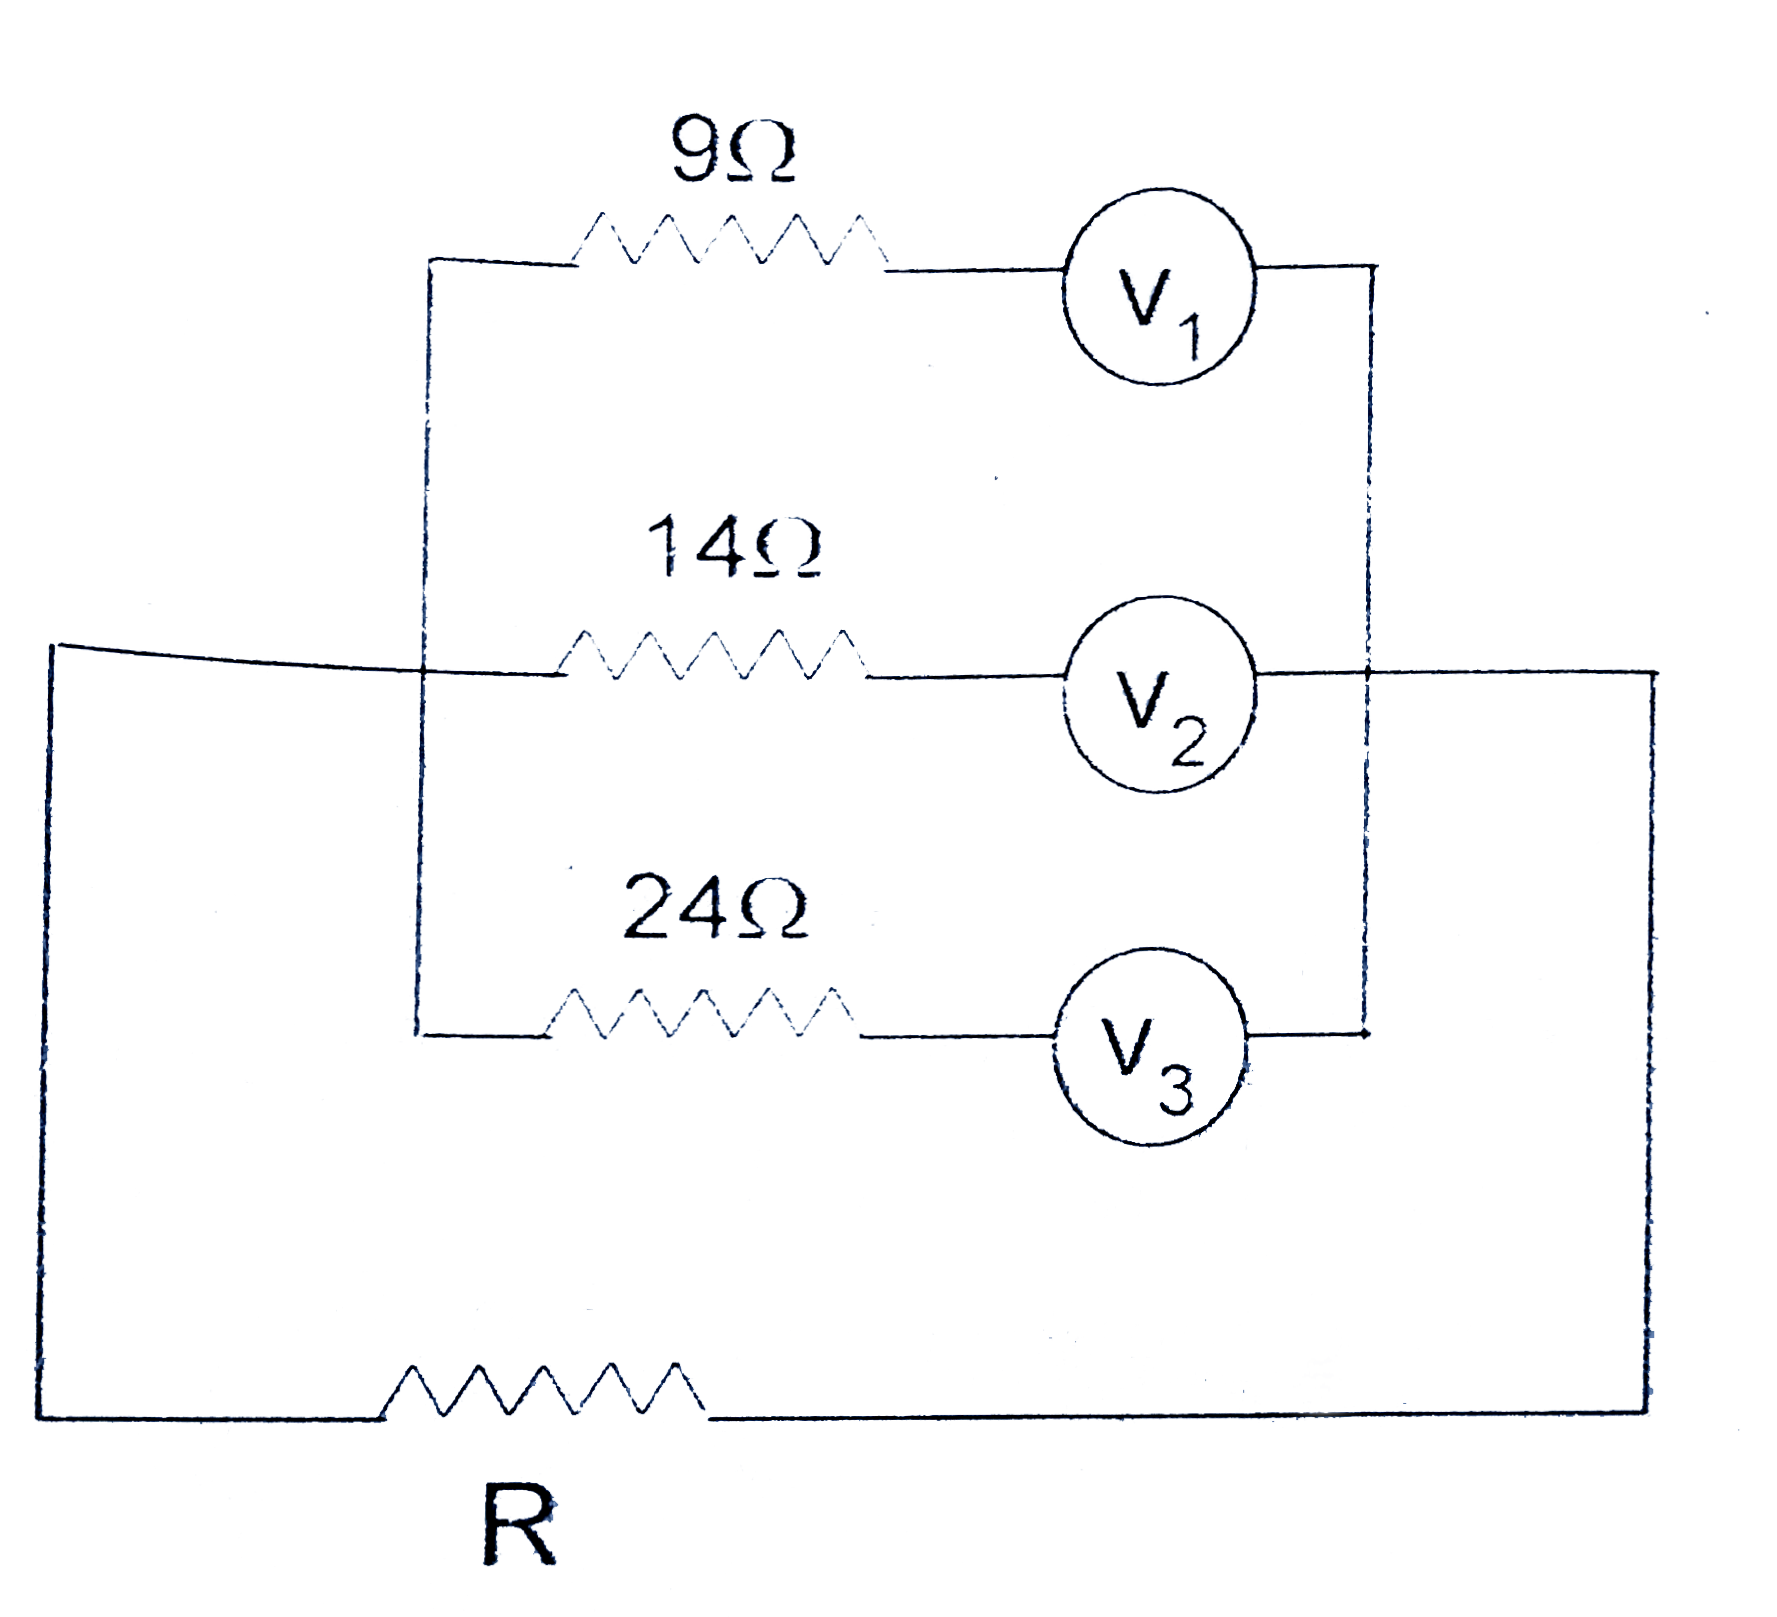
The figure shows a portion of a circuit. Resistor are known and indicated on diagram and voltmeter are identical. If voltmeters v1 and v2 reads 7.5v and 5v respecticely then reading of v3
 A0vB10vC2.5vD3.0v
 - Question 3 - Select One
In the given diagram, which is not related with (A) as indicated in diagram?
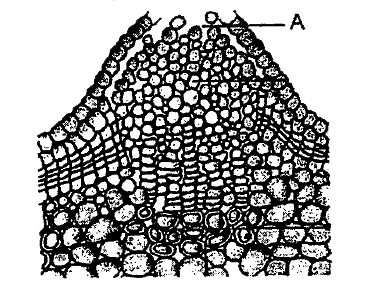 AComplimentary cellsBInvolved in exchange of gasesCLens shaped opening called lenticelsDFound in herbaceous trees
P−V indicator diagram for a given sample of monoatomic idela gas is shown in figure. If the average molar specific heat capacity of the system for the process ABCD is xR4 than find value of x:(R is a uniersal gas constant)
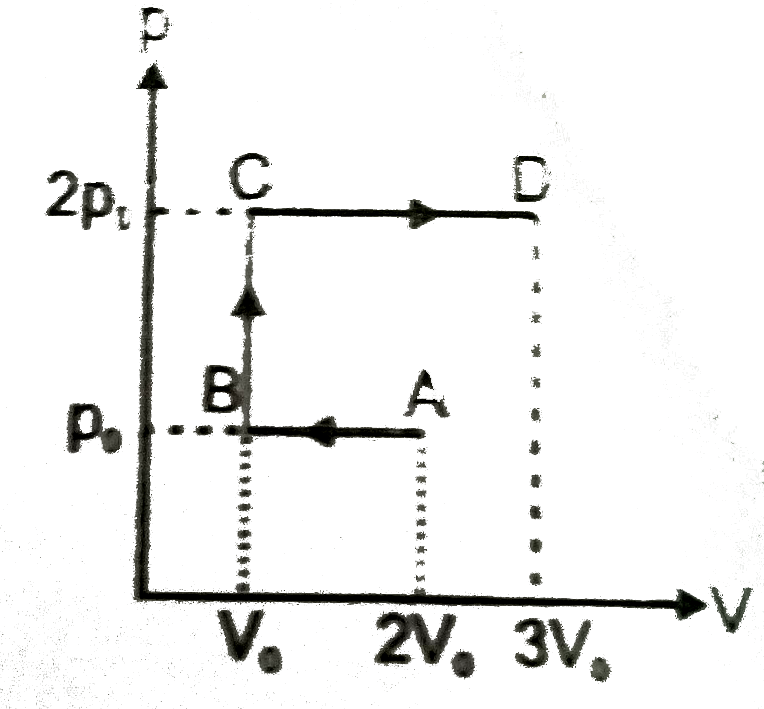 View Solution
In the show indicator diagram over pressure - volume scales 'n' moles of an ideal gas is cycled . If the temperature of the gas in the state X and Y are respectively TXandTY . Temperature of the gas in the state Z is the (All temperature are in absolute scale )
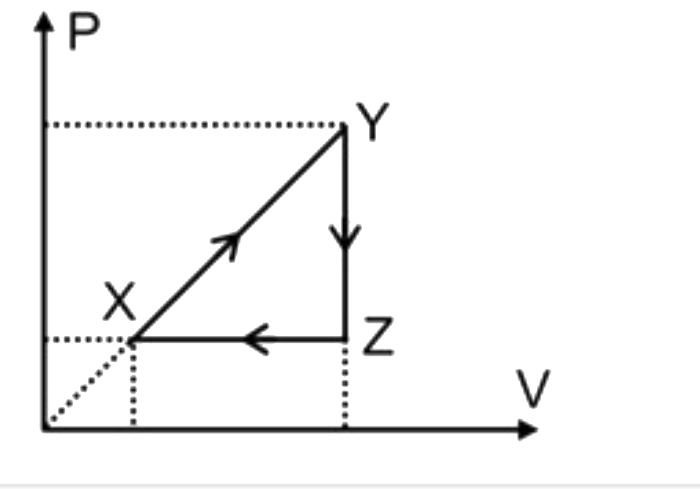 View Solution
Which is not a feature w.r.t. given diagram of mitochondria (as indicated in diagram)?
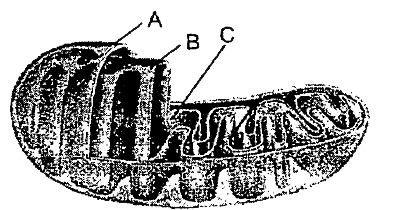 View Solution
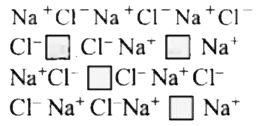
Crystal defect indicated in the diagram below is
 View Solution
That type of crystal defect is indicated in the diagram below
 View Solution

