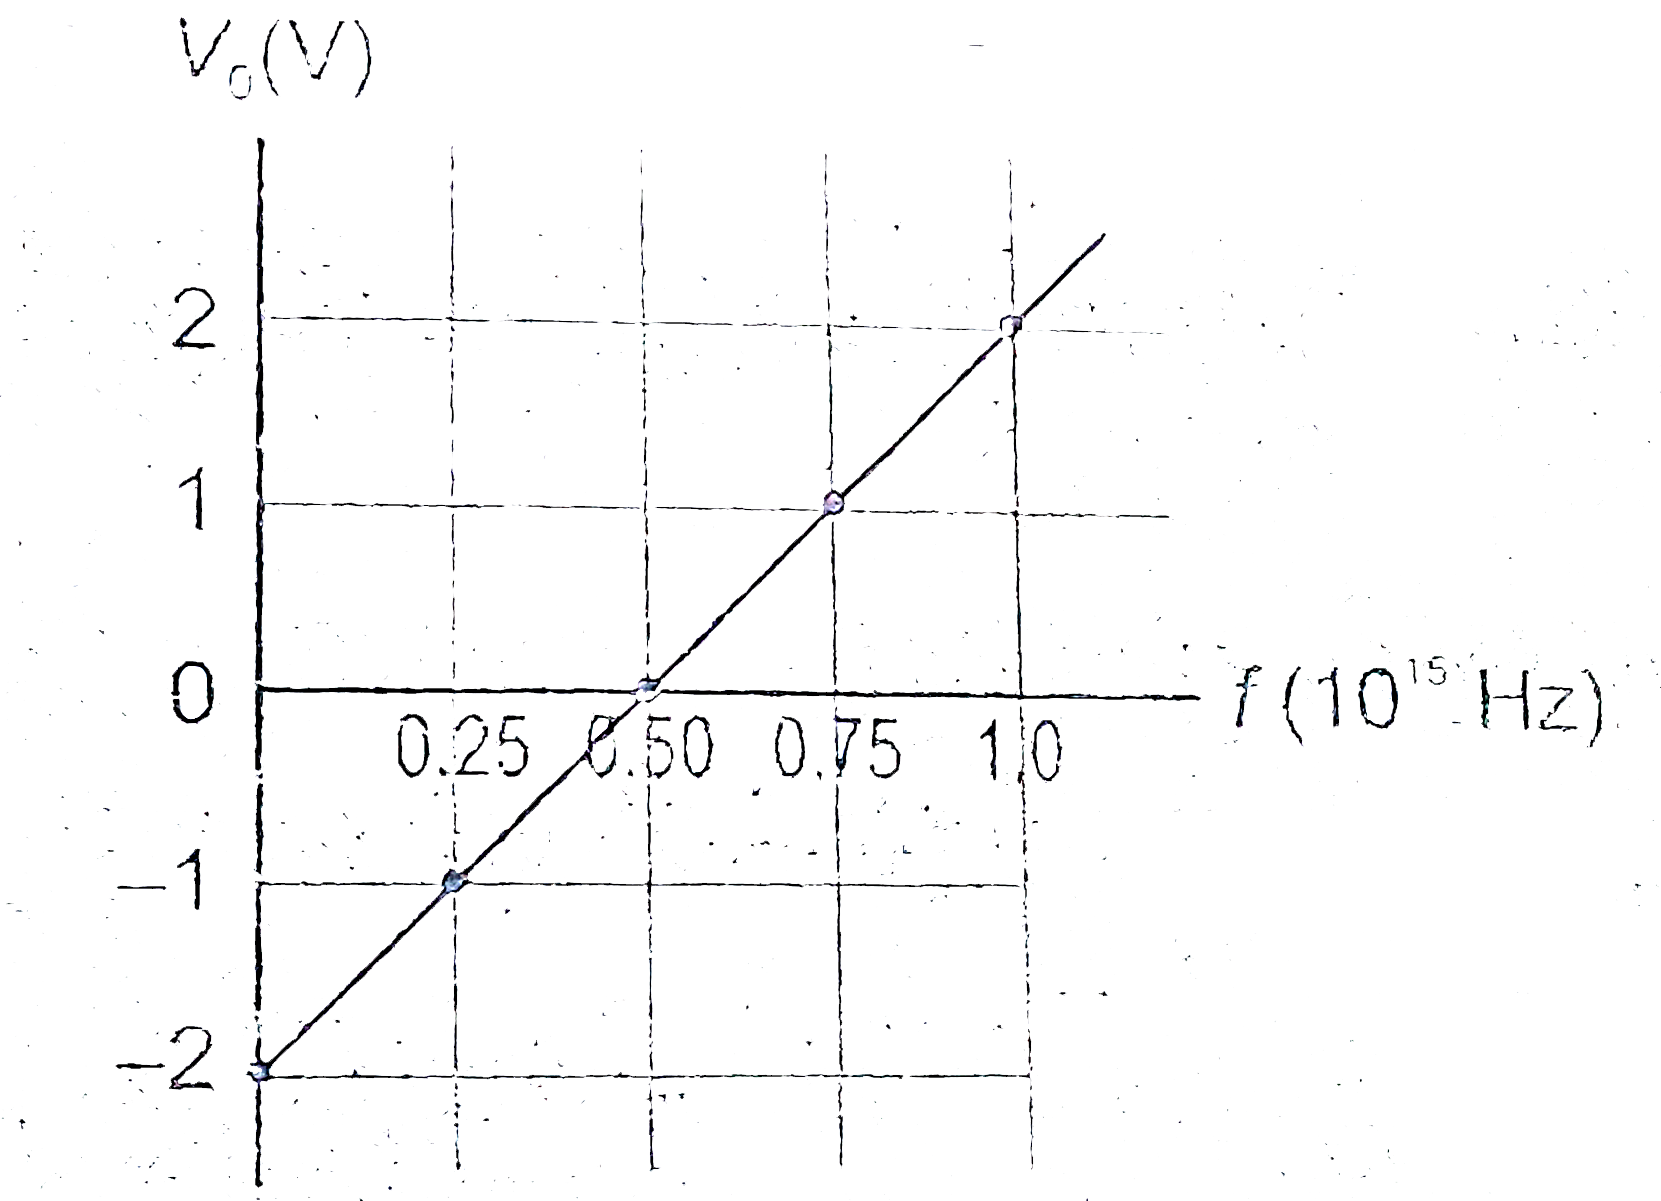
The following figure shows a graph for the stopping potential as a function of the frequency of incident light illuminating a metal surface. Find the photoelectric work function for this surface.

The correct Answer is:2.0 eV
2.0 eV
Topper's Solved these Questions
- DUAL NATURE OF RADIATION AND MATTER BOOK - AAKASH INSTITUTECHAPTER - DUAL NATURE OF RADIATION AND MATTER EXERCISE - ASSIGNMENT SECTION A. Objective (Only one answer)
50 Videos
- DUAL NATURE OF RADIATION AND MATTER BOOK - AAKASH INSTITUTECHAPTER - DUAL NATURE OF RADIATION AND MATTER EXERCISE - ASSIGNMENT SECTION B.Objective (Only one answer)
6 Videos
- DUAL NATURE OF RADIATION AND MATTER BOOK - AAKASH INSTITUTECHAPTER - DUAL NATURE OF RADIATION AND MATTER EXERCISE - ASSIGNMENT (SECTION-D)
10 Videos
- CURRENT ELECTRICITYBOOK - AAKASH INSTITUTECHAPTER - CURRENT ELECTRICITYEXERCISE - ASSIGNMENT SECTION-J
10 Videos
- ELECTRIC CHARGES AND FIELDS BOOK - AAKASH INSTITUTECHAPTER - ELECTRIC CHARGES AND FIELDS EXERCISE - SECTION -J(Aakash Challengers Questions)
5 Videos
Similar Questions
Define photoelectric effect. Draw a graph to show the variation of stopping potential with frequency of incident radiation on a metal plate.
View SolutionDraw and explain the graph showing the variation of stopping potential with frequency of incident radiation in relation to photoelectric effect.
View Solution
Knowledge Check
The stopping potential as a function of the frequency of the incident radiation is plotted for two different photoelectric surfaces A and B . The graphs show that work function of A is
 AGreater than that of BBSmaller than that of BCEqual to that of BDNo inference can be drawn about their work functions from the given graphs
The stopping potential as a function of the frequency of the incident radiation is plotted for two different photoelectric surfaces A and B . The graphs show that work function of A is
 AGreater than that of BBSmaller than that of BCSame as that of BDNo comparison can be done from given graphs
The slope of frequency of incident light and stopping potential for a given surface will be
AhBh/eCehDe
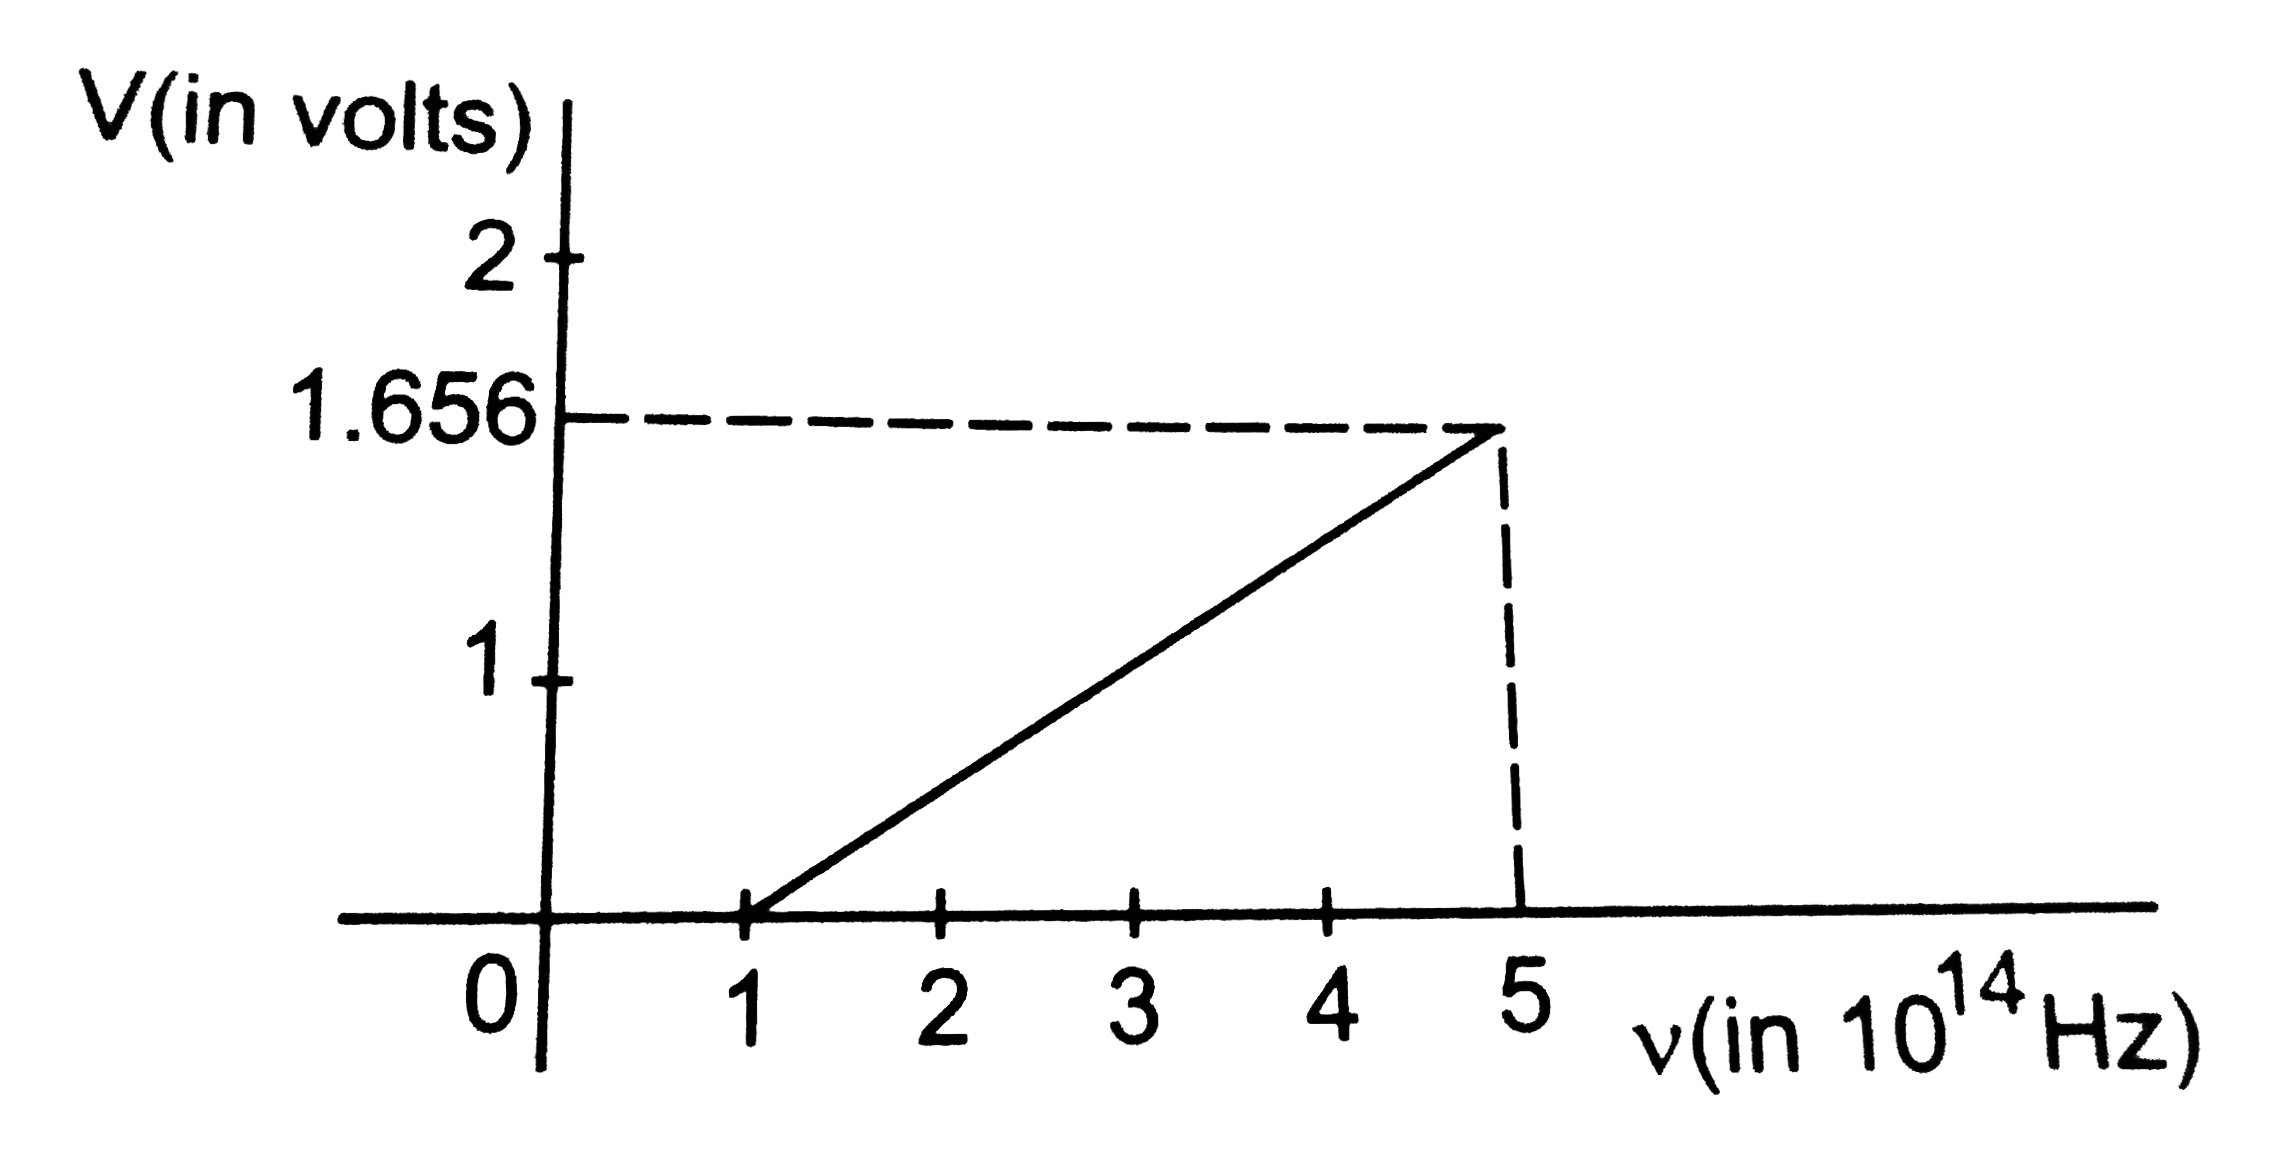
Figure is the plot of the stopping potential versus the frequency of the light used in an experiment on photoelectric effect. Find (a) the ratio h/e and (b) the work function.

View SolutionGraph between stopping potential and frequency of light as shown find the work function

View SolutionIn photoelectric effect the slope of stop of stopping potential versus frequency of incident light for a given surface will be
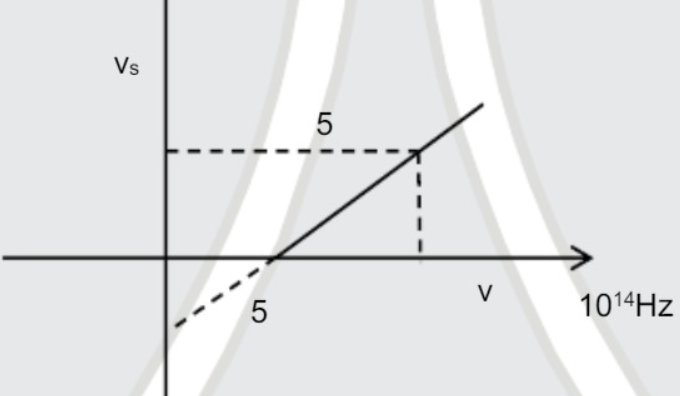
View SolutionGraph between stopping potential and frequency of photon is given in figure
_2019_CBT7_E01_021_Q01.png)
Find out work function of metal:
View SolutionIf the work function of a metal is 'ϕ' and the frequency of the incident light is 'v', there is no emission of photoelectron if
View Solution
