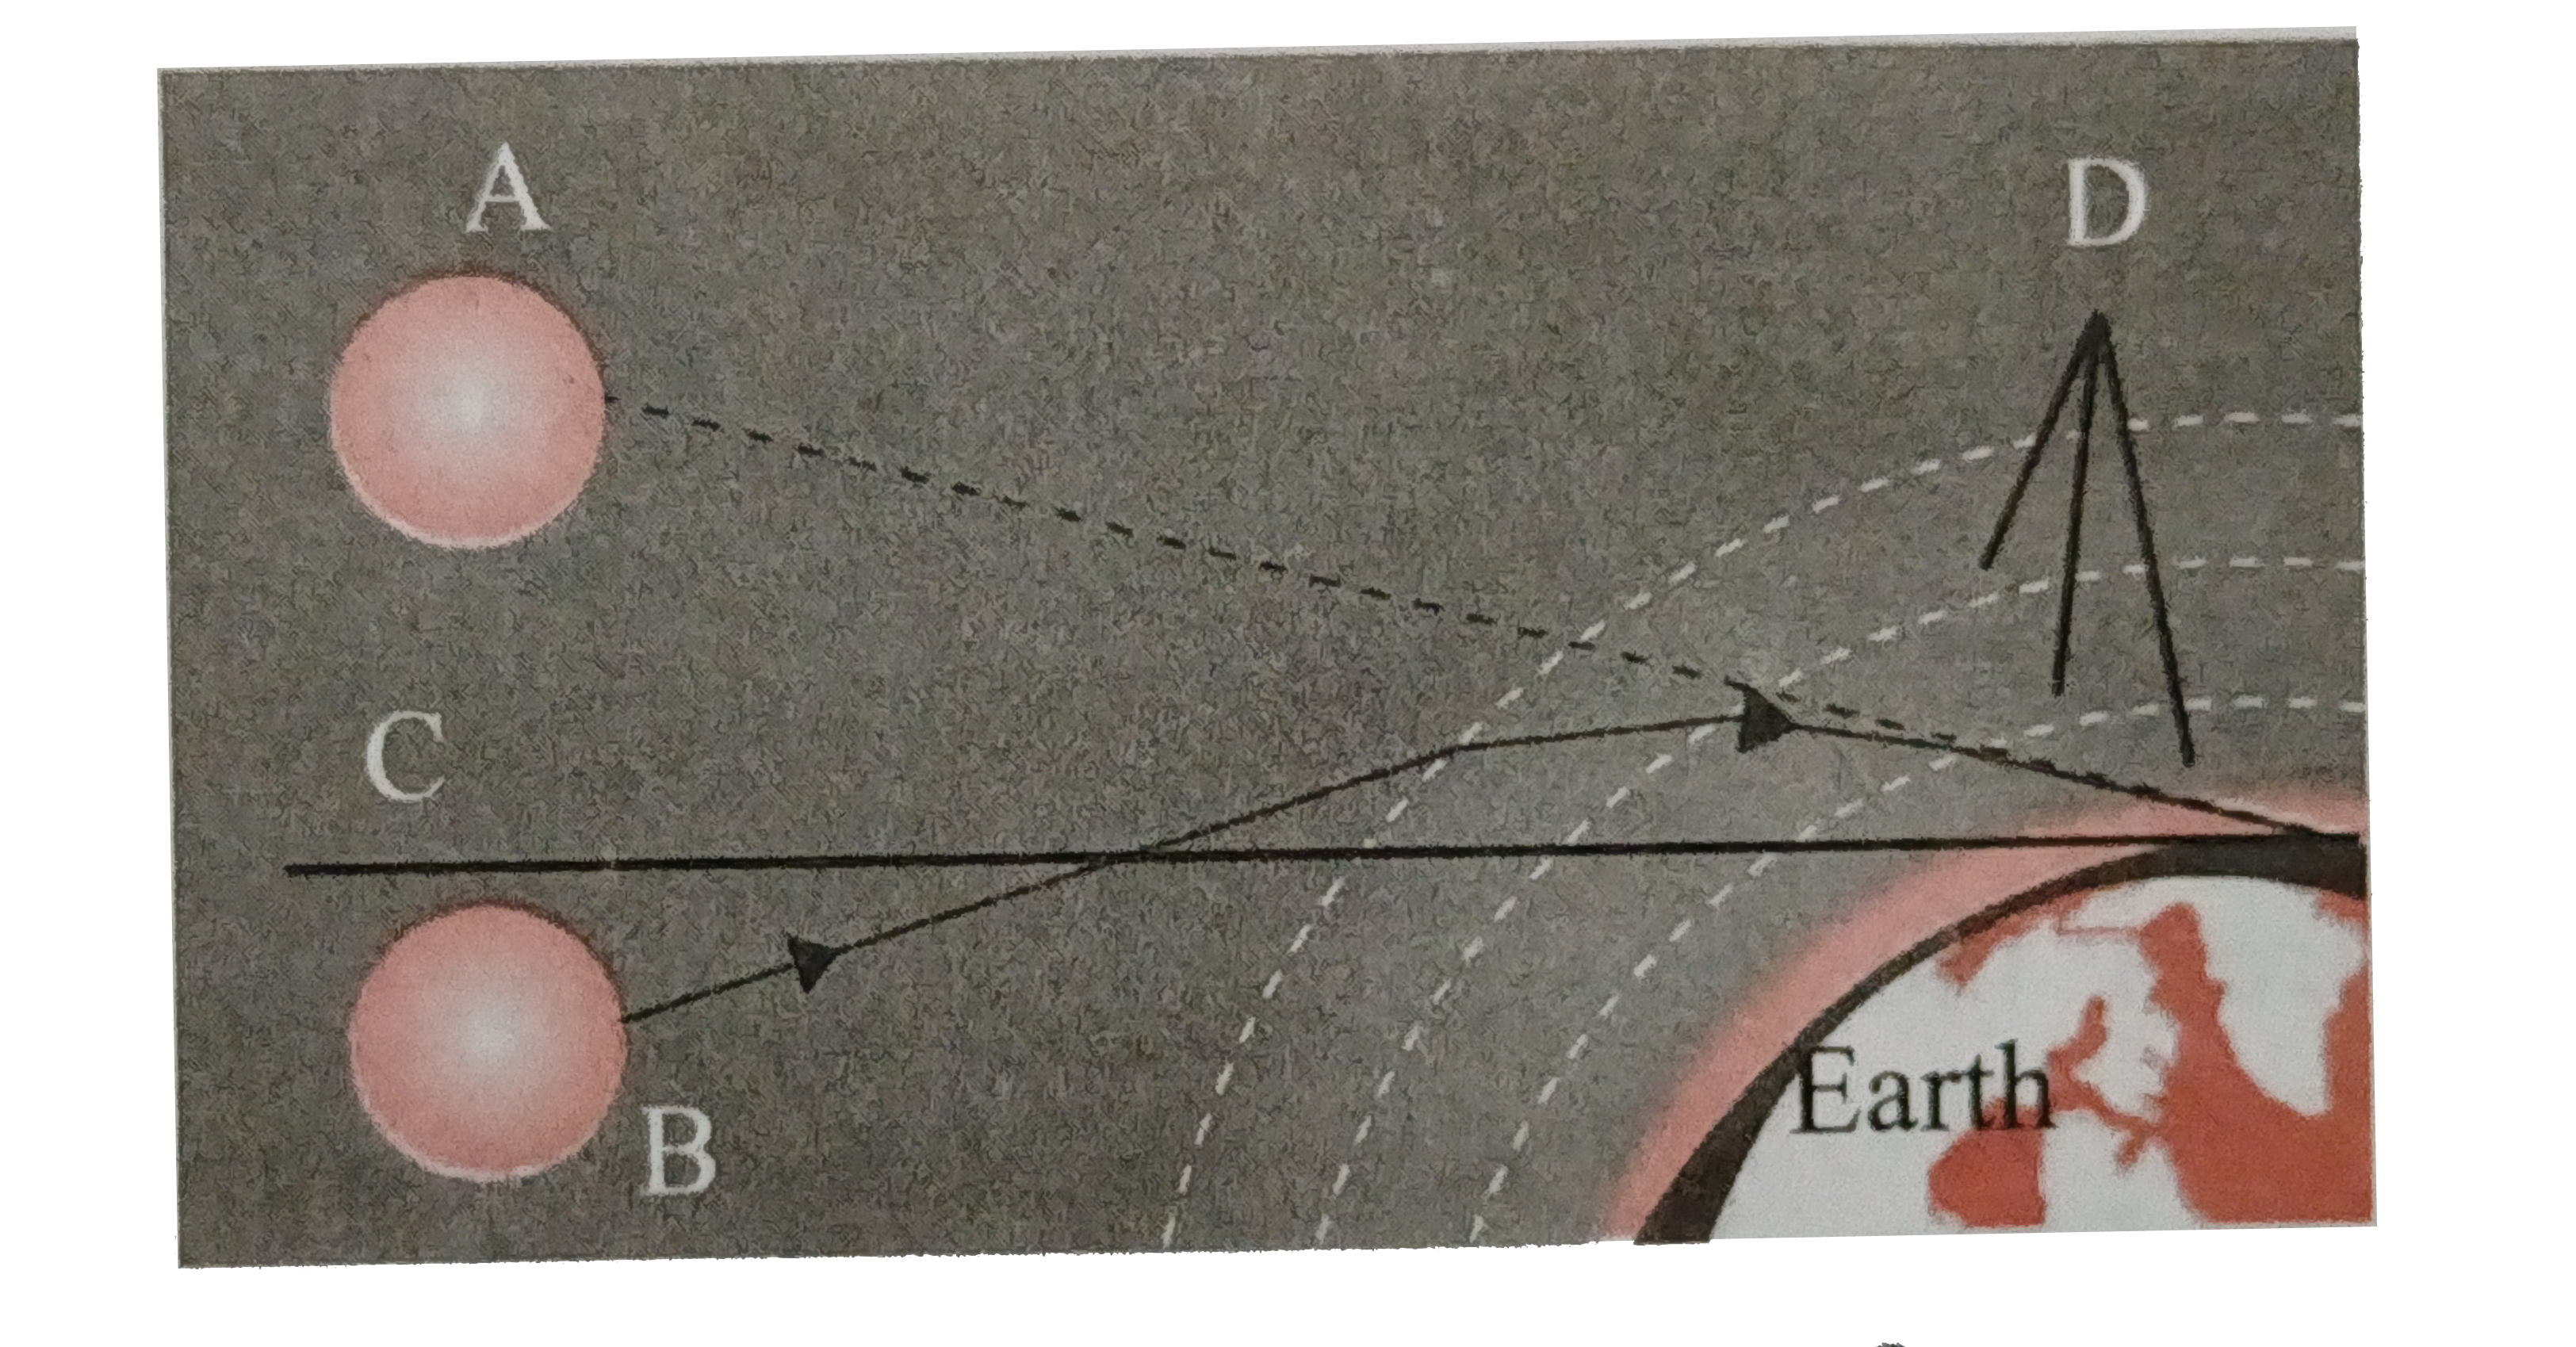
Above diagram presents
A
anaphase-I
B
metaphase-I
C
telophase-I
D
prophase-I
Text Solution
The correct Answer is:A
The given figure is showing anaphase-I of meiosis. It begins when the two chromosomes of each bivalent separate and start moving towarde opposite poles of the cell. Unlike the anaphase of mitosis, the sister chromatids remain attached at their certromeres and move together toward the poles.
|
Topper's Solved these Questions
- SOLVED PAPERS 2018BOOK - ARIHANT NEETCHAPTER - SOLVED PAPERS 2018EXERCISE - Solved Paper 2018 (AIIMS)
29 Videos
- SOLVED PAPERS 2017BOOK - ARIHANT NEETCHAPTER - SOLVED PAPERS 2017EXERCISE - Solved Paper 2017 (JIPMER)
35 Videos
- STRUCTURAL ORGANISATION IN SOME ANIMALS BOOK - ARIHANT NEETCHAPTER - STRUCTURAL ORGANISATION IN SOME ANIMALS EXERCISE - CHAPTER EXERCISES (C) MEDICAL ENTRANCES GALLERY (COLLECTION OF QUESTIONS ASKED IN NEET & VARIOUS ENTRANCE EXAMS )
48 Videos
Similar Questions
Knowledge Check
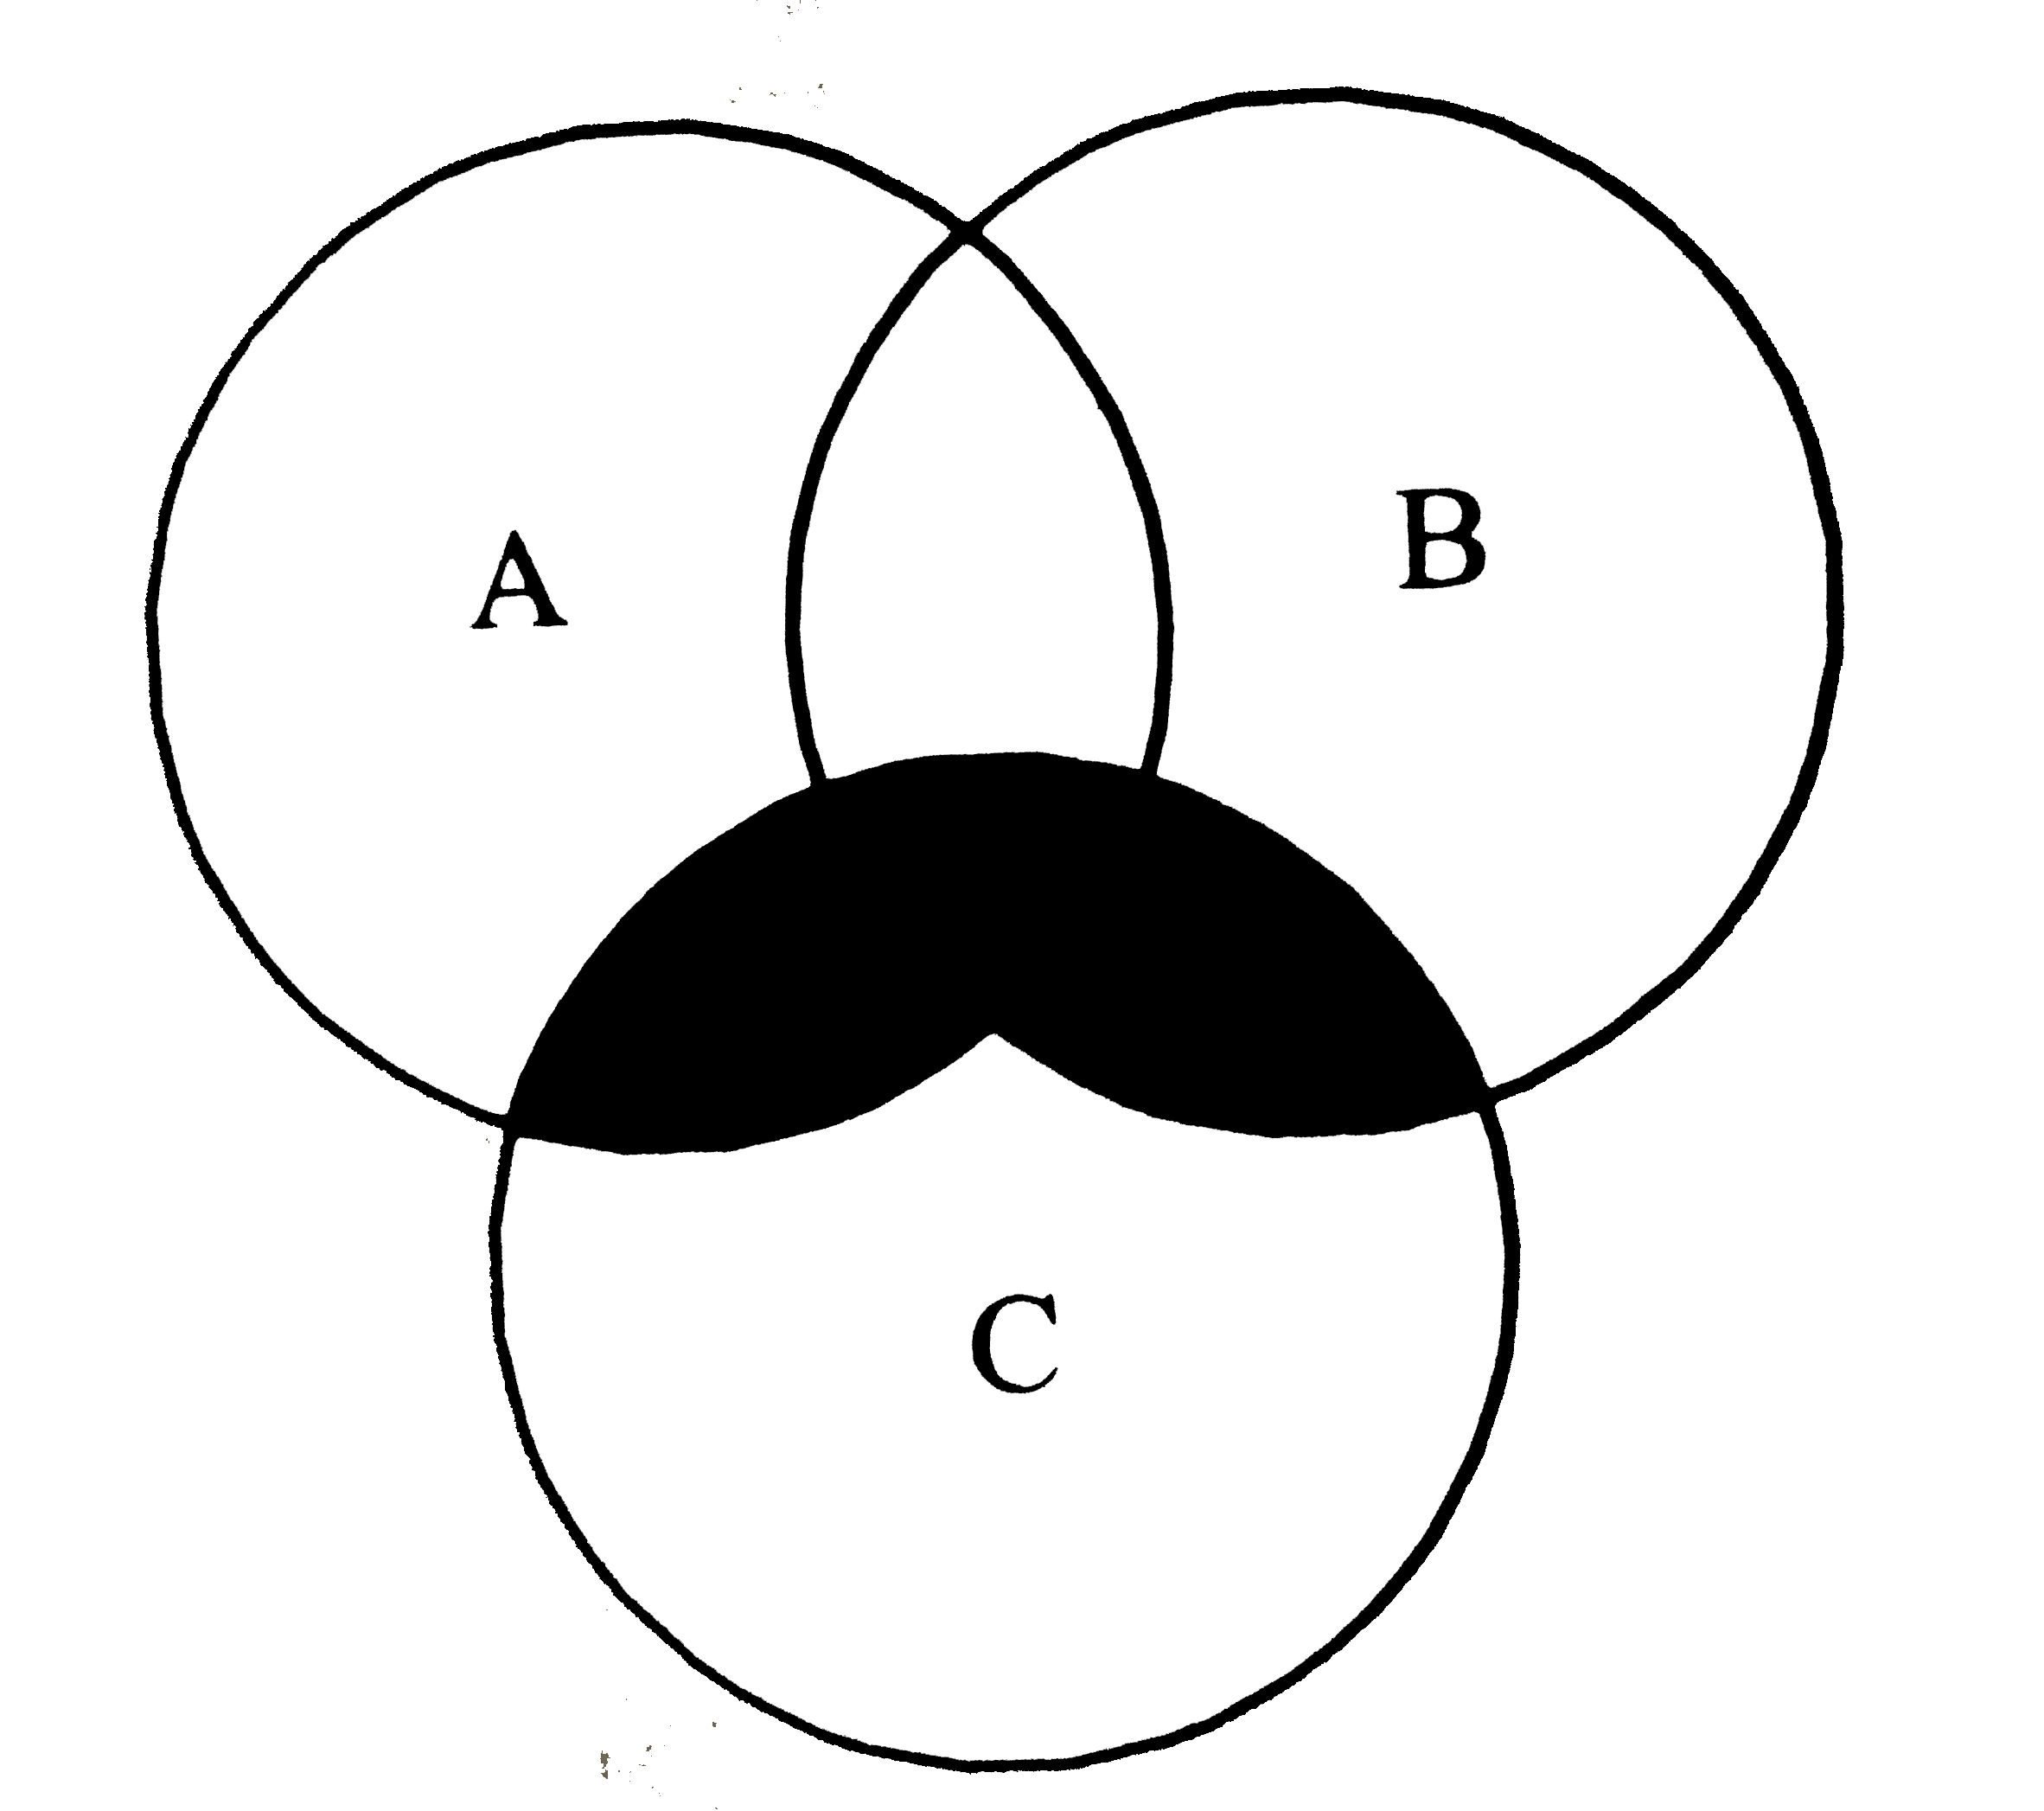
What does the shaded region in the above diagram represent?A(A∩B)∩CB(A∪B)∩CC(A∪B)−CDNone of the above
Above diagrams showsAAdaptive radiationBConvergent evolutionCReproductive isolationDArtificial selectionIn above diagram 'A' represents :
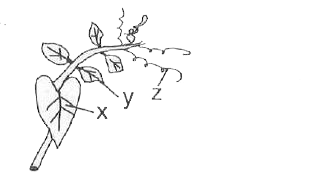
AColeoptileBShoot apexCScutellumDColeorhiza
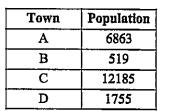
The population of four towns A, B, C and D as on 2001 are as follows:

What is the most appropriate diagrams to present the above data?
View SolutionThe populations of four towns A, B, C and D as on 2001 are as follows:

What is the most appropriate diagram to present the above data?
View Solution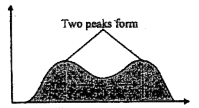
In above diagram :-
View SolutionThe populations of four towns A, B, C and D as on 2001 are as follows:

What is the most appropriate diagram to present the above data?
View SolutionThe population of four towns A,B,C and D as on 2011 are as follows:what is the most appropriate diagram to present the above data?
View Solution

