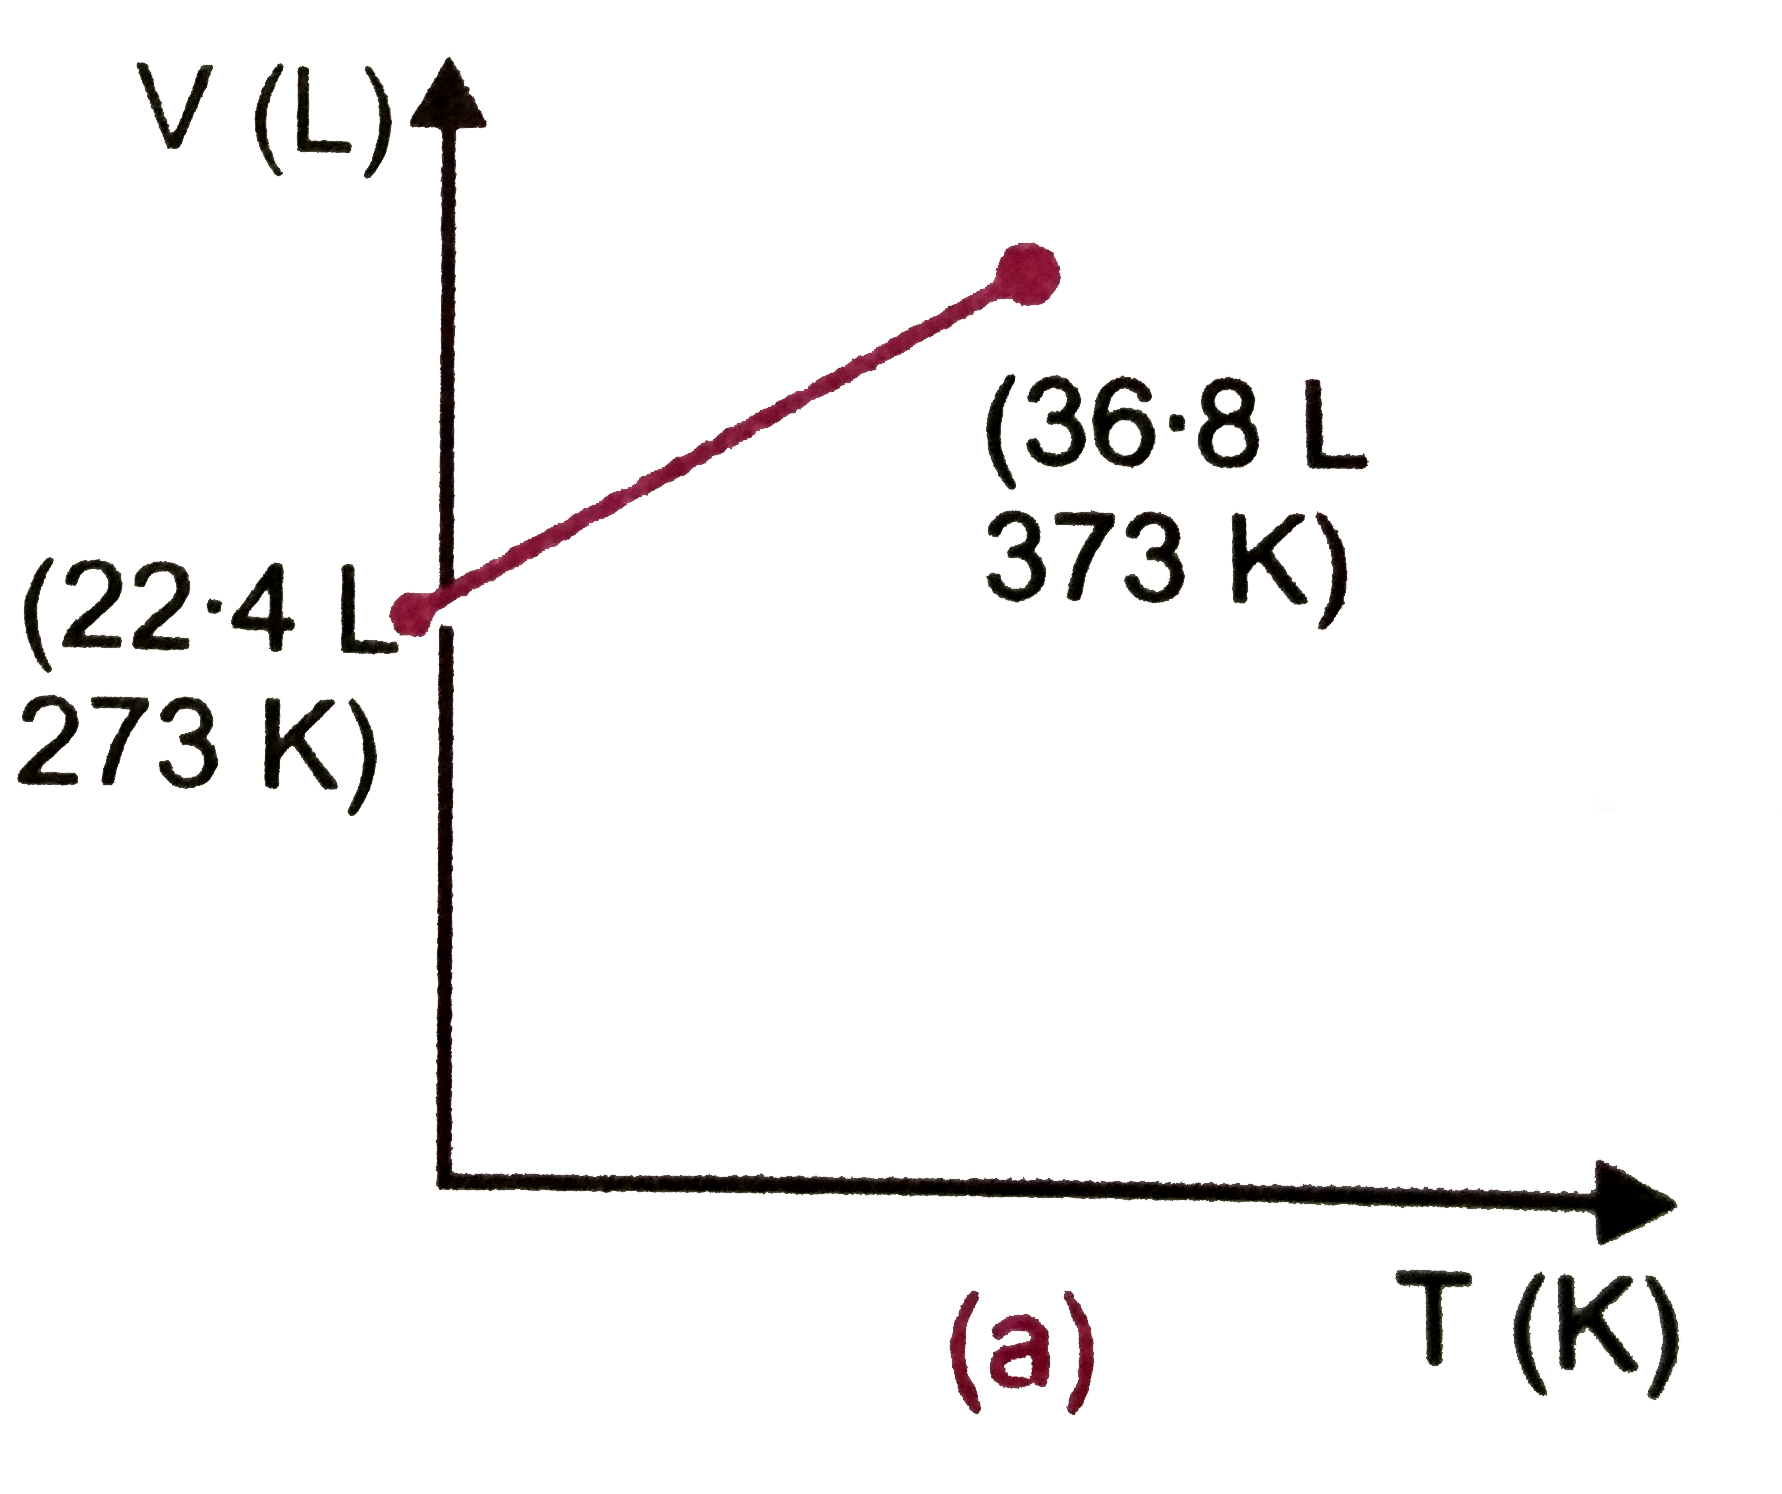
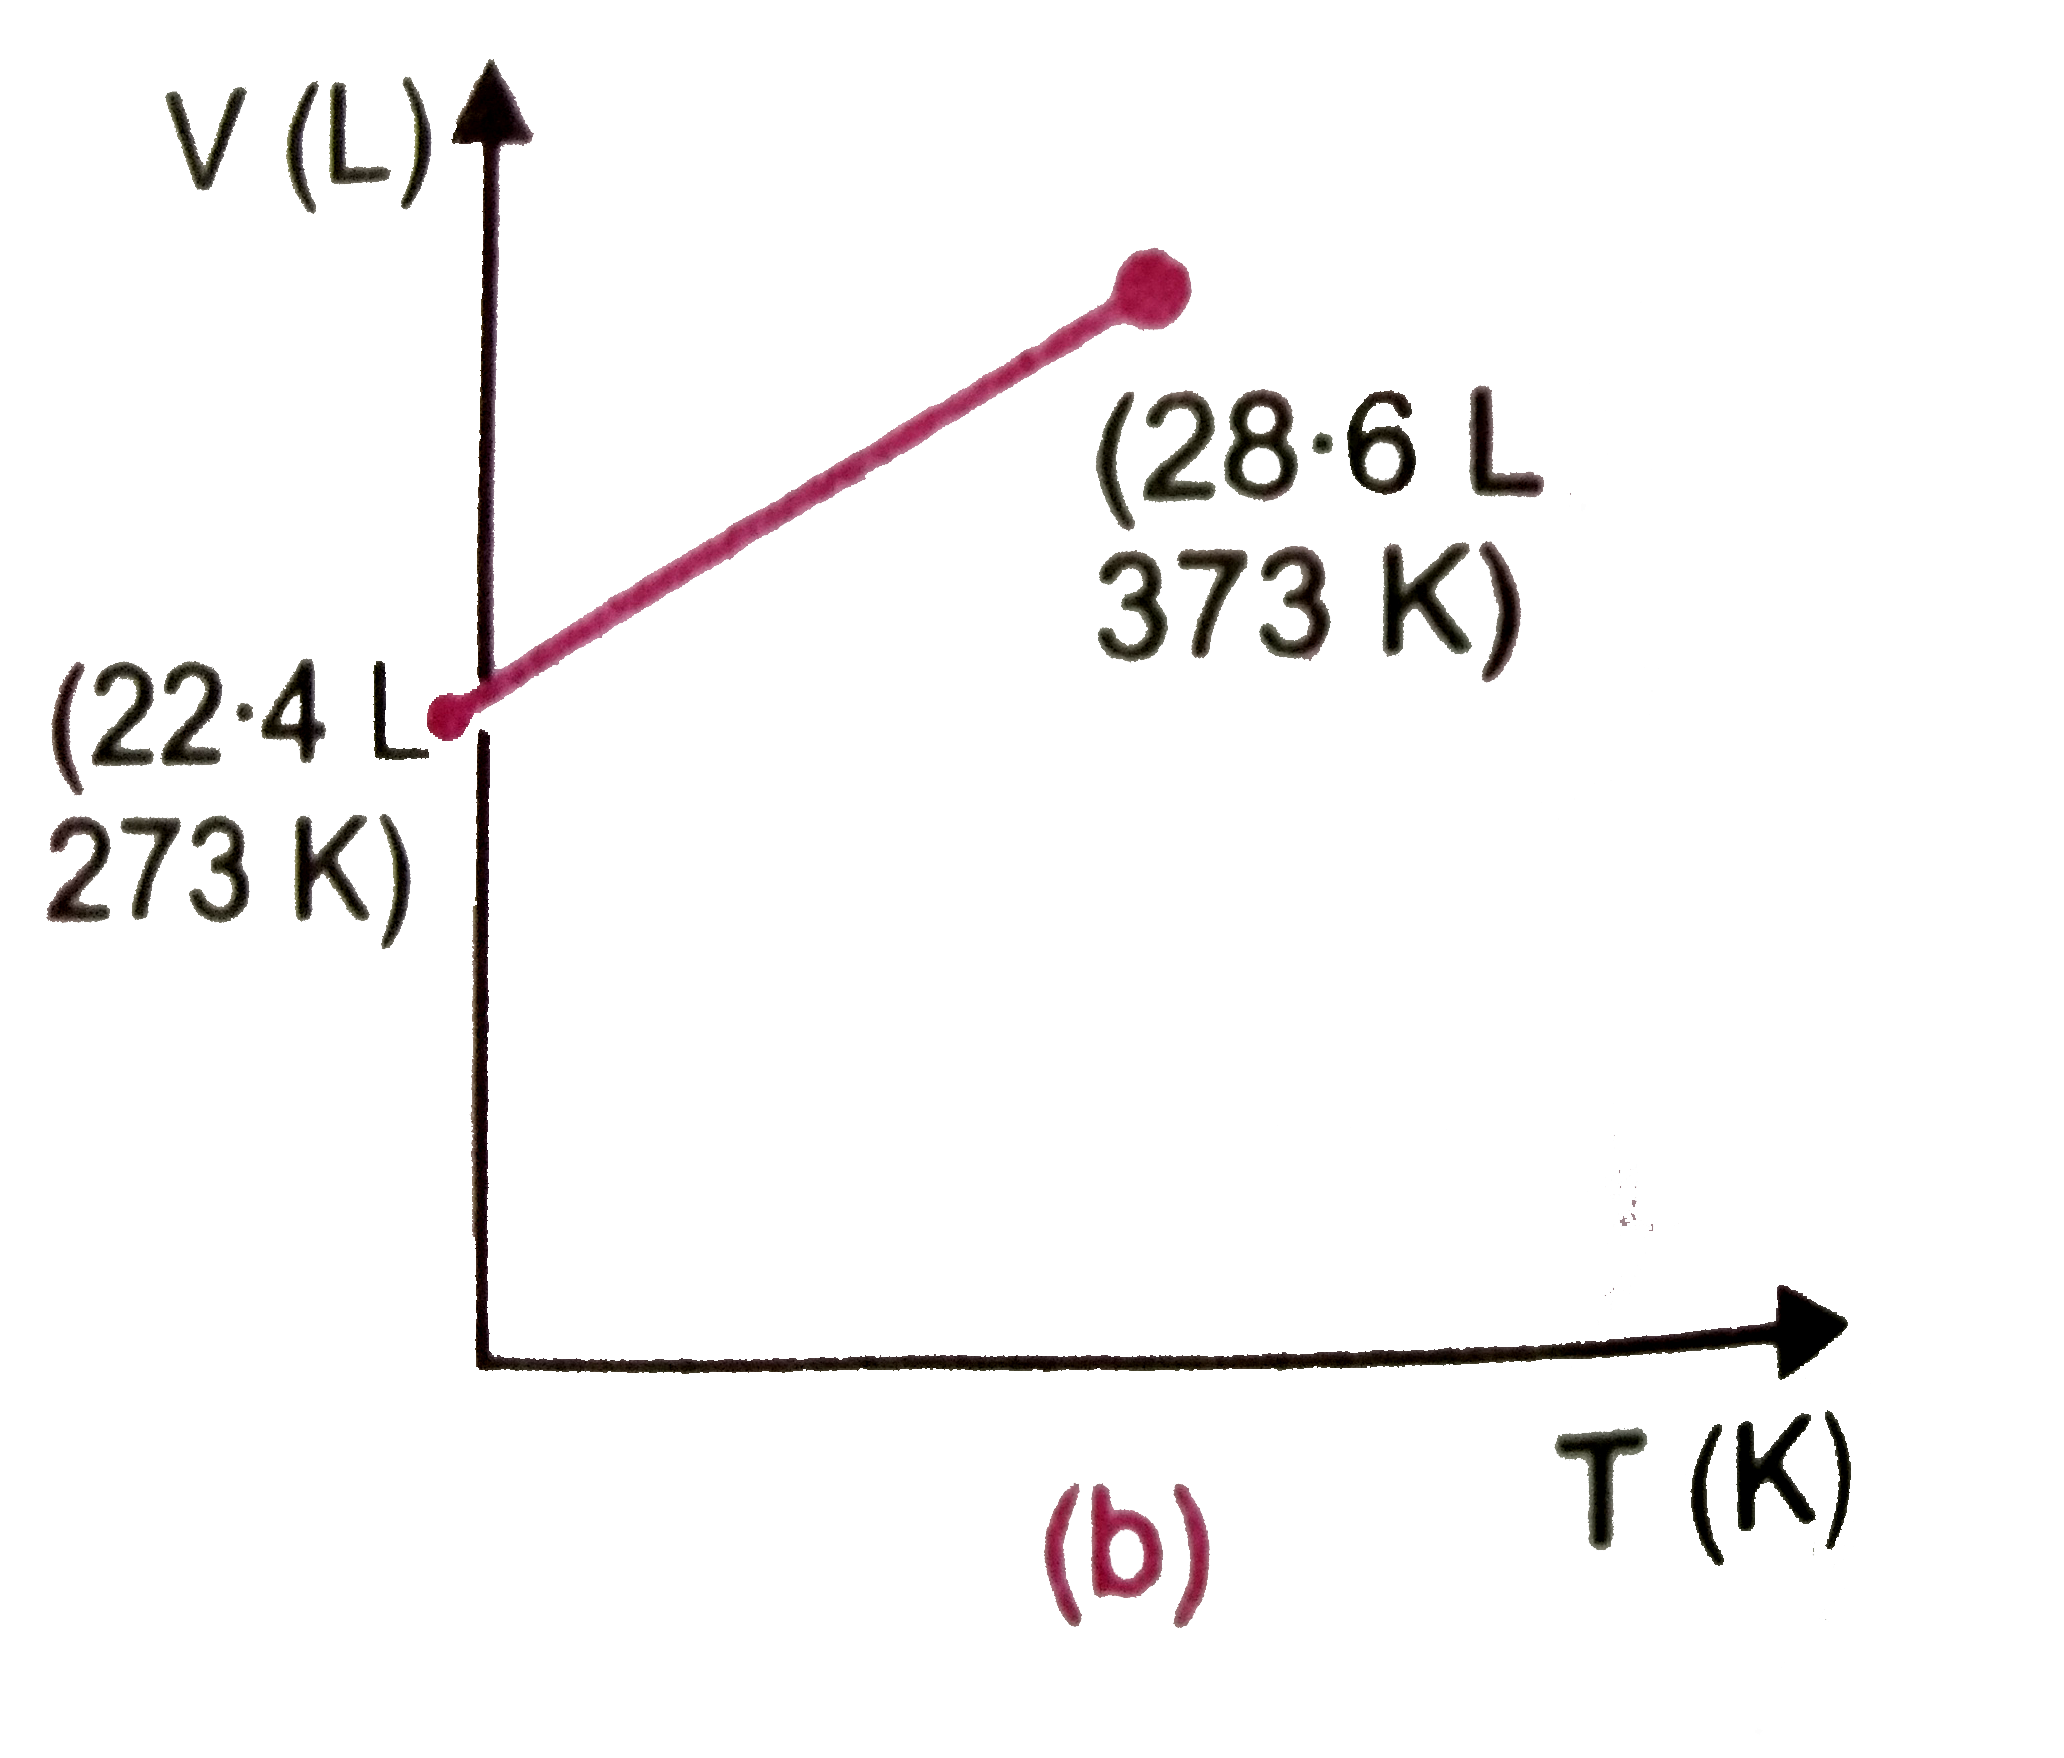
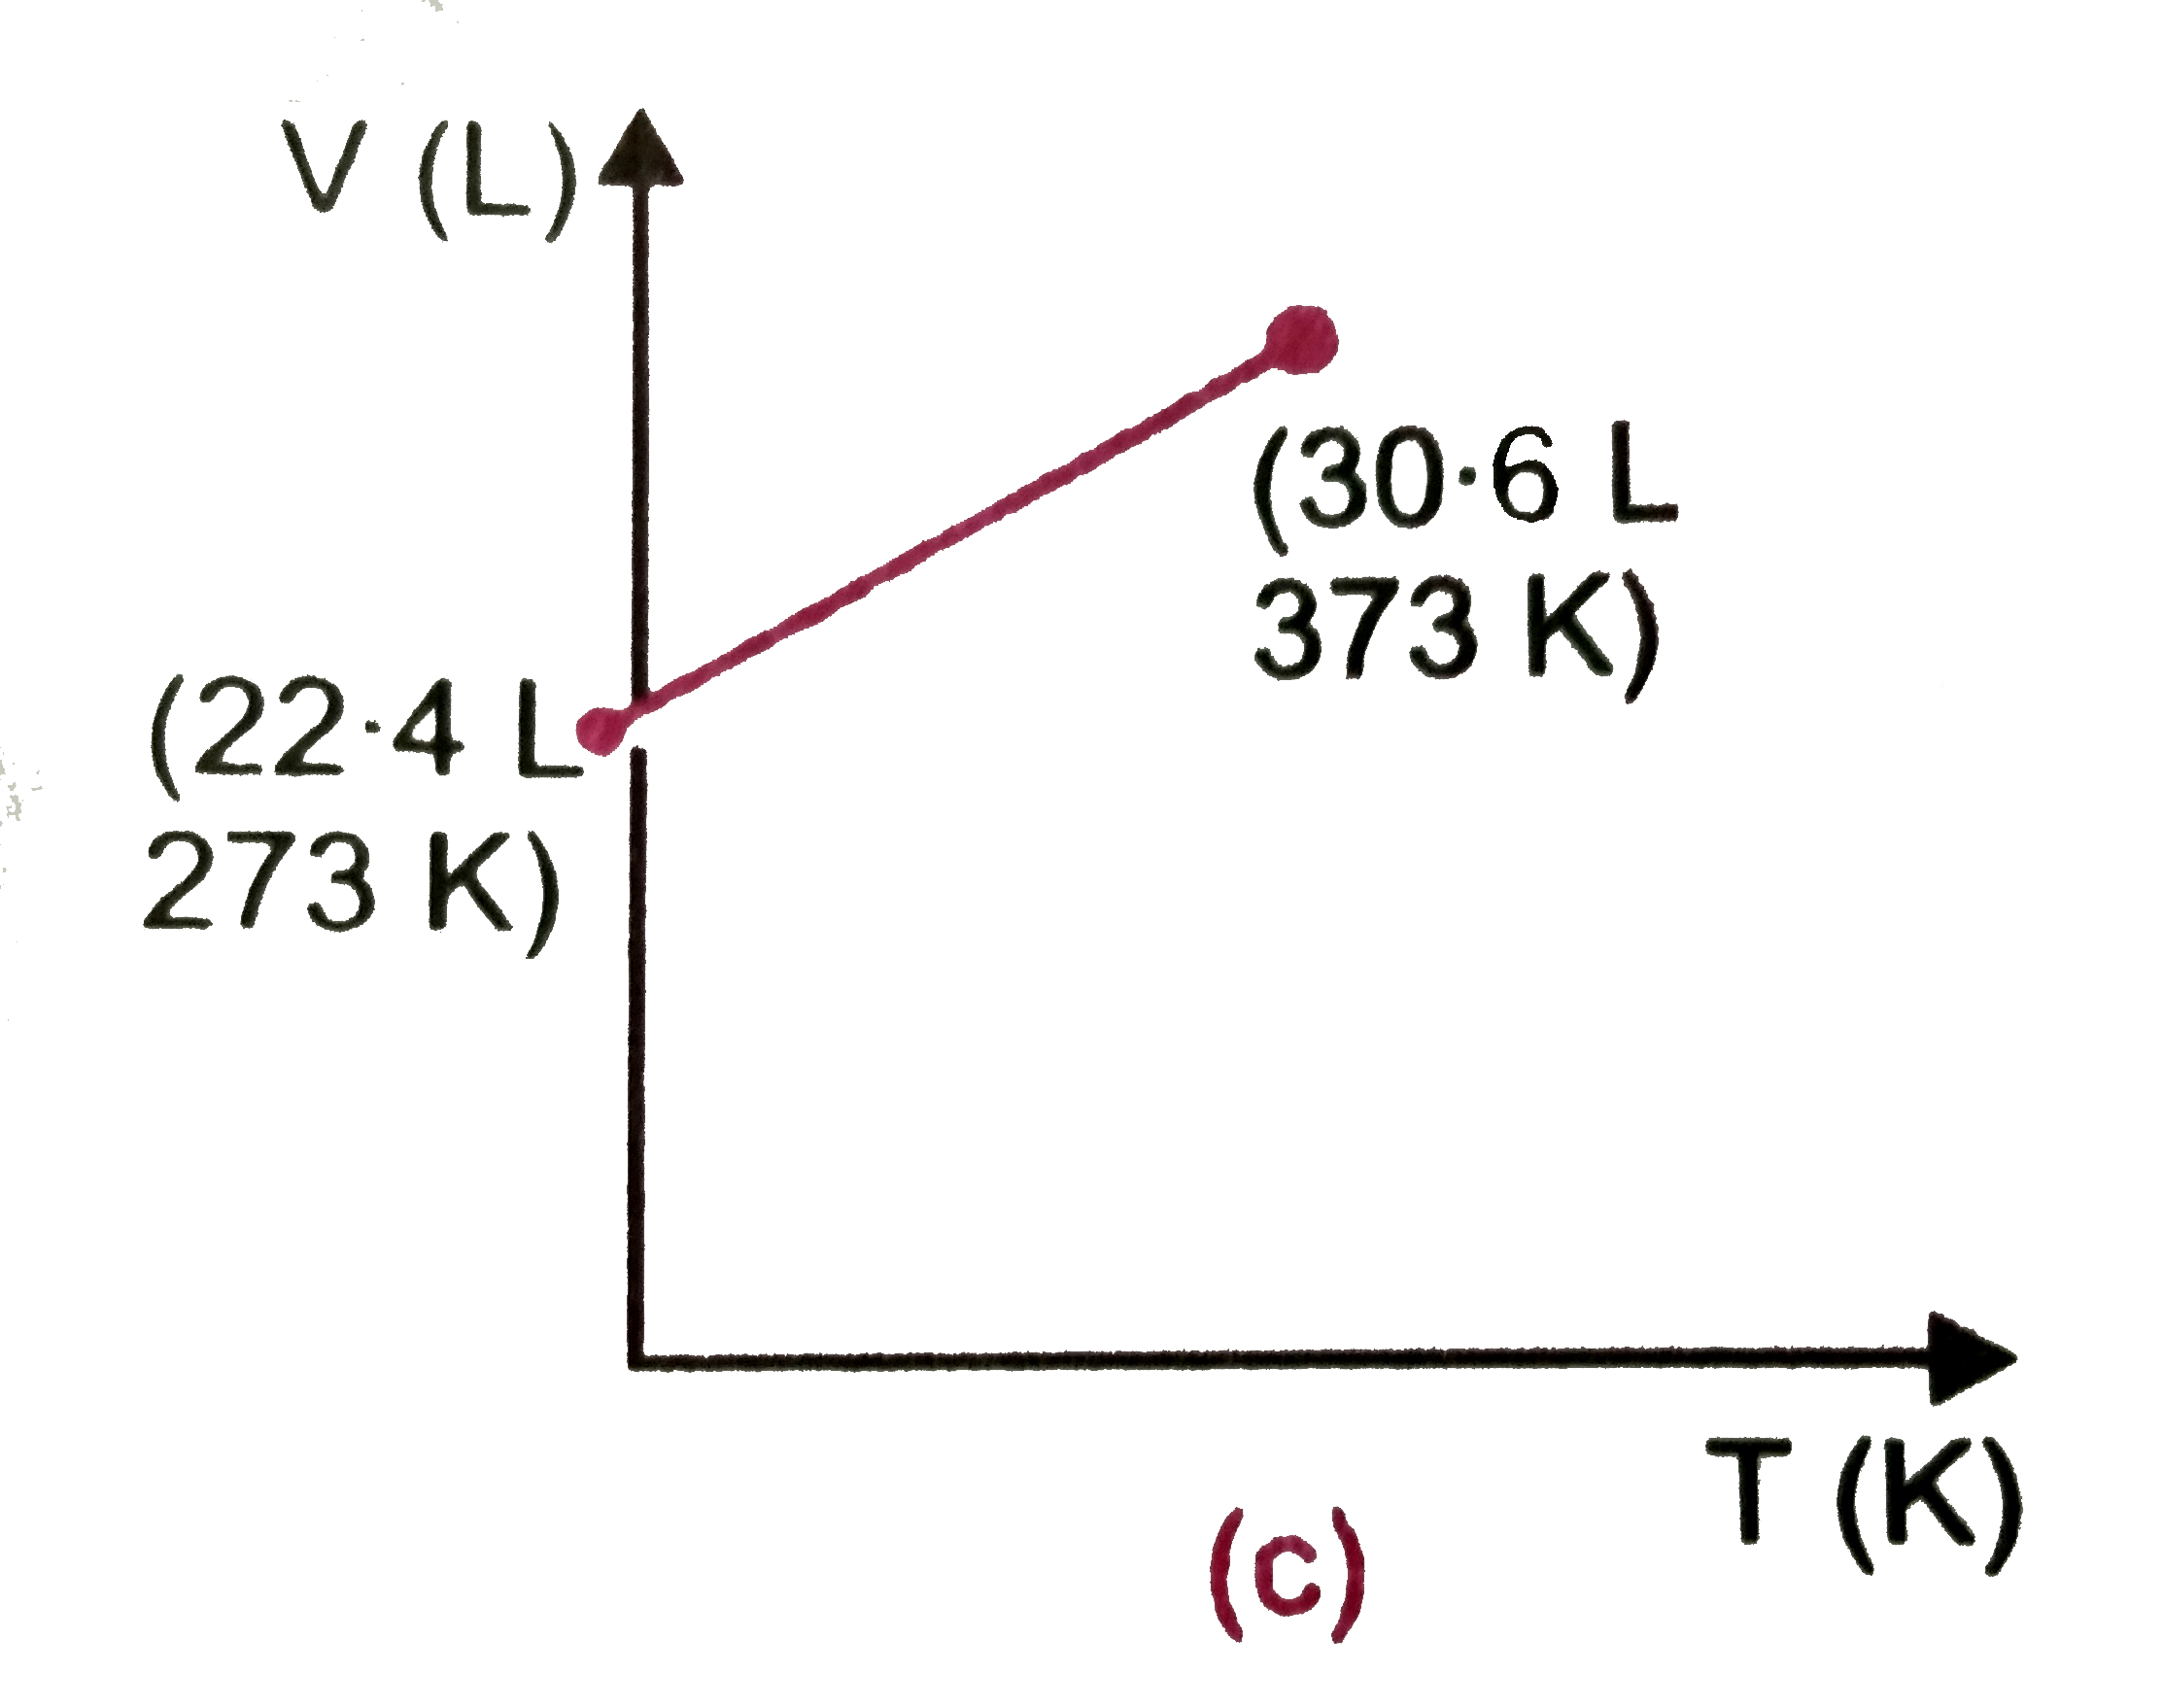
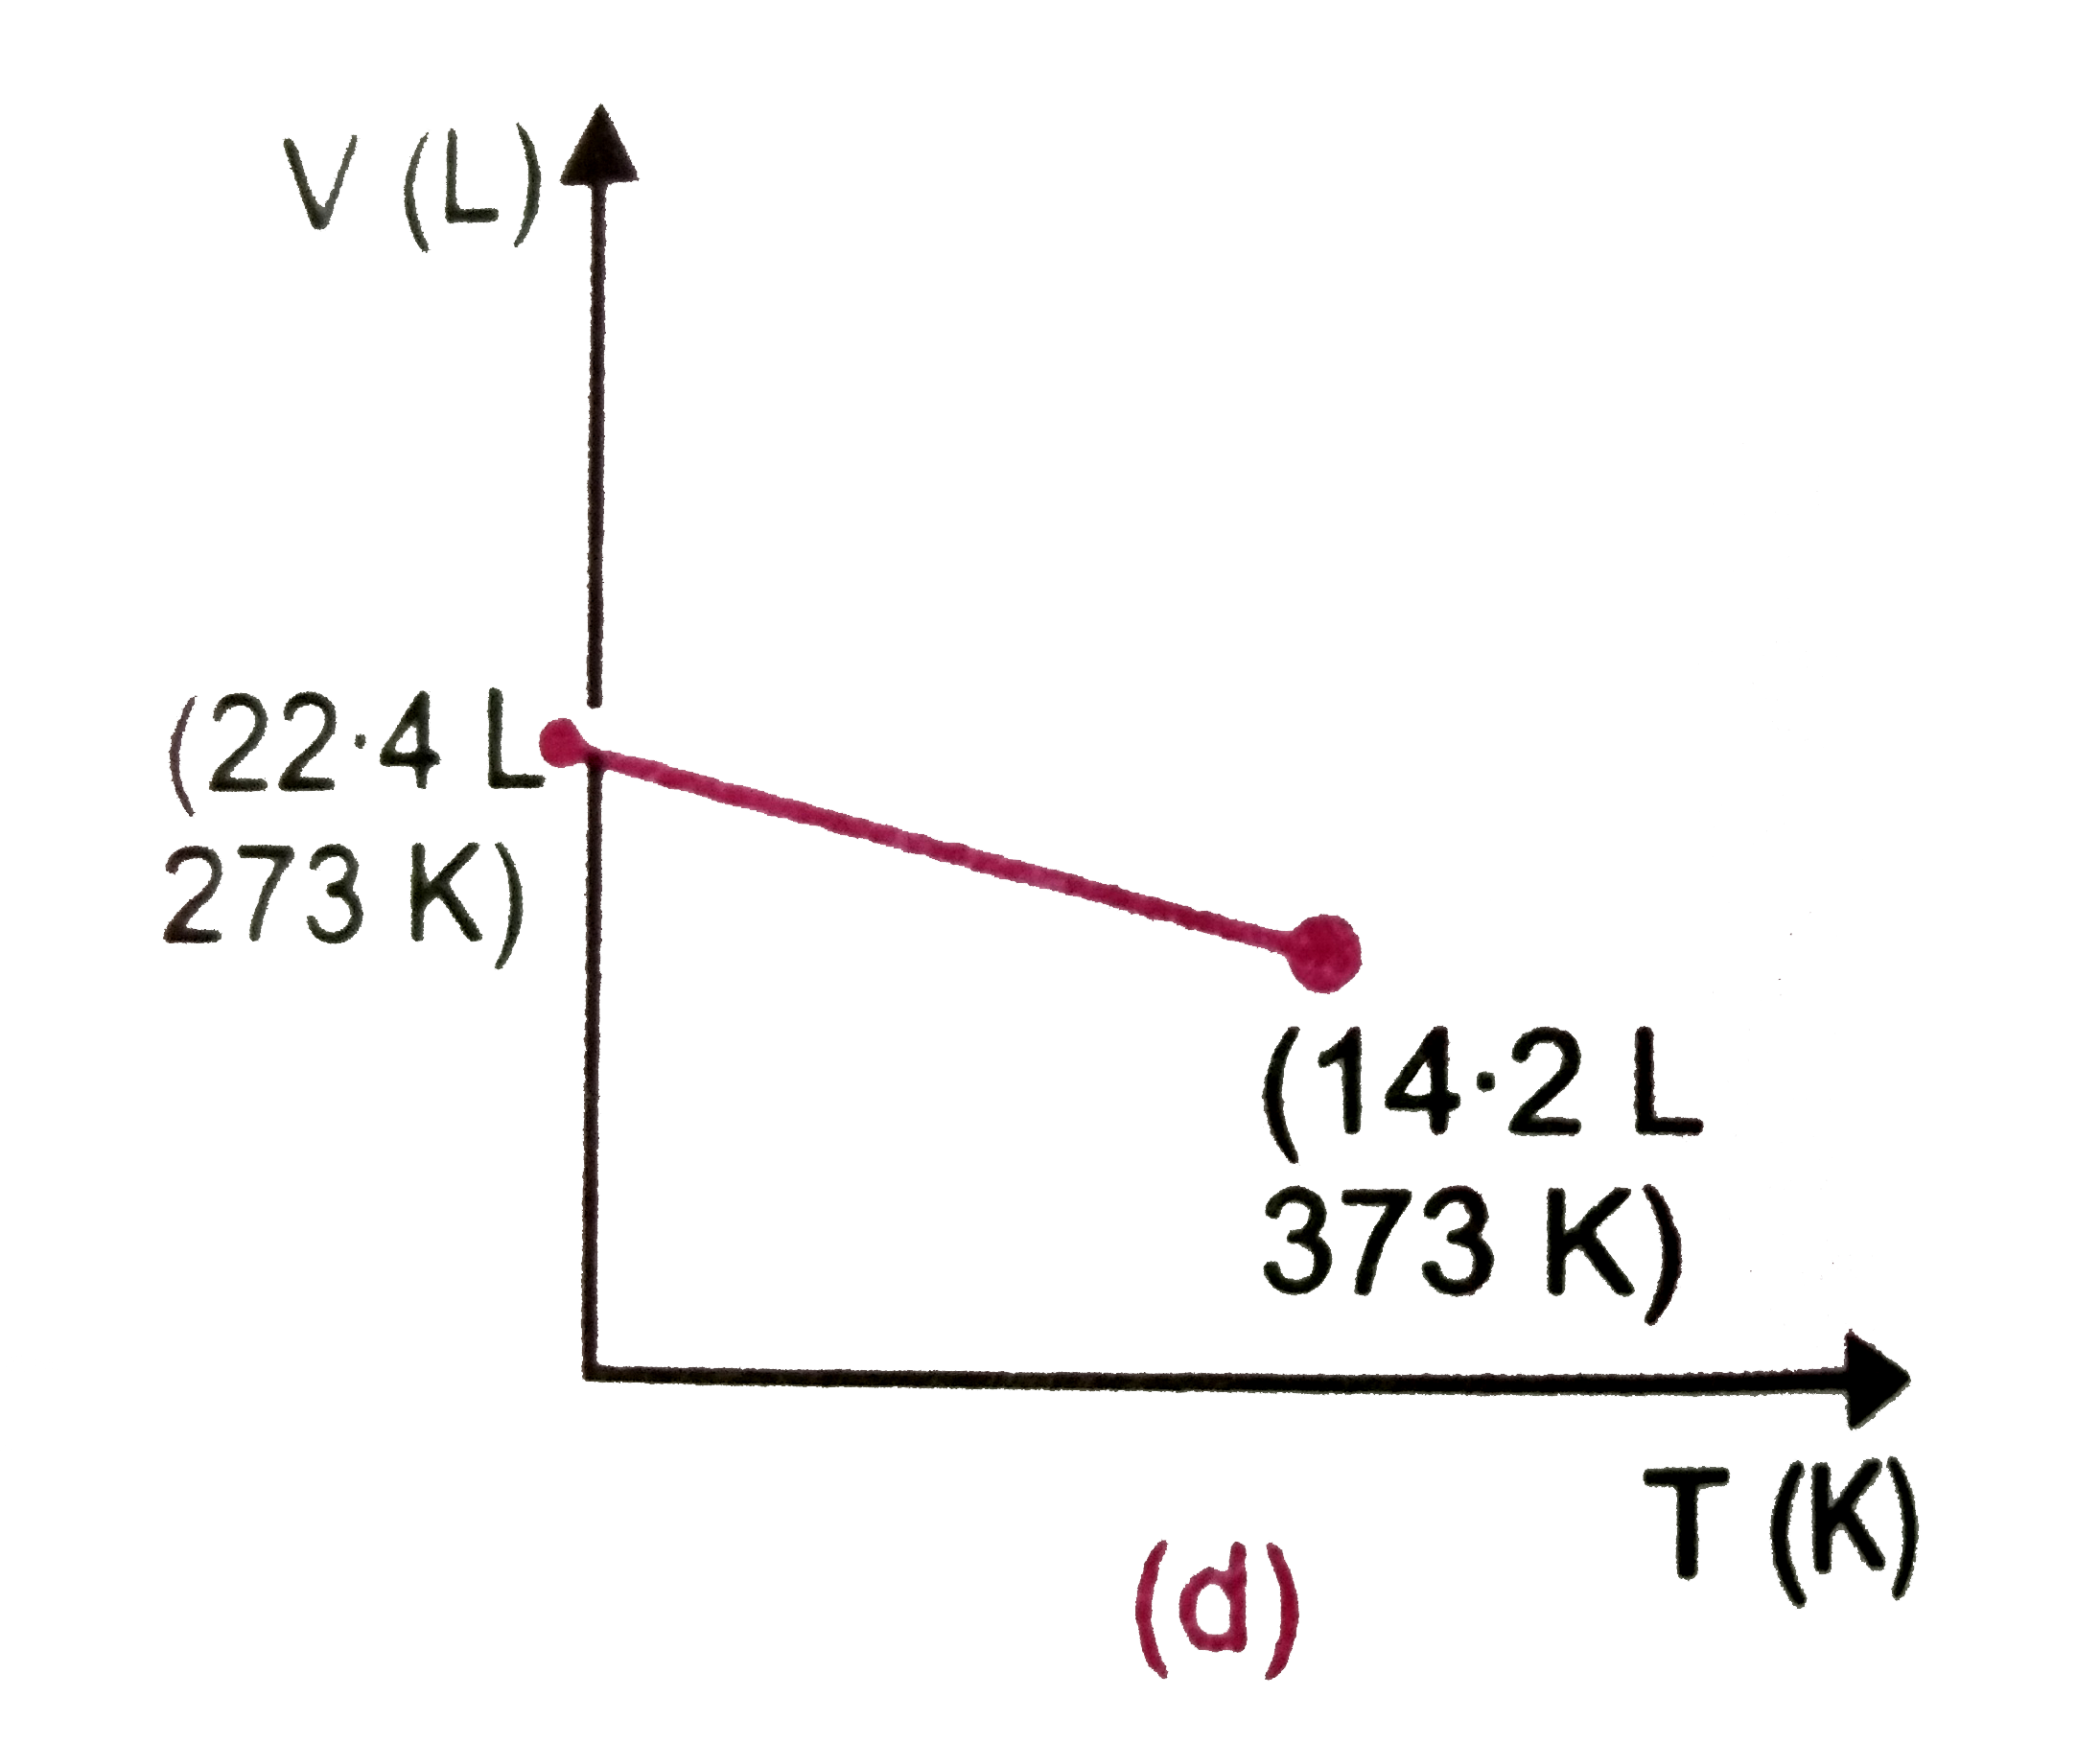
Which one of the following volume (V)- temperature (T) plots represents the behaviour of one mole of an ideal gas at one atmosphere?
A
B
C
D
Video Solution
Text Solution
The correct Answer is:C
Volume of 1 mole of an ideal gas at 273 K and atm is 22.4 L. Volume at 373 K and 1 atm pressure
V=RTP=0.082×3731=30.58 L≈30.6 L
|
Updated on:21/07/2023
Topper's Solved these Questions
- BOOK - PRADEEPCHAPTER - STATES OF MATTER : GASES AND LIQUIDESEXERCISE - COMPETITION FOCUS (Kinetic theory of gases, kinetic energy and molecular speeds12videos
STATES OF MATTER : GASES AND LIQUIDES
- BOOK - PRADEEPCHAPTER - STATES OF MATTER : GASES AND LIQUIDESEXERCISE - COMPETITION FOCUS (Behaviour of real gases and van der Waals equation)12videos
STATES OF MATTER : GASES AND LIQUIDES
- BOOK - PRADEEPCHAPTER - STATES OF MATTER : GASES AND LIQUIDESEXERCISE - COMPETITION FOCUS (Differentiating three states of matter and intermolecular forces)2videos
STATES OF MATTER : GASES AND LIQUIDES
- BOOK - PRADEEPCHAPTER - SOME p-BLOCK ELEMENTSEXERCISE - Competition Focus (JEE( Main and Advanced)/Medical Entrance) VIII. Assertion-Reason Type Questions (Type I)23videos
SOME p-BLOCK ELEMENTS
- BOOK - PRADEEPCHAPTER - STATES OF MATTER: SOLID MATTEREXERCISE - COMPETITION FOCUS (ASSERTION-REASON)17videos
STATES OF MATTER: SOLID MATTER
Similar Questions
Knowledge Check
- Question 1 - Select One
Which of the following volume (V) - temperature (T) plots represents the behaviour of one mole of an ideal gas at one atmospheric pressure?
A B
B C
C D
D
- Question 2 - Select One
Which one of the following volume (V)- temperature (T) plots represents the behaviour of one mole of an ideal gas at one atmosphere?
A B
B C
C D
D
- Question 3 - Select One
Which of the following volume (V) temperature (T) plots represents the behaviour of one mole of an ideal gas at one atmospheric pressure:
A B
B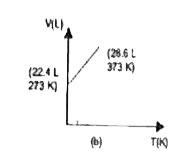 C
C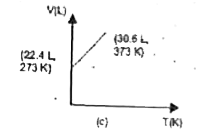 D
D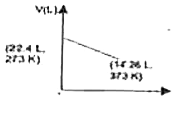
Which of the following volume (V)-temperature (T) plots represents the behaviour of one mole of an ideal gas at one atmoshperic pressure?
View SolutionWhich of the following volume-temperature (V−I) plots represents the behaviour of 1mole of an ideal gas at the atmospheric pressure?
View SolutionWhich of the following volume-temperature (V−I) plots represents the behaviour of 1mole of an ideal gas at the atmospheric pressure?
View SolutionThe K.E. of one mole of an ideal gas is
View SolutionThe internal energy of one mole of ideal gas is
View Solution

