Which graph correctly represents variation between relaxation time (t) of gas molecules with absolute temperature of gas T.
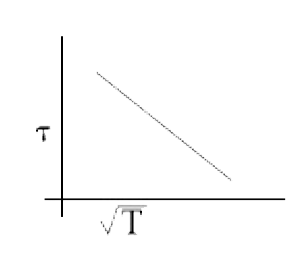
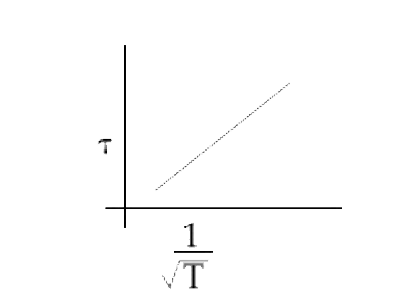
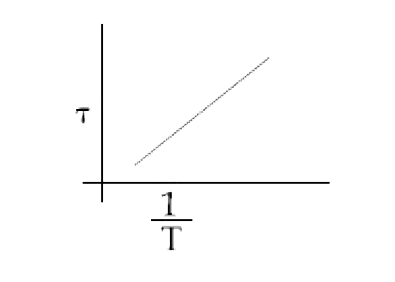
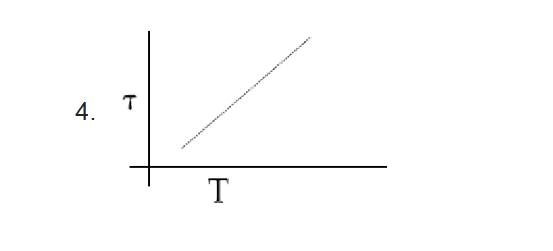
The correct Answer is:2
Step by step video & image solution for Which graph correctly represents variation between relaxation time (t) of gas molecules with absolute temperature of gas T. by Physics experts to help you in doubts & scoring excellent marks in Class 12 exams.
Topper's Solved these Questions
Similar Questions
Knowledge Check
- Question 1 - Select One
At a constant pressure, of the following graphs that one which represents the variation of the density of an ideal gas with the absolute temperature T, is
A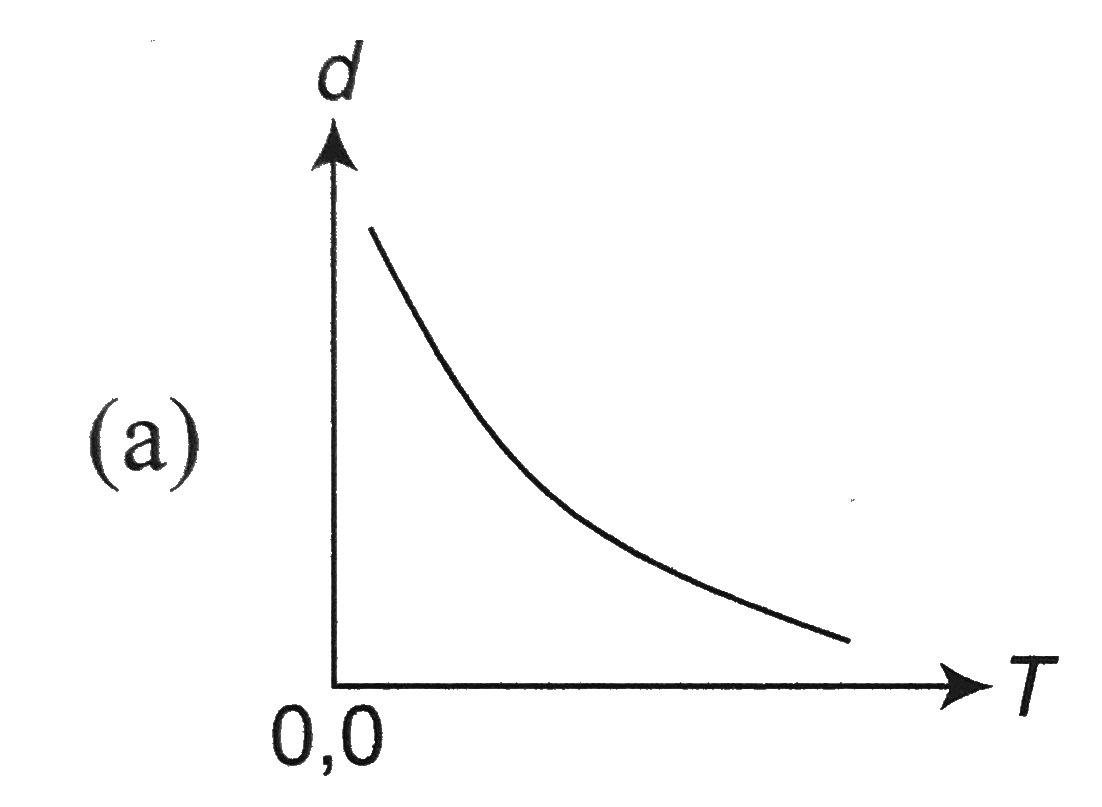 B
B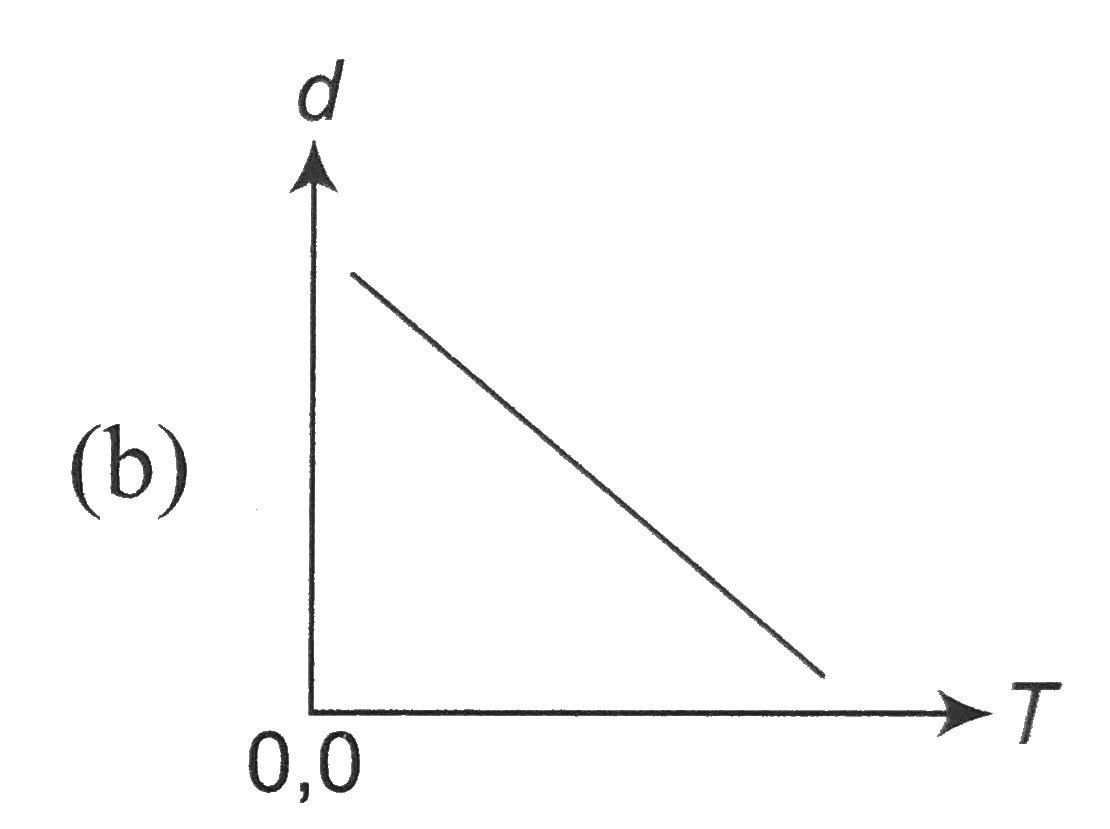 C
C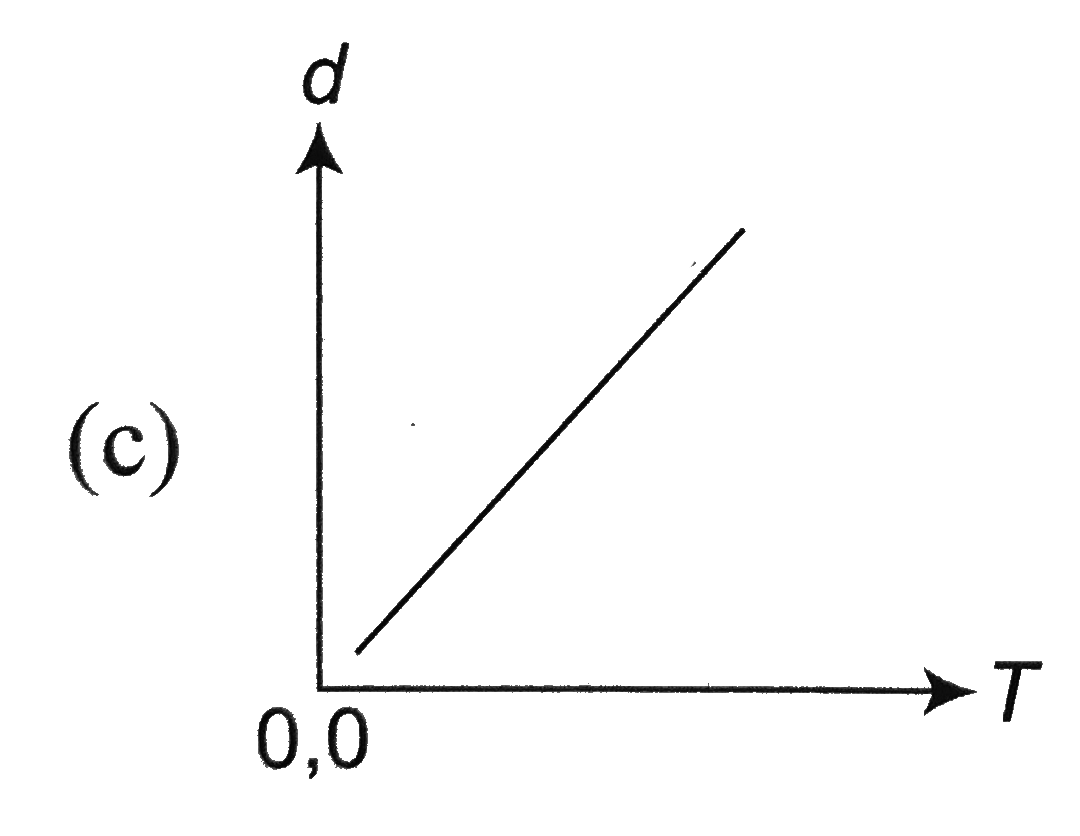 D
D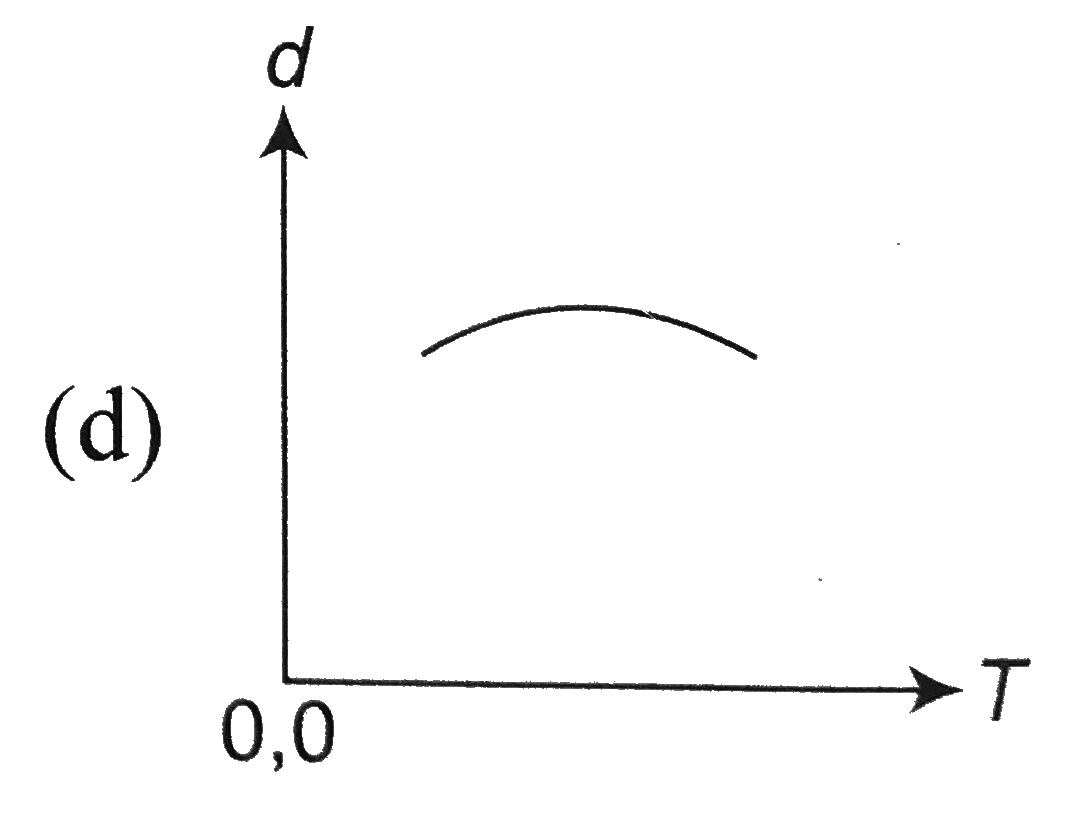
- Question 2 - Select One
Which of the following graphs correctly represents the variation of β=−dV/dPV
with P for an ideal gas at constant temperature?A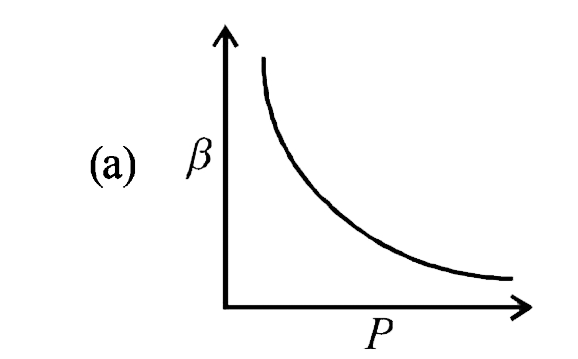 B
B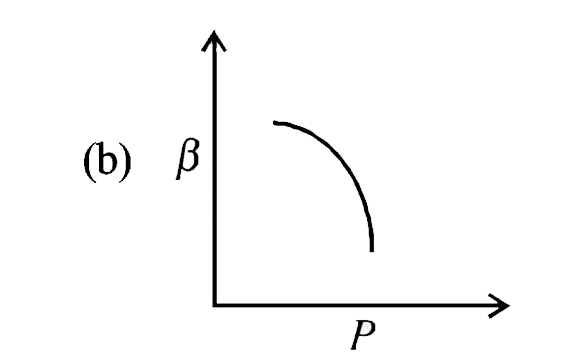 C
C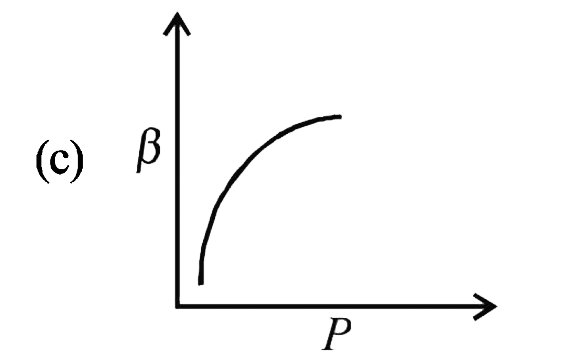 D
D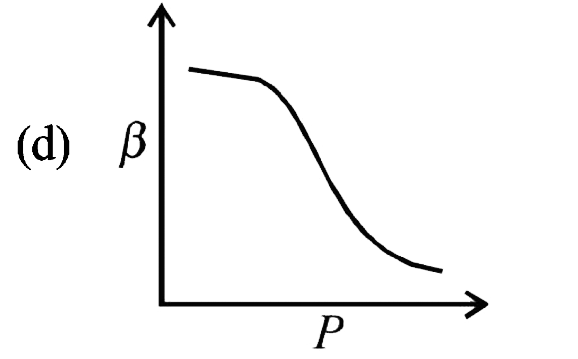
- Question 3 - Select One
which of the following graphs correctly represents the vatiation β=−(dVdP)T/V with P for an ideal gas at constant temperature ? .
A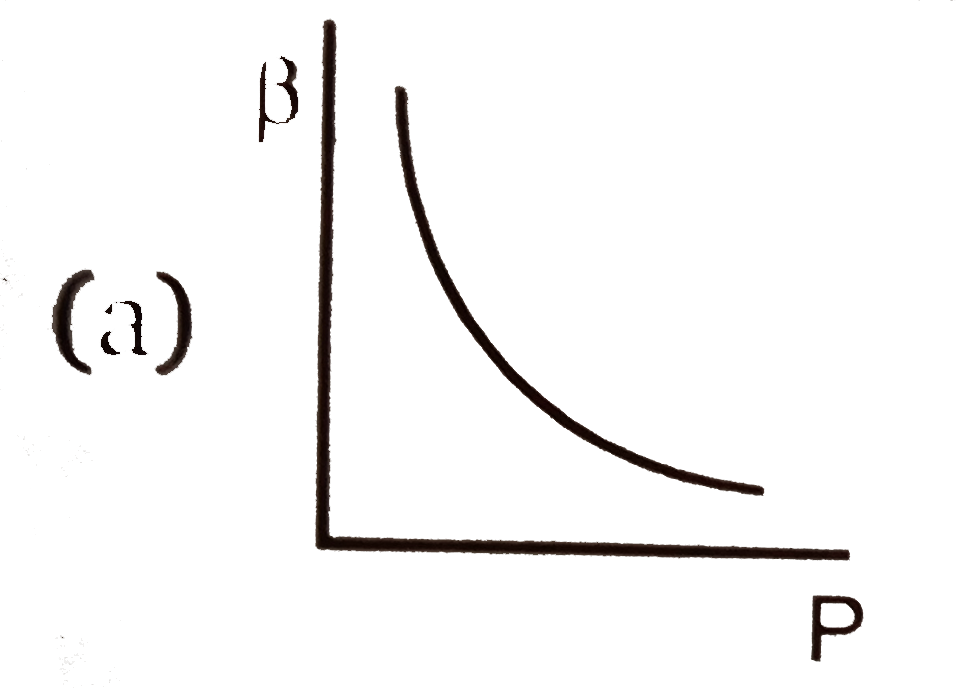 B
B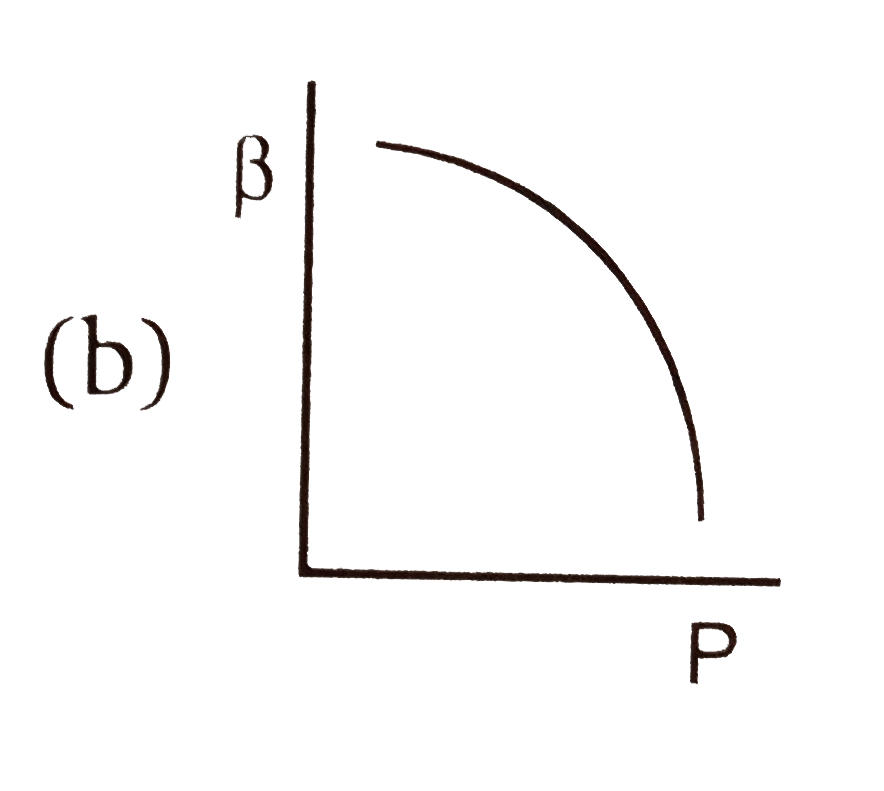 C
C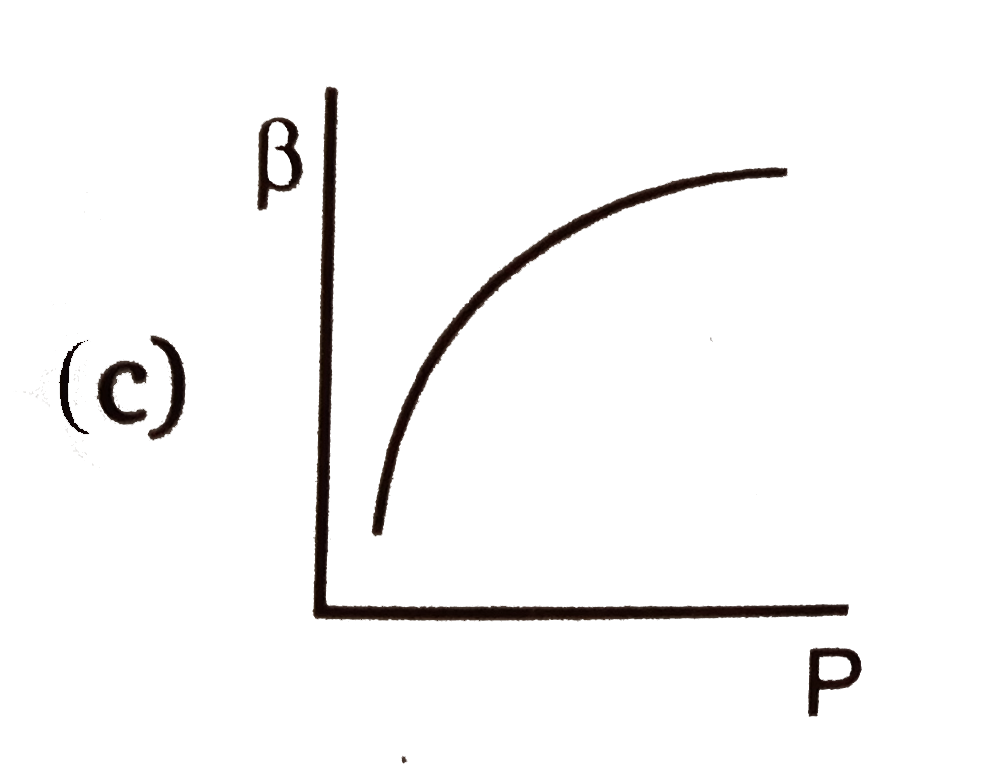 D
D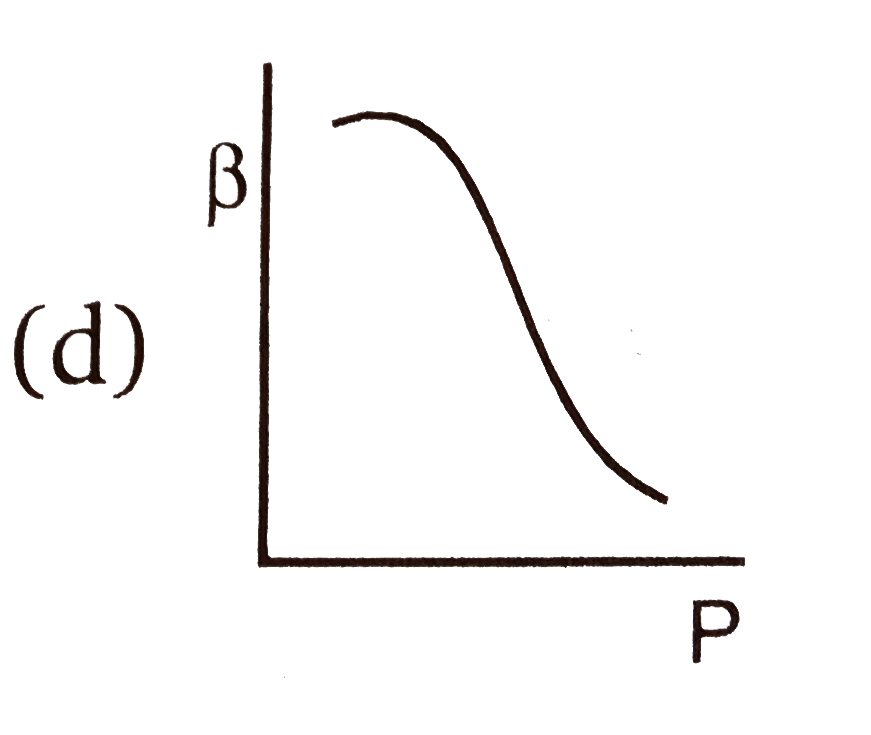
Which of the following graphs correctly represents the variation of β=−(dV/dP)/V with P for an ideal gas at constant temperature?
View SolutionWhich of the following graphs correctly represents the variation of β=−(dVdP)/V with P for an ideal gas at constant temperature
View SolutionAverage K.E. Of translation of a molecule of gas varies with temperature T of gas is
View SolutionThe translational K.E. of the molecules of a gas at absolute temperature (T) can be doubled
View SolutionWhich of the following graphs correctly represents the variation of β=−dV/dPV
with P for an ideal gas at constant temperature?View Solution

