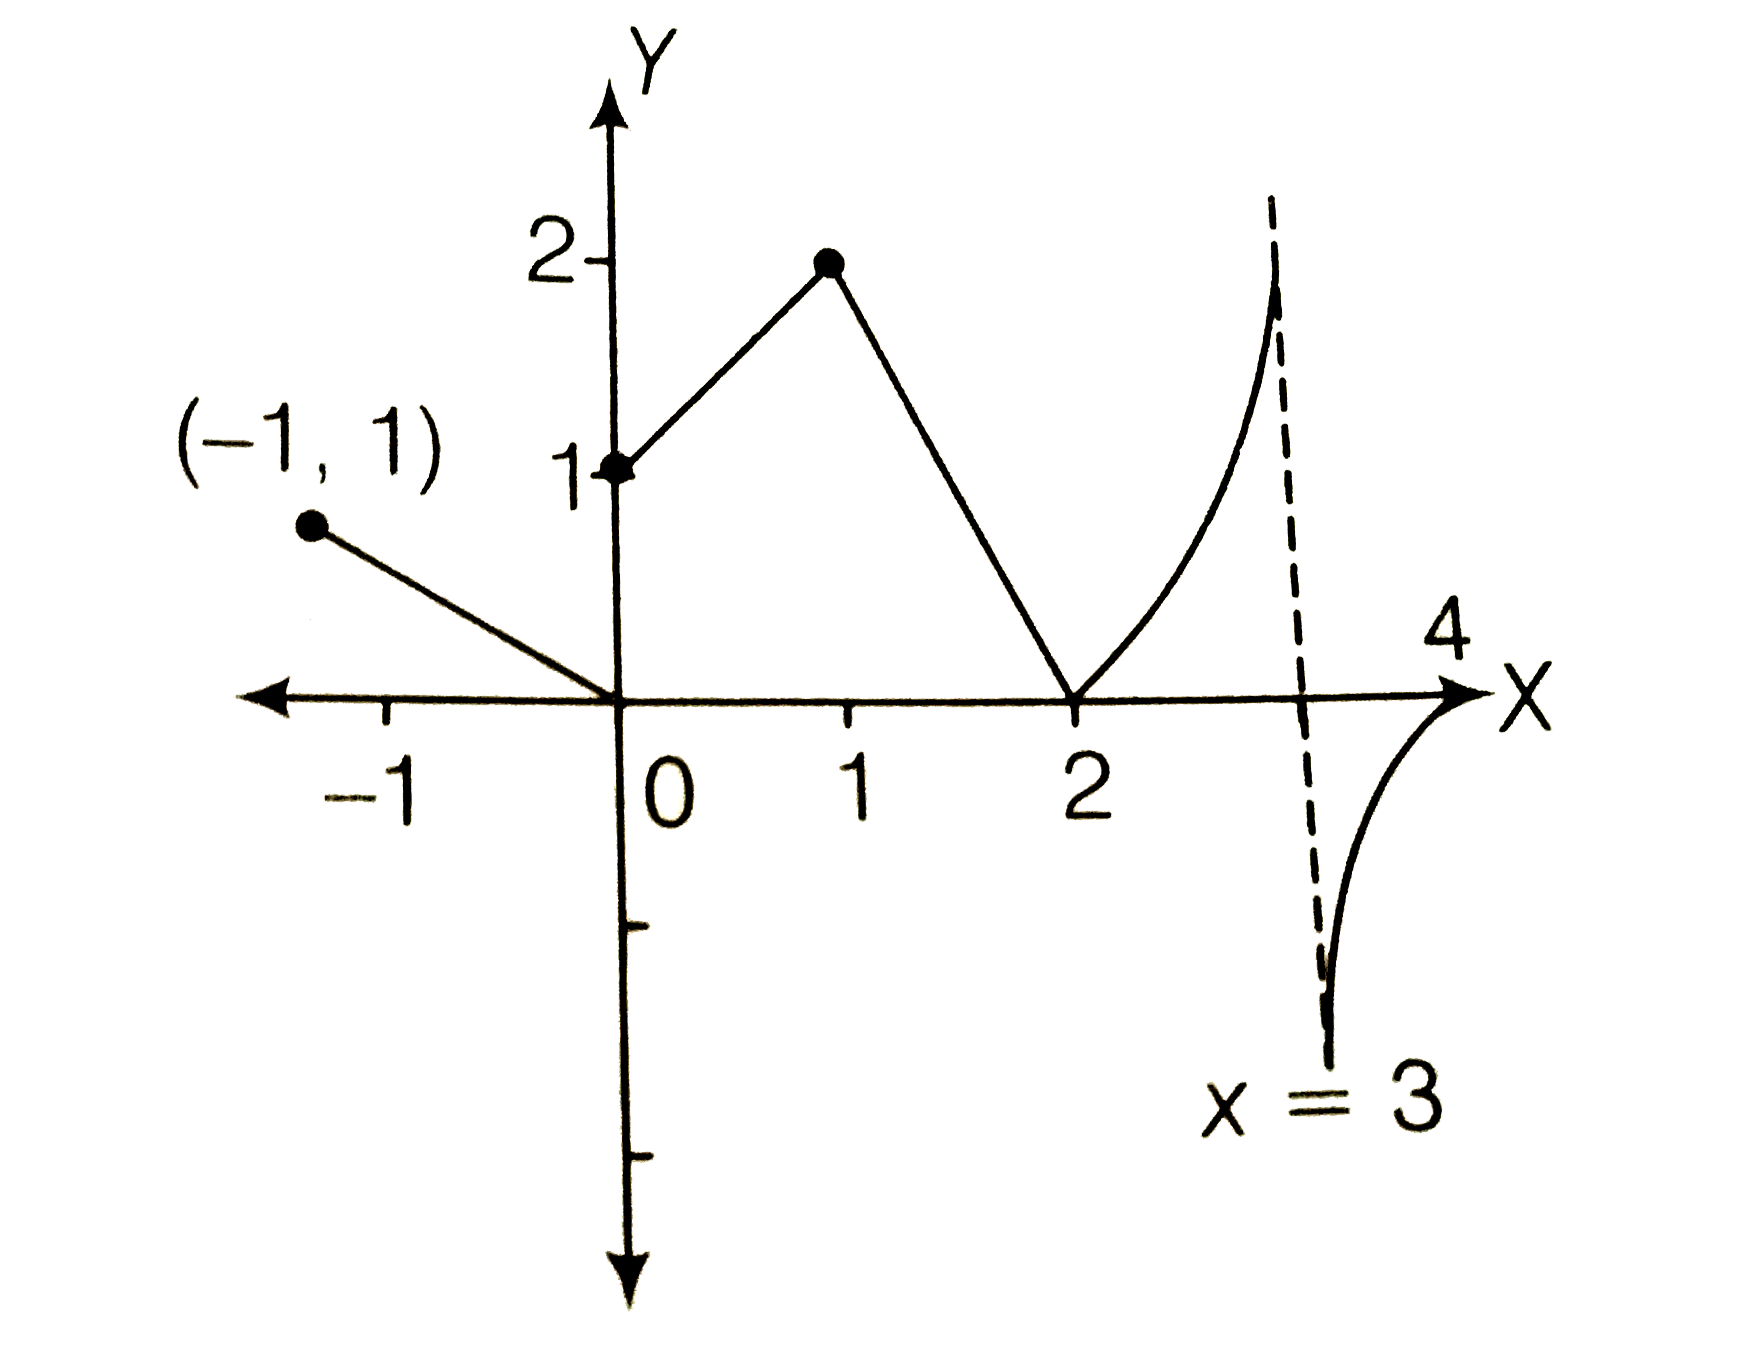
Graph of a function y=f(x) is shown in the adjacent figure.Four limits l1,l2,l3 and I4, are given as:
Step by step video & image solution for Graph of a function y=f(x) is shown in the adjacent figure.Four limits l_1,l_2,l_3 and I_4, are given as: by Maths experts to help you in doubts & scoring excellent marks in Class 12 exams.
Updated on:21/07/2023সম্পর্কিত প্রশ্ন
জ্ঞান পরীক্ষা করুন
In the circuit shown in the figure, if both the lamps L1 and L2 are identical
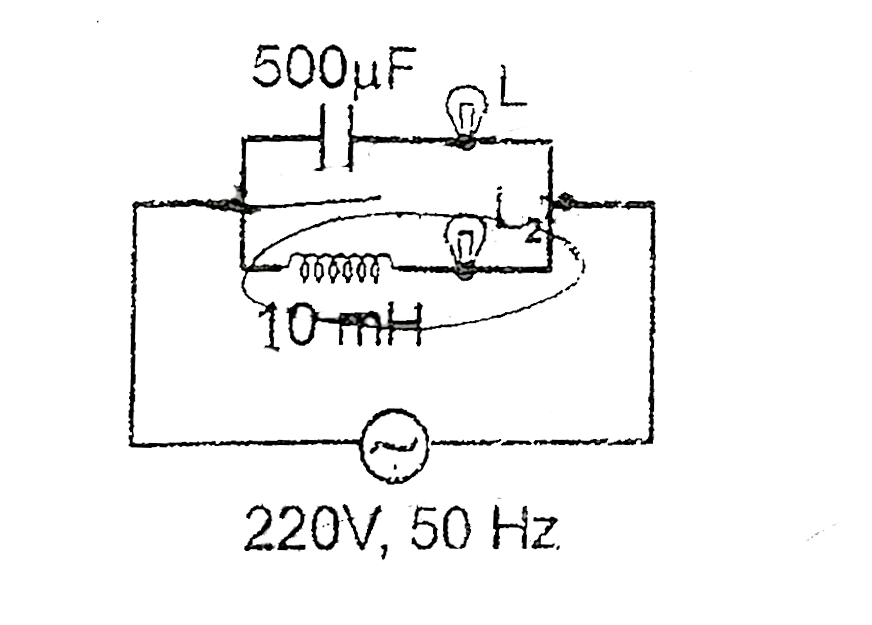 ATheir brightness will be sameBL2 will be brighter than L1CAs frequency of supply voltage is increased brightness of L1 will increase and that of L2 will decreaseDOnly L2 will glow because the capacitor has infinite resistance.
The following shows the graph of a continuous function y=f(x)on the interval [1,3]. The points A, B, C have coordinates (1,1),(3,2),(2,3) respectively, and the lines L1 and L2 are parallel, with L1 being tangent to the curve at C. If the area under the graph of y=f(x) from x=1 to x=3 is 4 square units, then the area of the shaded region is -
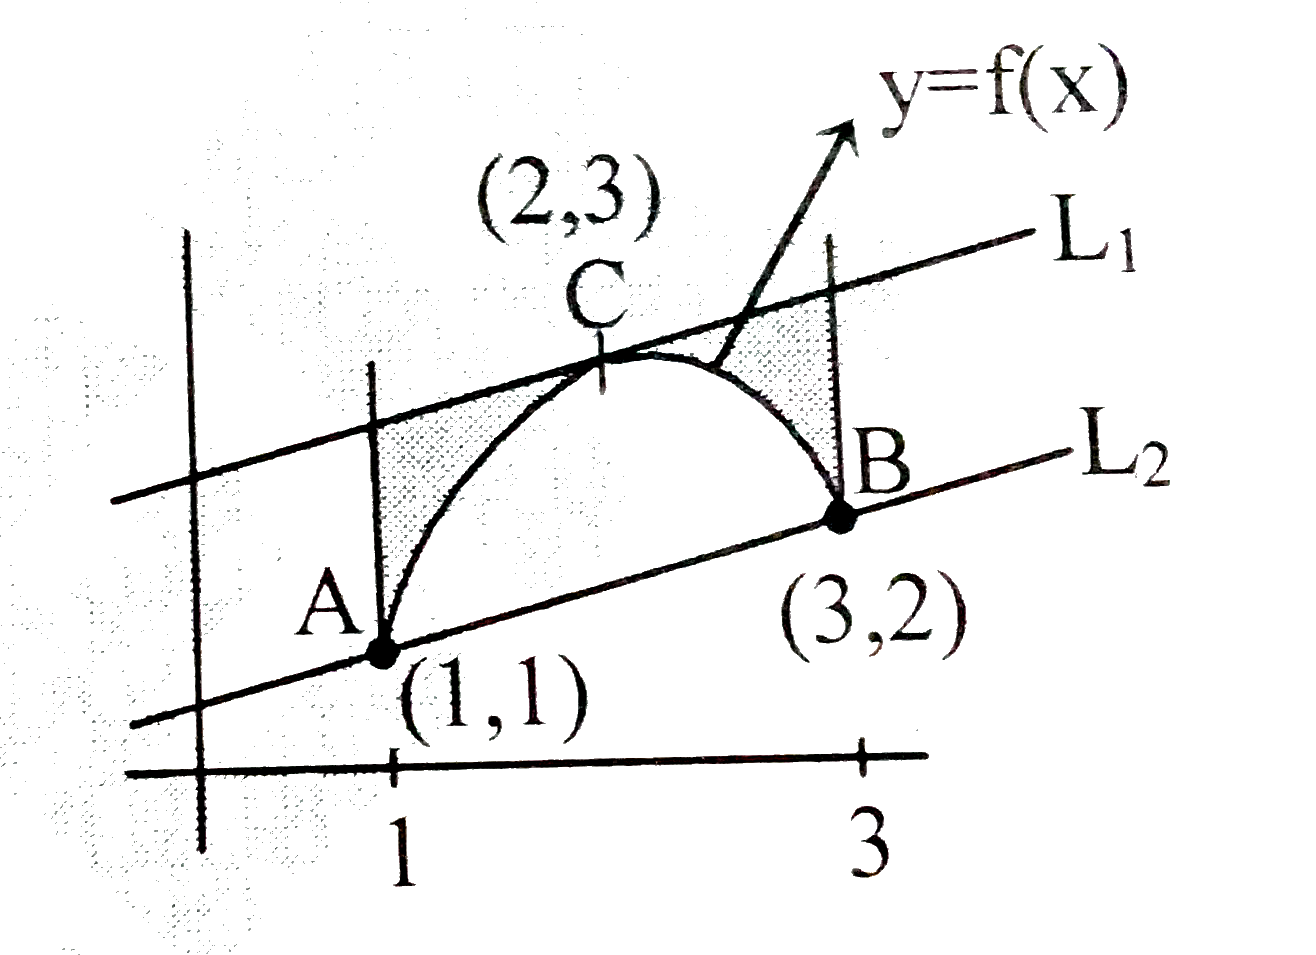 A2B3C4D5
Graph of y=f(x) is shown in the adjacent figure
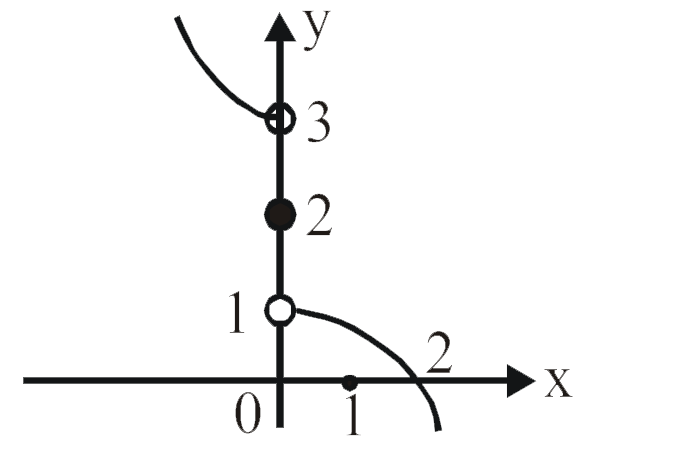
Value of lim0+({f(x)−1}) is equal to (wher {.} denotes fractional part function)
View SolutionA given mass m of a solid is supplied with heat continuously at a constant rate and the graph shown in the adjacent figure is plotted. If Lf and Lv are latent heats of fusion and latent heats of vapourisation and Sl and Ss are specific heats of liquid and solid respectively. It can be concluded that

View SolutionThe folloiwng figure shows the graph of a continuous function y = f(x) on the interval [1, 3]. The points A, B, C have coordinates (1,1), (3,2),(2,3), respectively , and the lines L1andL2 are parrallel, with L1 being tangent to the curve at C. If the area under the graph of y = f(x) from x = 1 to x = 3 is 4 square units, then the area of the shaded region is

View SolutionThe bar chart represents number of fiction and non-fiction books in four libraries L1, L2, L3 and L4 comsider the bar chart and answer questions based on it.
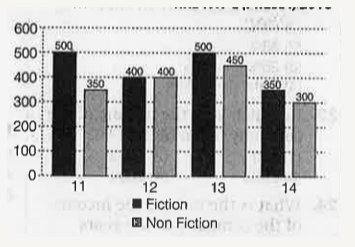
The ratio of total books of libraries L1 and L3 to L2 and L4 is
View SolutionA point P is 3units away from line L1=3x+4y+5=0and4 units away from the line L2=8x−by+9=0, The reflection of P on L1, is P1 the reflection of P1 on L2, is P2 the reflection of P3, on L2, is P4, Then the area (in sq. units) of figure formed by joining P1P2P3,andP4, is-
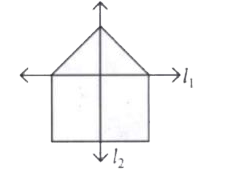
View SolutionFor the given figure, which one is the mirror line, l1 or l2?
View Solution
