figure
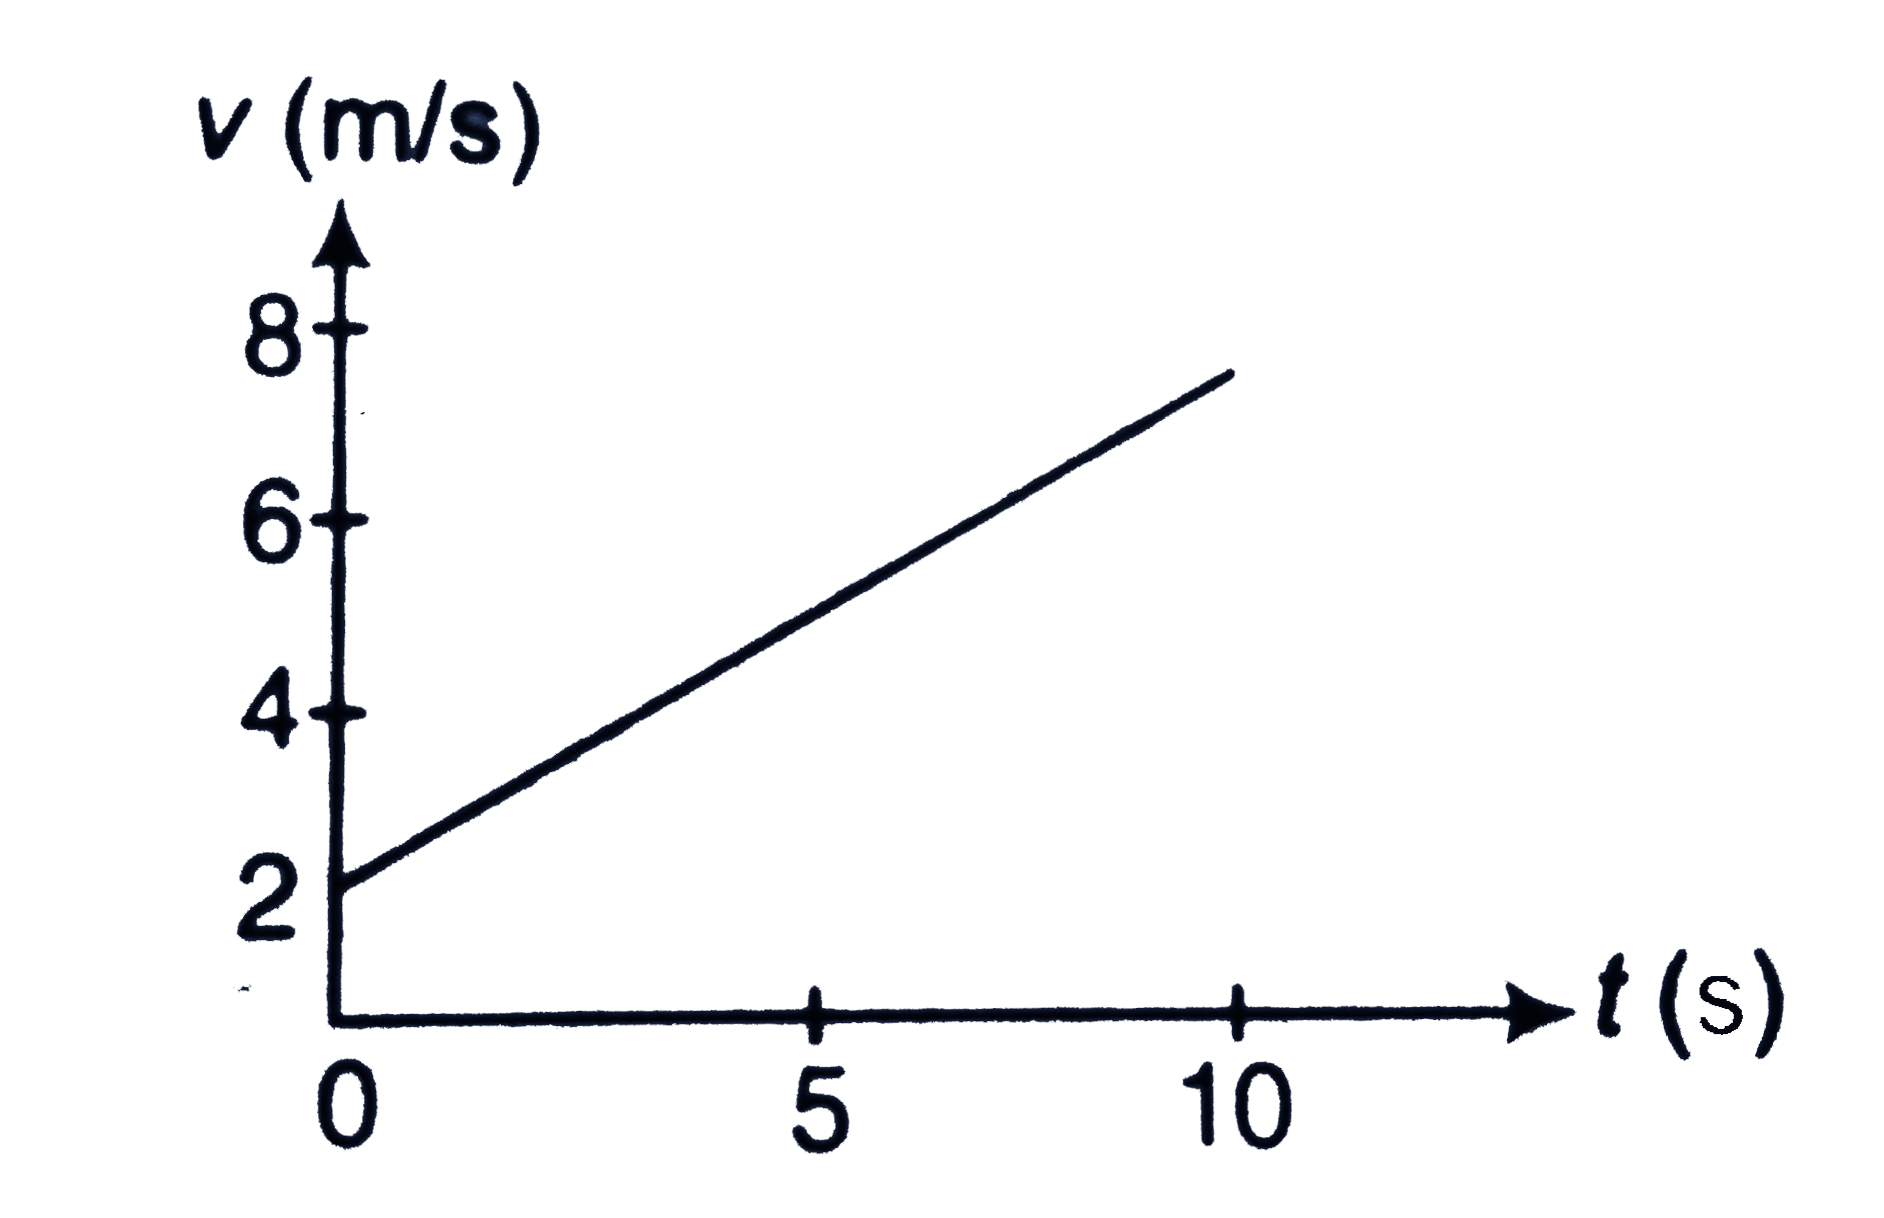
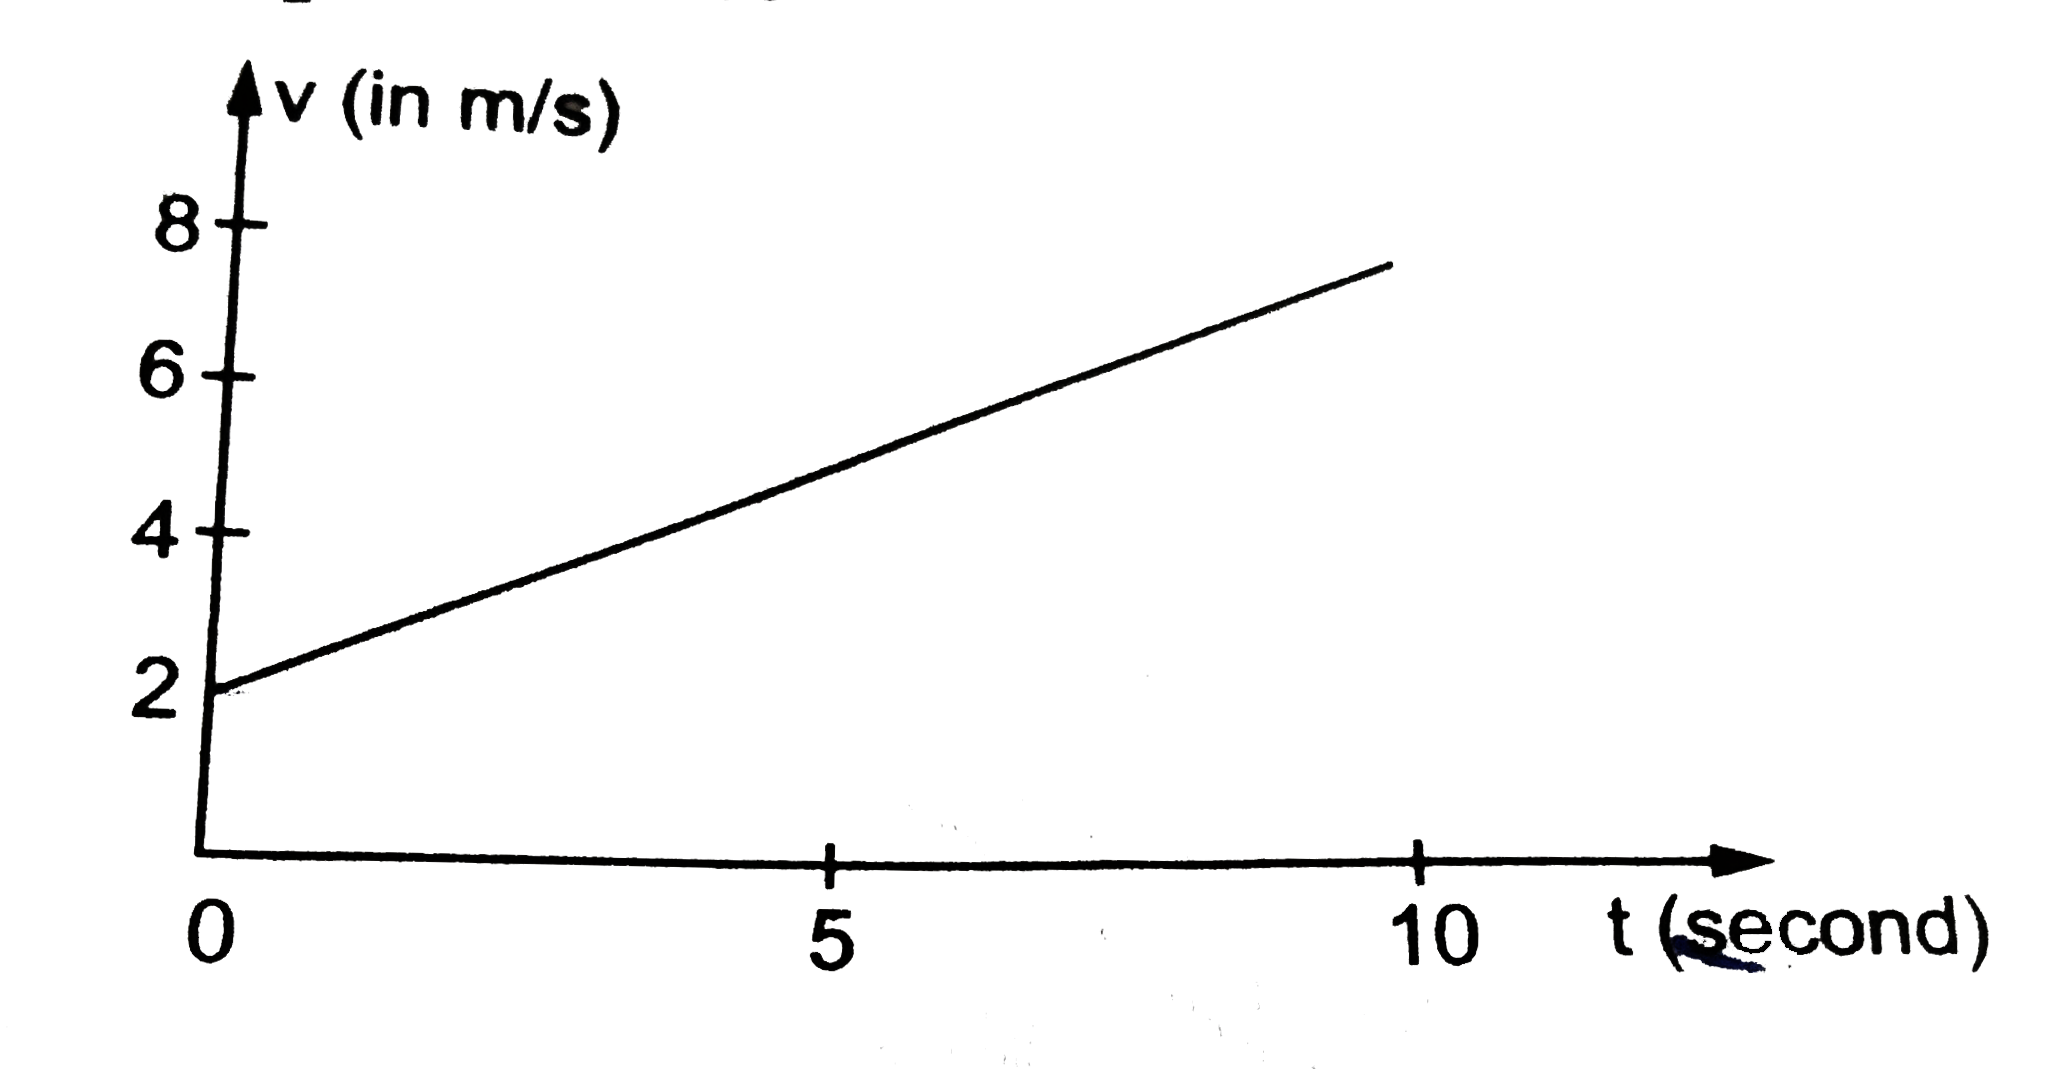 shows the graph of velocity versus tie for a particle going along the X-axis. Find a. the acceleration, b. The distance travelled in 0 to 10 s and c. the displacement in 0 to 10 s.
The correct Answer is:A, B, C
a. Initial velocity u=2ms<br>FiNAlvelocity<br>v=8ms<br>Time=10sec<br>Ae≤ration=v−ut,=8−210=610=0.6ms2,b.v2−u2=2aS<br>→Distance<br>S=v2−u22a<br>=82−222×0.6=50m<br> c. Displacement is same is distance travelled. Displacement = 50 m
Topper's Solved these Questions
- REST AND MOTION : KINEMATICSBOOK - HC VERMACHAPTER - REST AND MOTION : KINEMATICSEXERCISE - Objective 2
10 Videos
- PHYSICS AND MATHEMATICSBOOK - HC VERMACHAPTER - PHYSICS AND MATHEMATICSEXERCISE - Exercises
34 Videos
- ROTATIONAL MECHANICSBOOK - HC VERMACHAPTER - ROTATIONAL MECHANICSEXERCISE - Exercises
86 Videos
Similar Questions
Knowledge Check
Figure shows the graph of velocity versus time for a particle going along x axis. Initially at t = 0, particle is at x = 3m. Find position of particle at t = 2s. (in m)
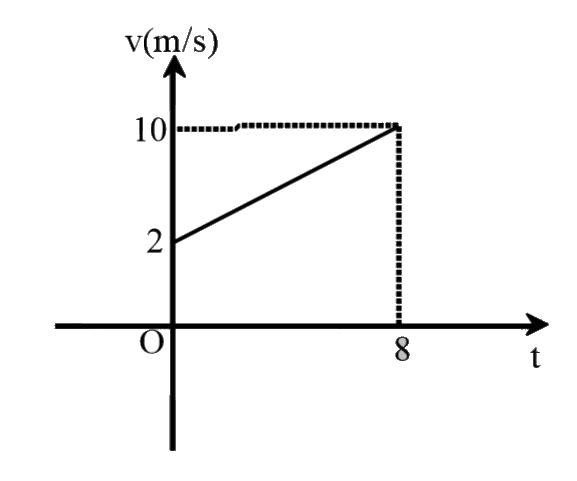 A9mB3mC12mD6m
Graph of velocity versus displacement of a particle moving in a straight line is as shown in figure.
The acceleration of the particle is.
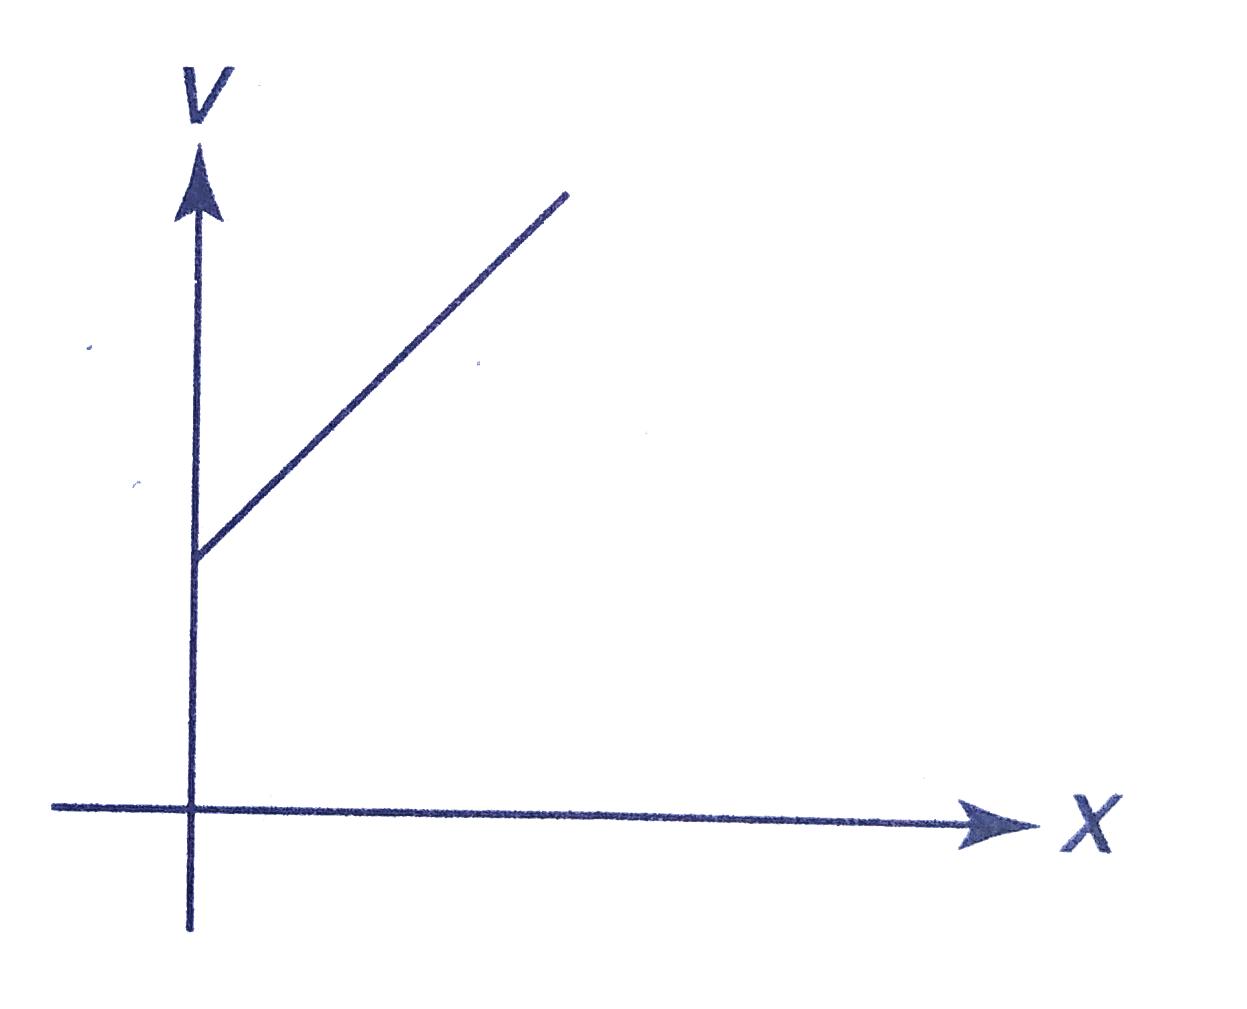 AconstantBincreases linearly with xCincreases parabolically with xDnone of these
The variation of velocity of a particle moving along straight line is shown in the figure. The distance travelled by the particle in 4 s is
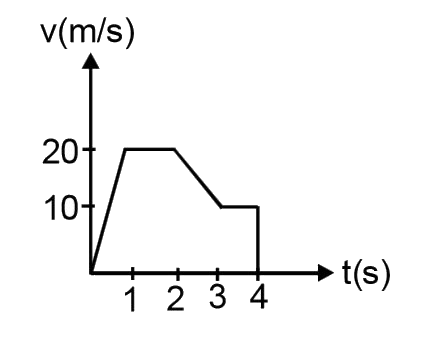 A25mB30mC55mD60m
The variation of velocity of a particle moving along a straight line is as shown in the figure given below. The distance travelled by the particle in 5 s is
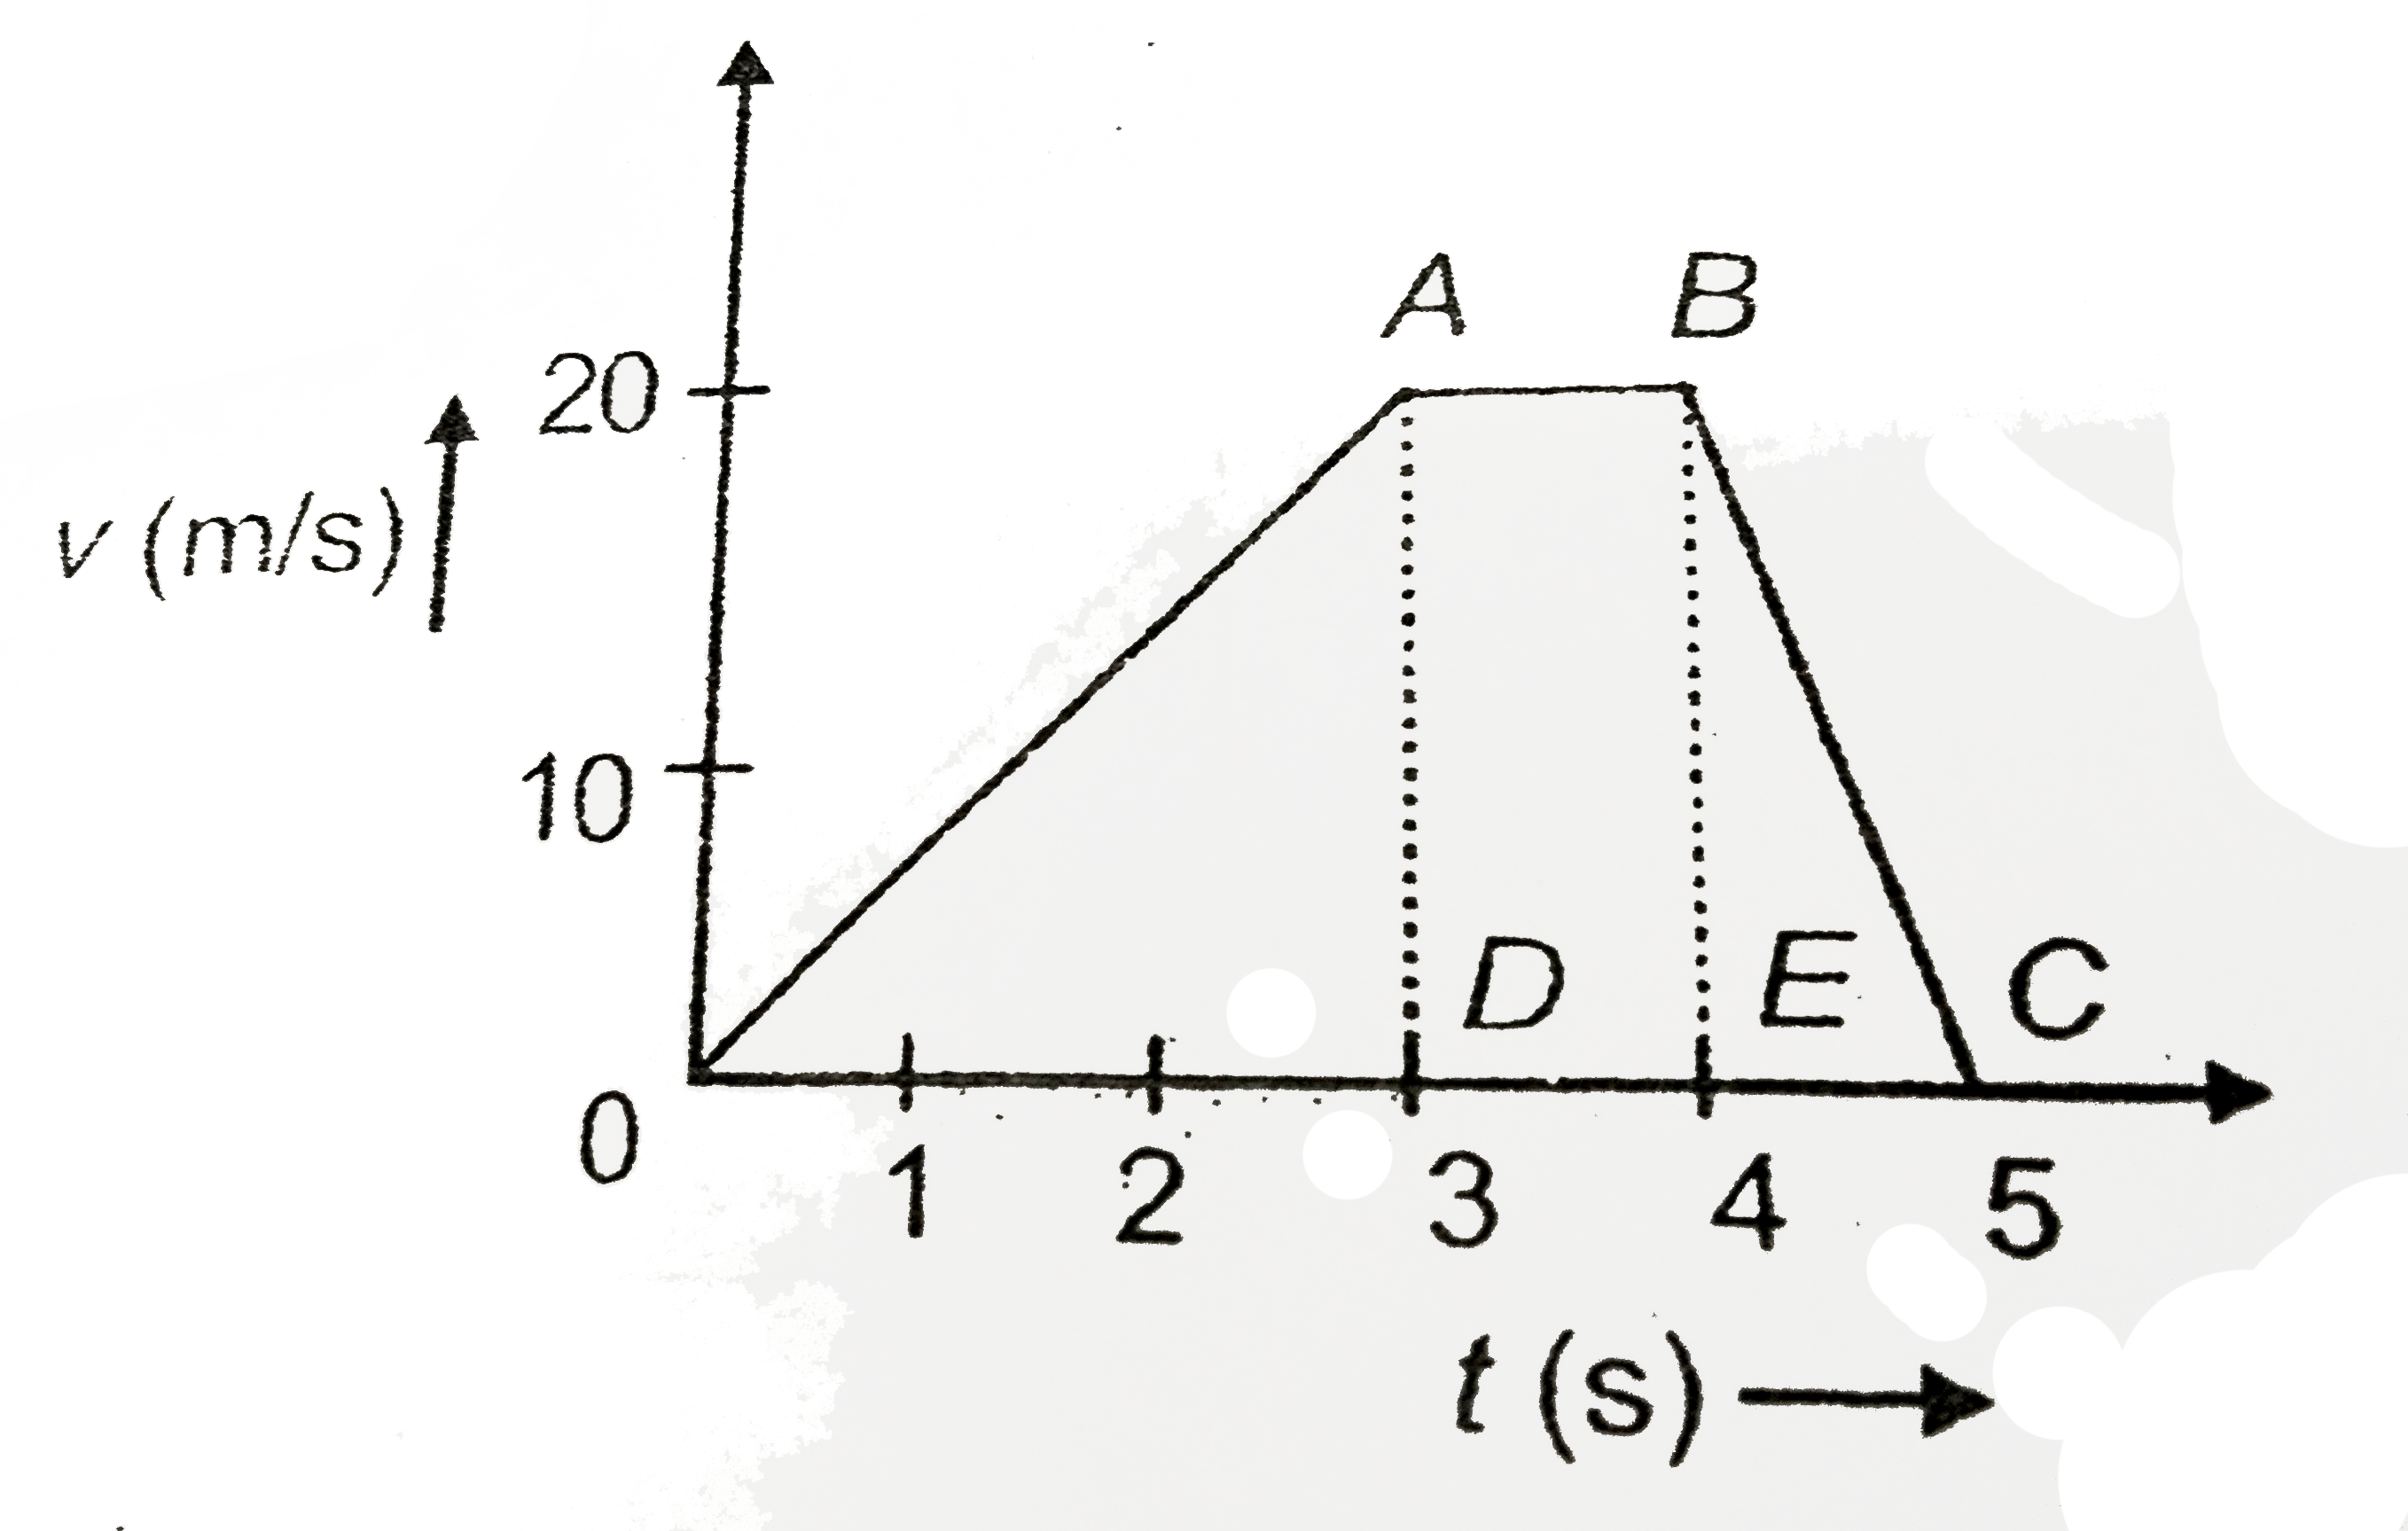
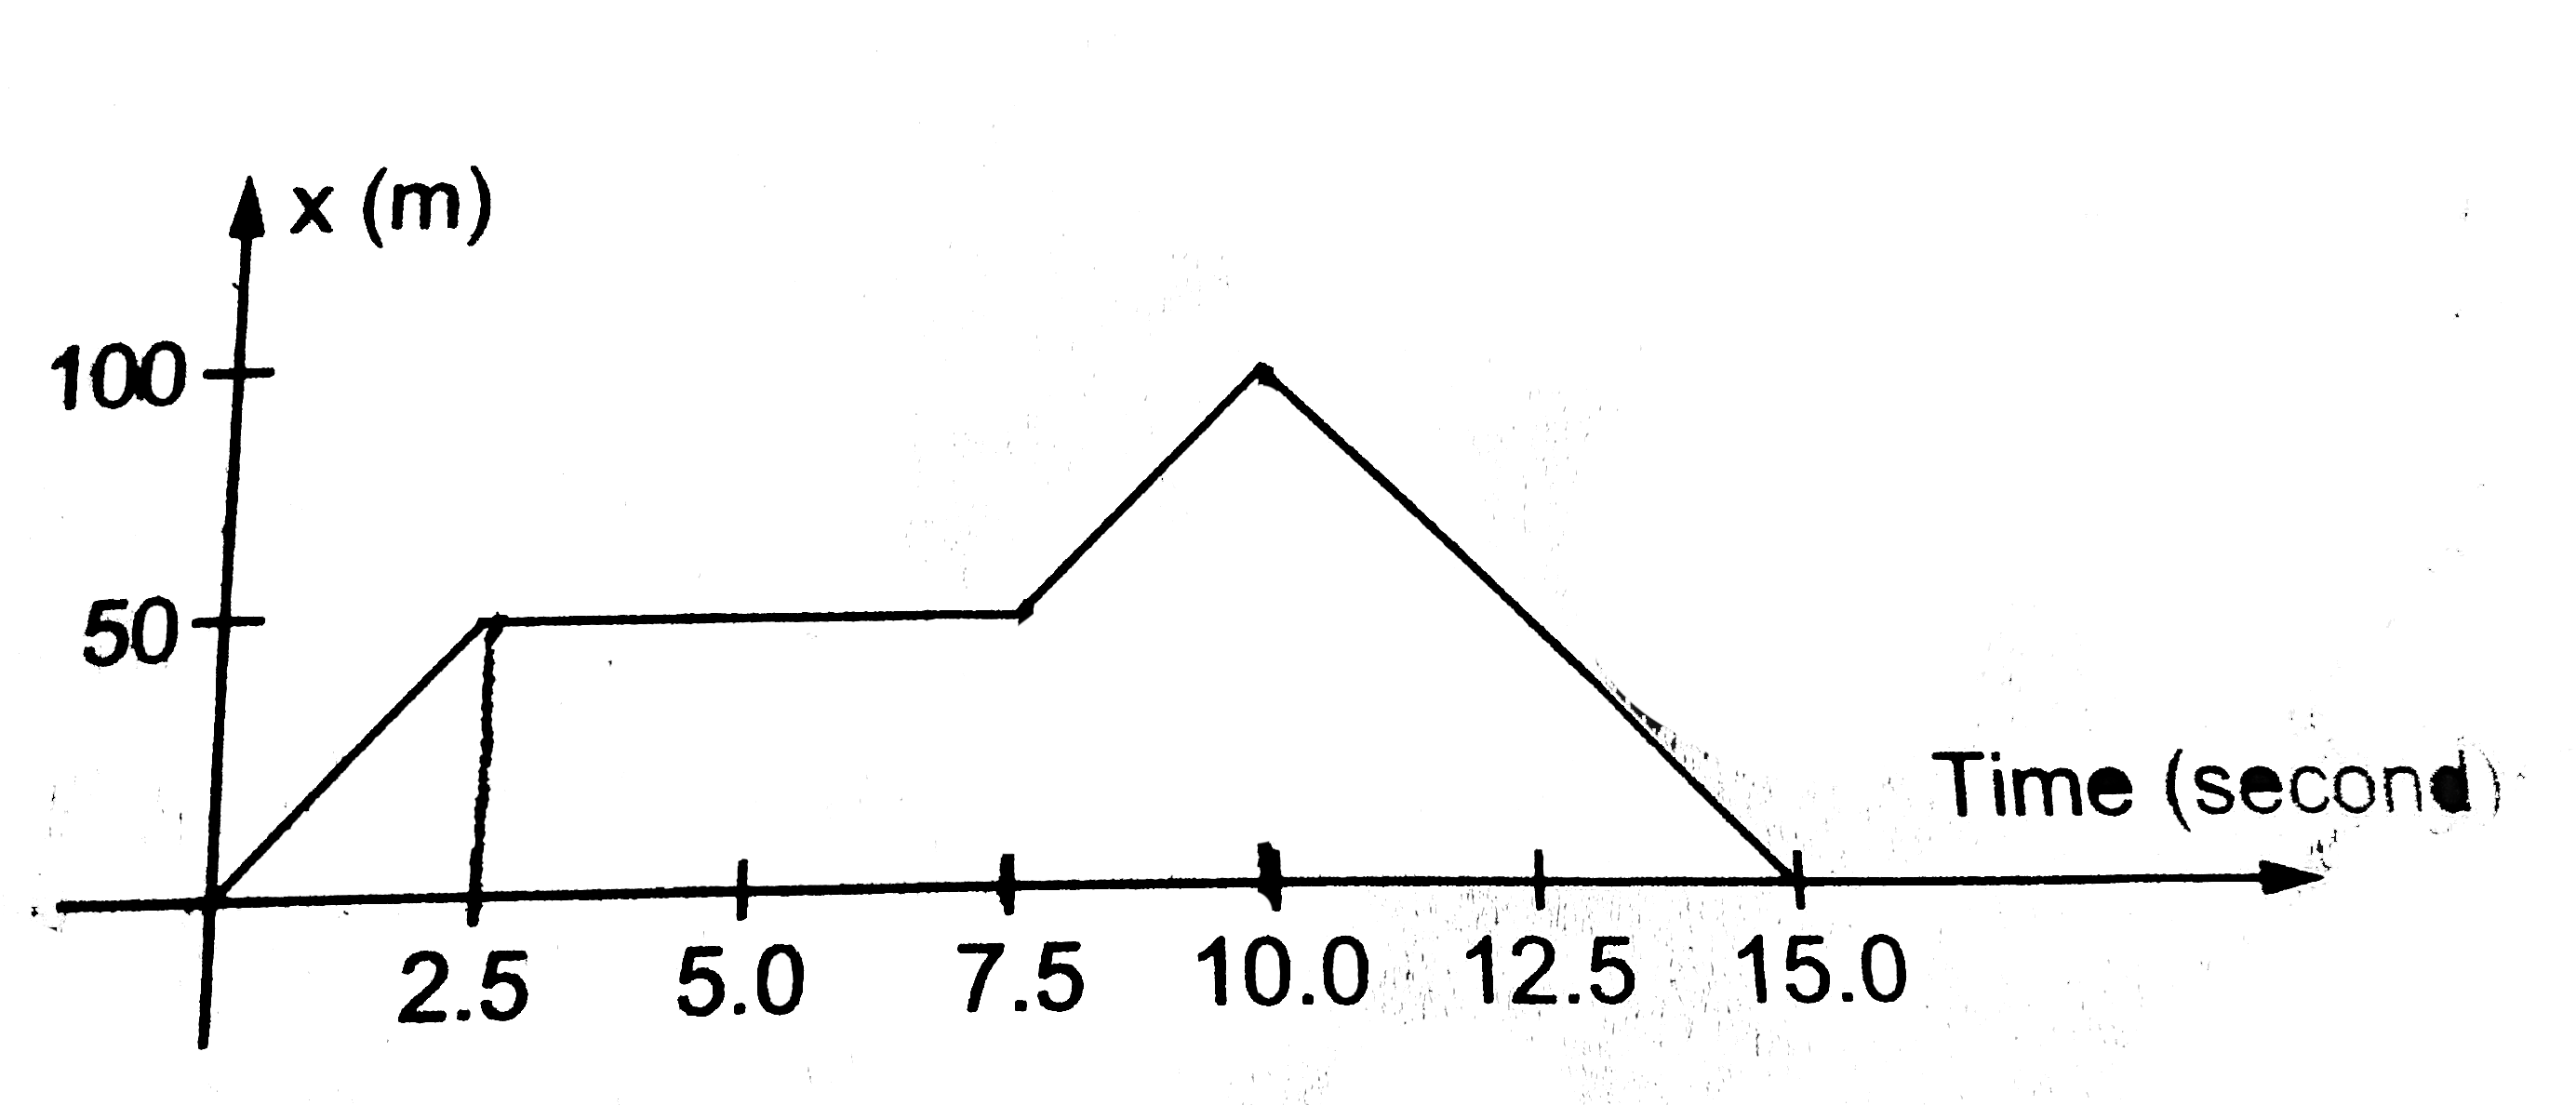
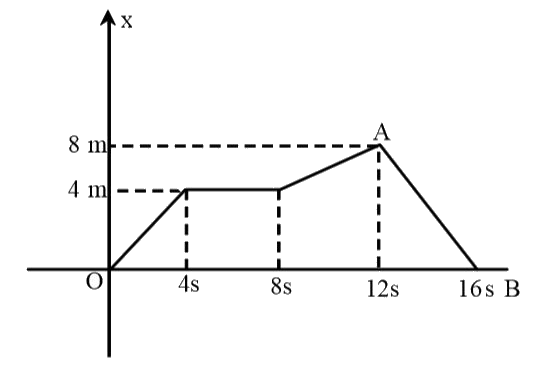
View SolutionFigure shows the graph of the x-coordinaste of a particle going along the X-axis as a function of time.Find a. te average velocity during 0 to 10s, b. instantaneous velocity at 2,5,8 and 12s.
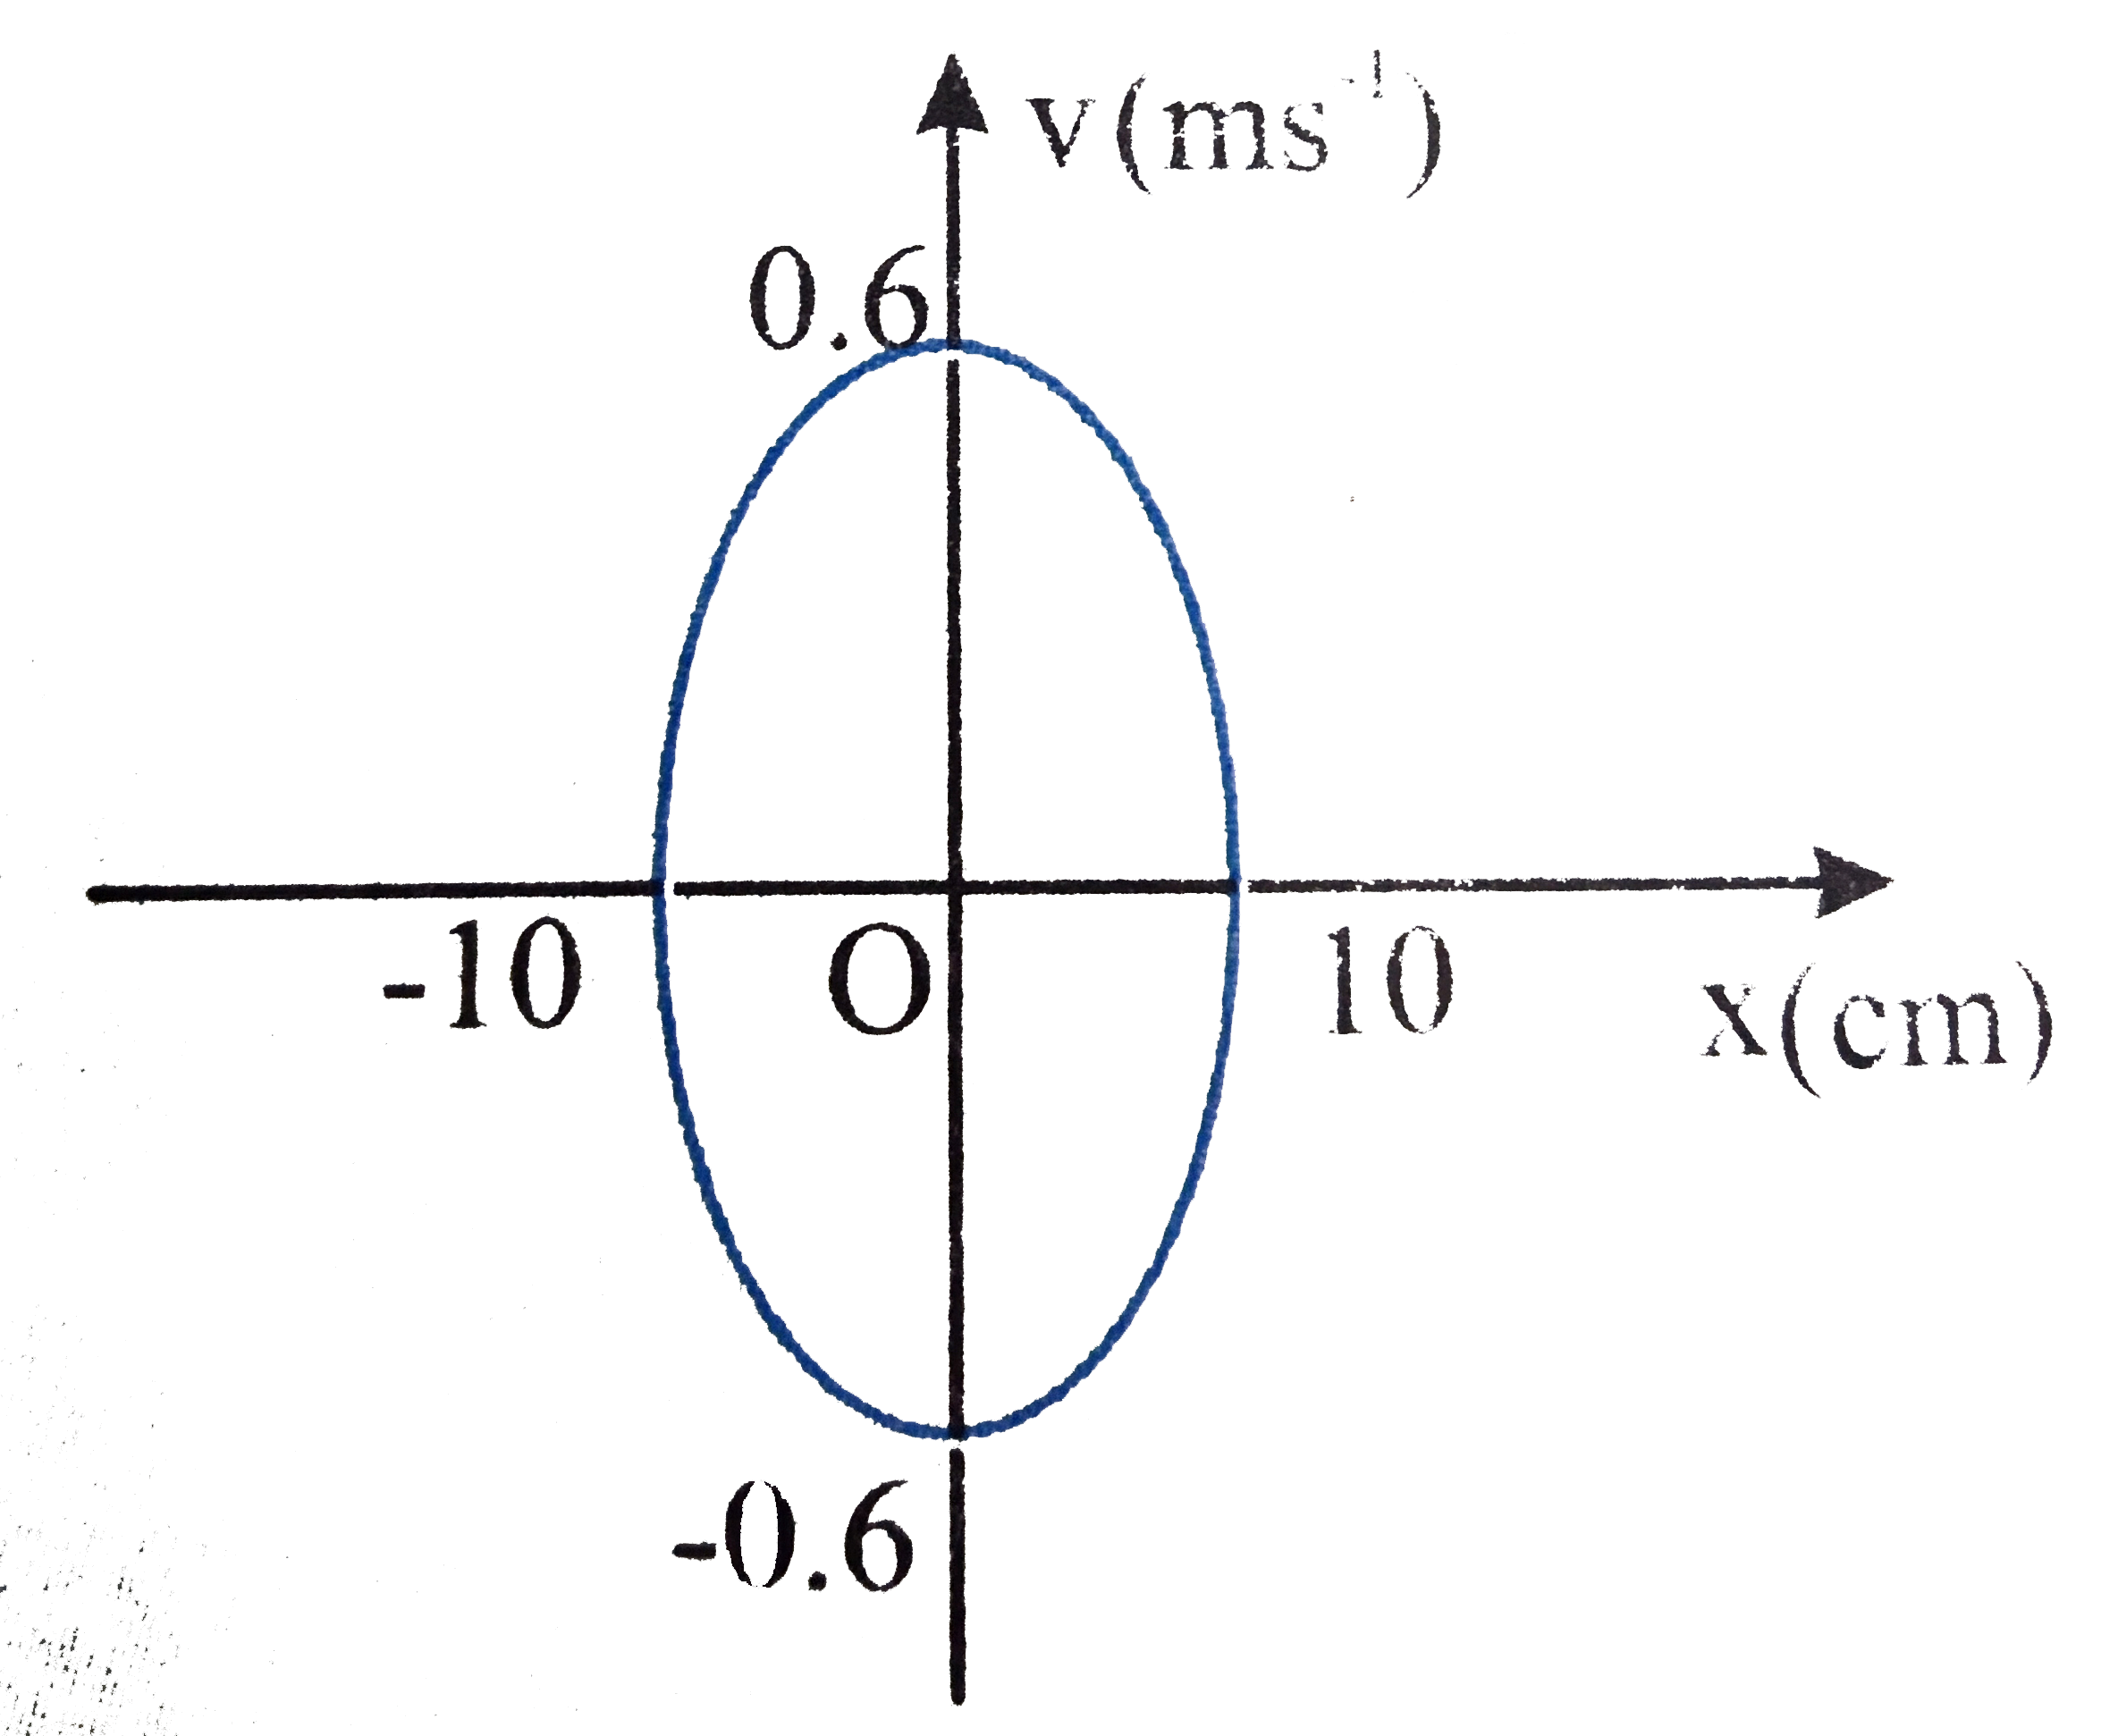
View SolutionFigure shows the graph of velocity versus displacement of a partciel executing simple harmonic motion. Find the period of oscillation of the particle.
View SolutionFigure shows the graph of the x-co-ordinate of a particle going along the x-axis as function of time. Find the instantaneous speed of particle at t = 12.5 s (in m/s)
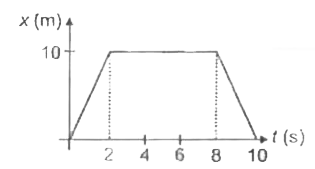
View SolutionThe position - time graph for a particle moving along a straight line is shown in figure. The total distance travelled by it in time t = 0 to t = 10 s is
View Solution

