To draw a figure as per the given information. (Use a graph paper)
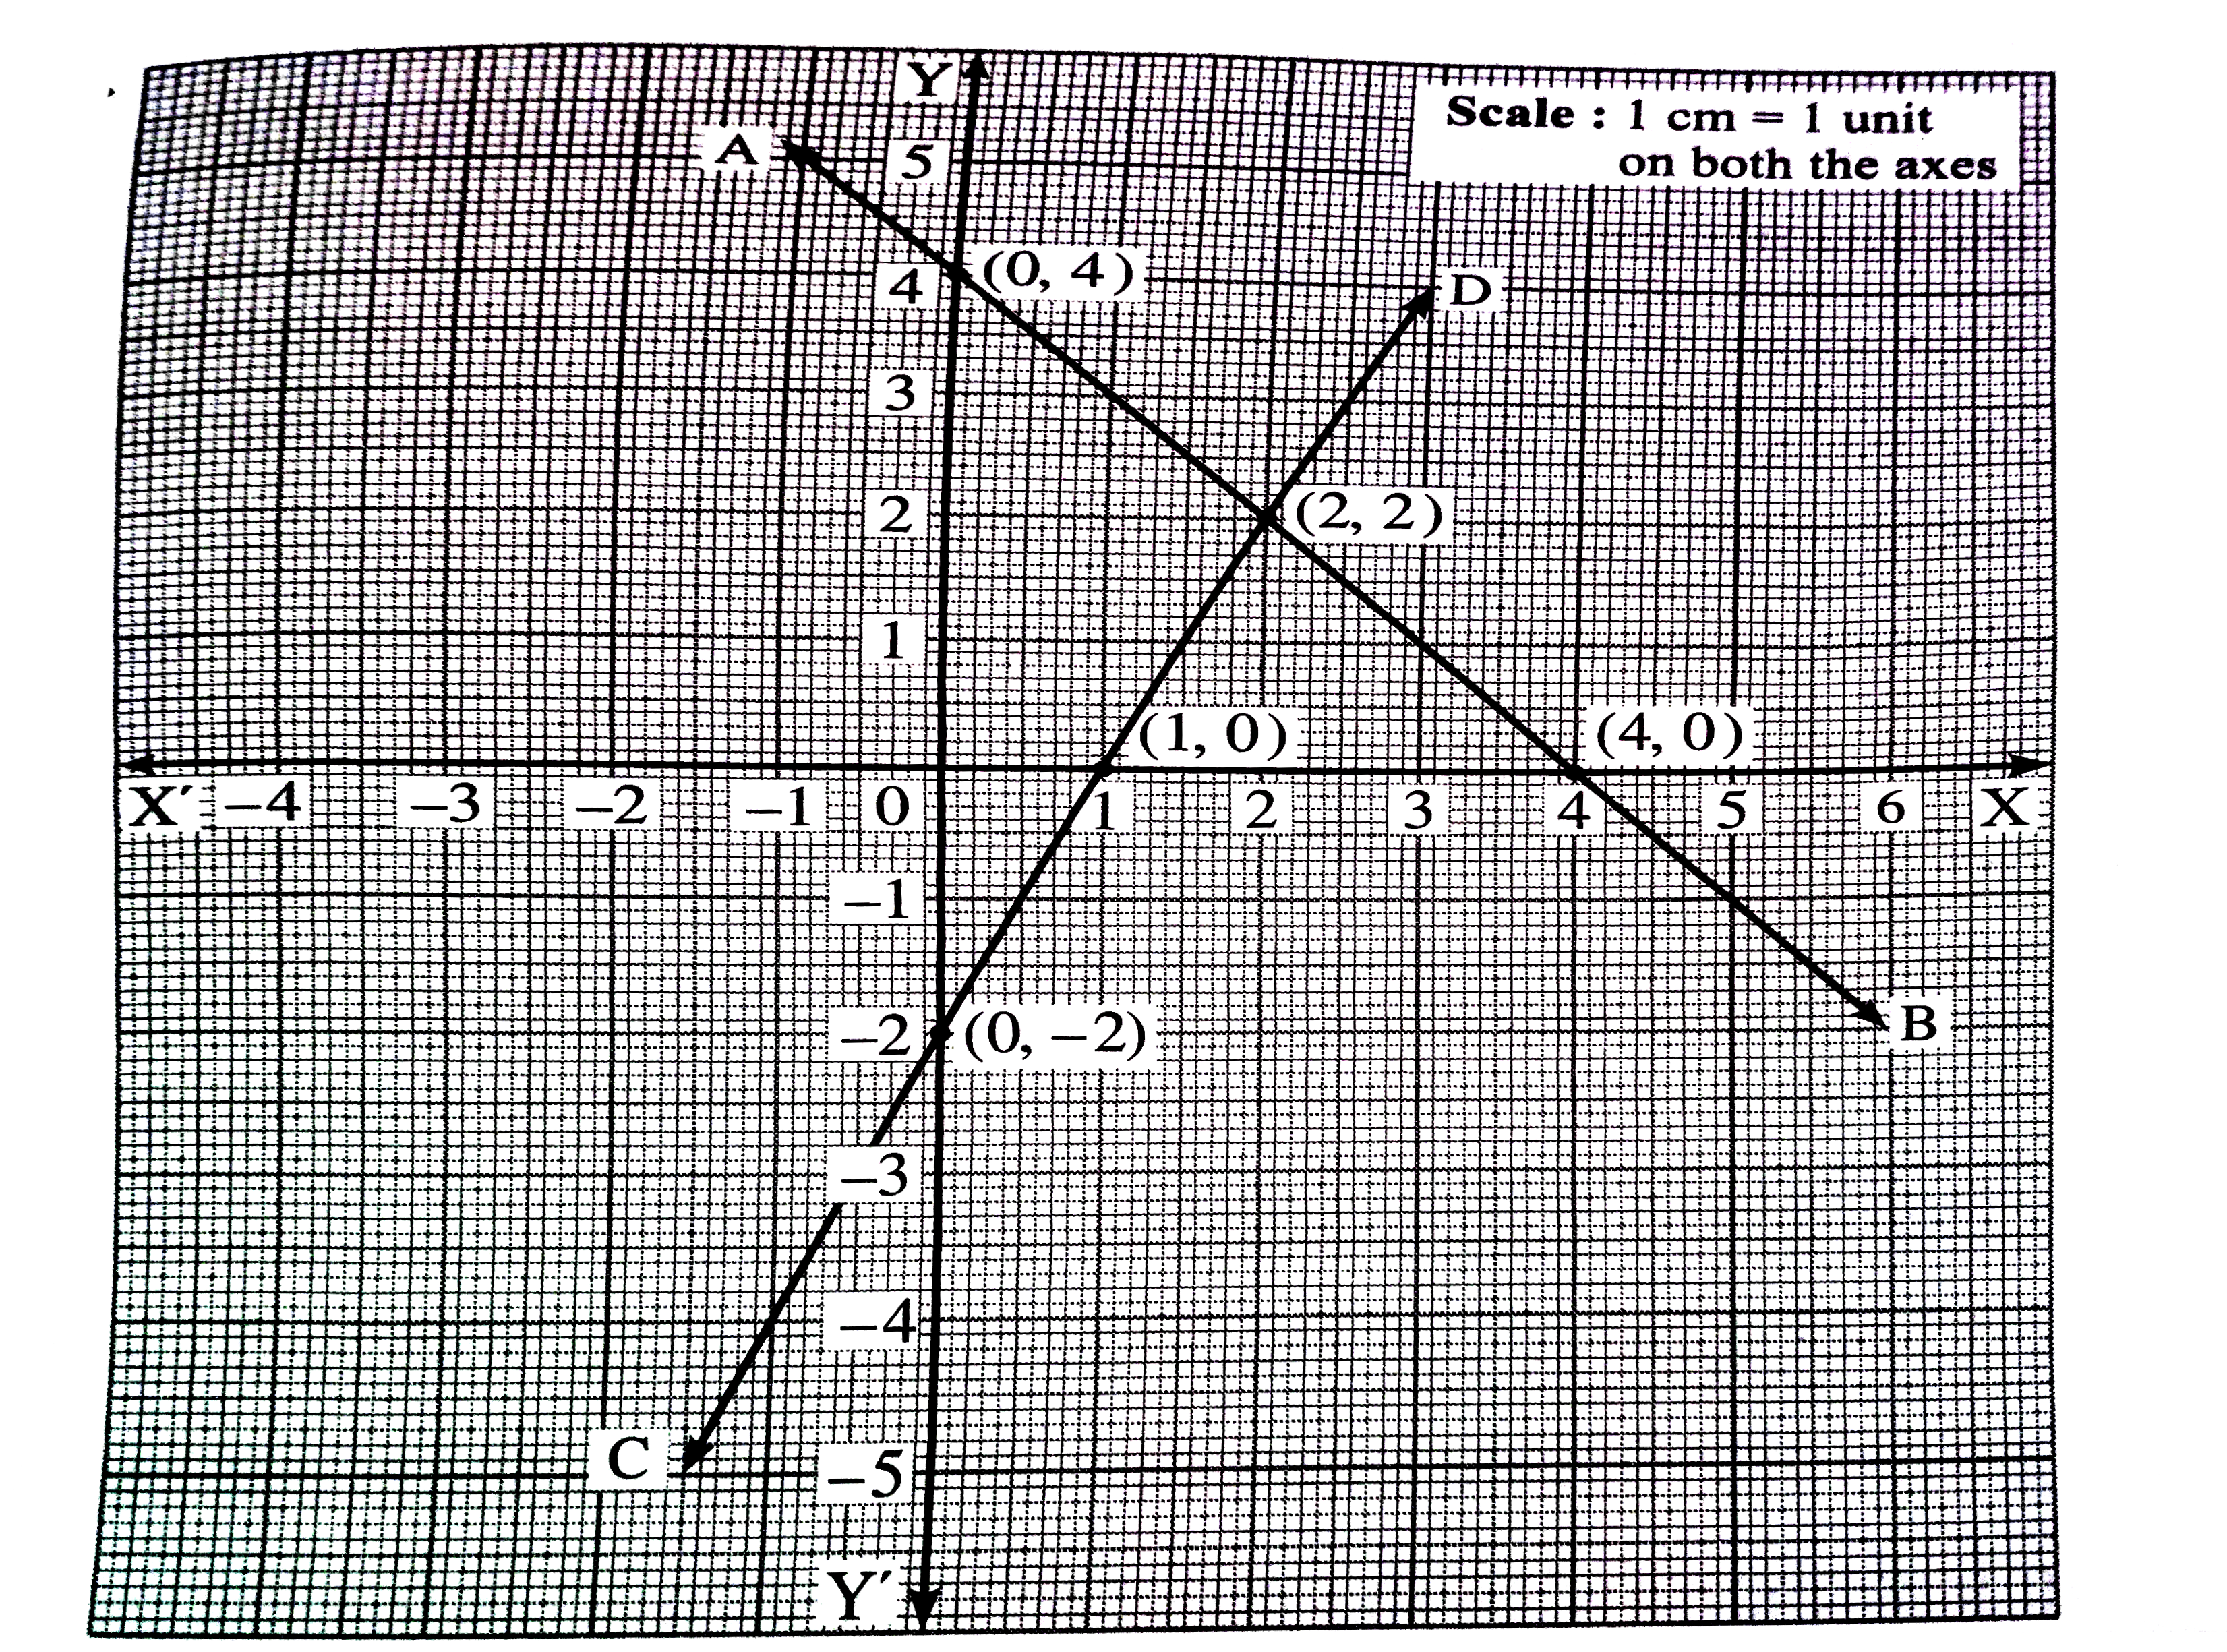
The coordinates of the point of intersection of the lines AB and CD are (2,2).
Topper's Solved these Questions
- LINEAR EQUATIONS IN TWO VARIABLESBOOK - NAVNEET PUBLICATION - MAHARASHTRA BOARDCHAPTER - LINEAR EQUATIONS IN TWO VARIABLESEXERCISE - Assignment 1.4
9 Videos
- LINEAR EQUATIONS IN TWO VARIABLESBOOK - NAVNEET PUBLICATION - MAHARASHTRA BOARDCHAPTER - LINEAR EQUATIONS IN TWO VARIABLESEXERCISE - Practice set 1.1
9 Videos
- LINEAR EQUATIONS IN TWO VARIABLESBOOK - NAVNEET PUBLICATION - MAHARASHTRA BOARDCHAPTER - LINEAR EQUATIONS IN TWO VARIABLESEXERCISE - Assignment 1.3
10 Videos
- GEOMETRIC CONSTRUCTIONS BOOK - NAVNEET PUBLICATION - MAHARASHTRA BOARDCHAPTER - GEOMETRIC CONSTRUCTIONS EXERCISE - CHALLENGING QUESTION
4 Videos
- MENSURATIONBOOK - NAVNEET PUBLICATION - MAHARASHTRA BOARDCHAPTER - MENSURATIONEXERCISE - Assignment 8.5
8 Videos
Similar Questions
To draw a figure from the given information:
Sequence : 1,3,6,10….

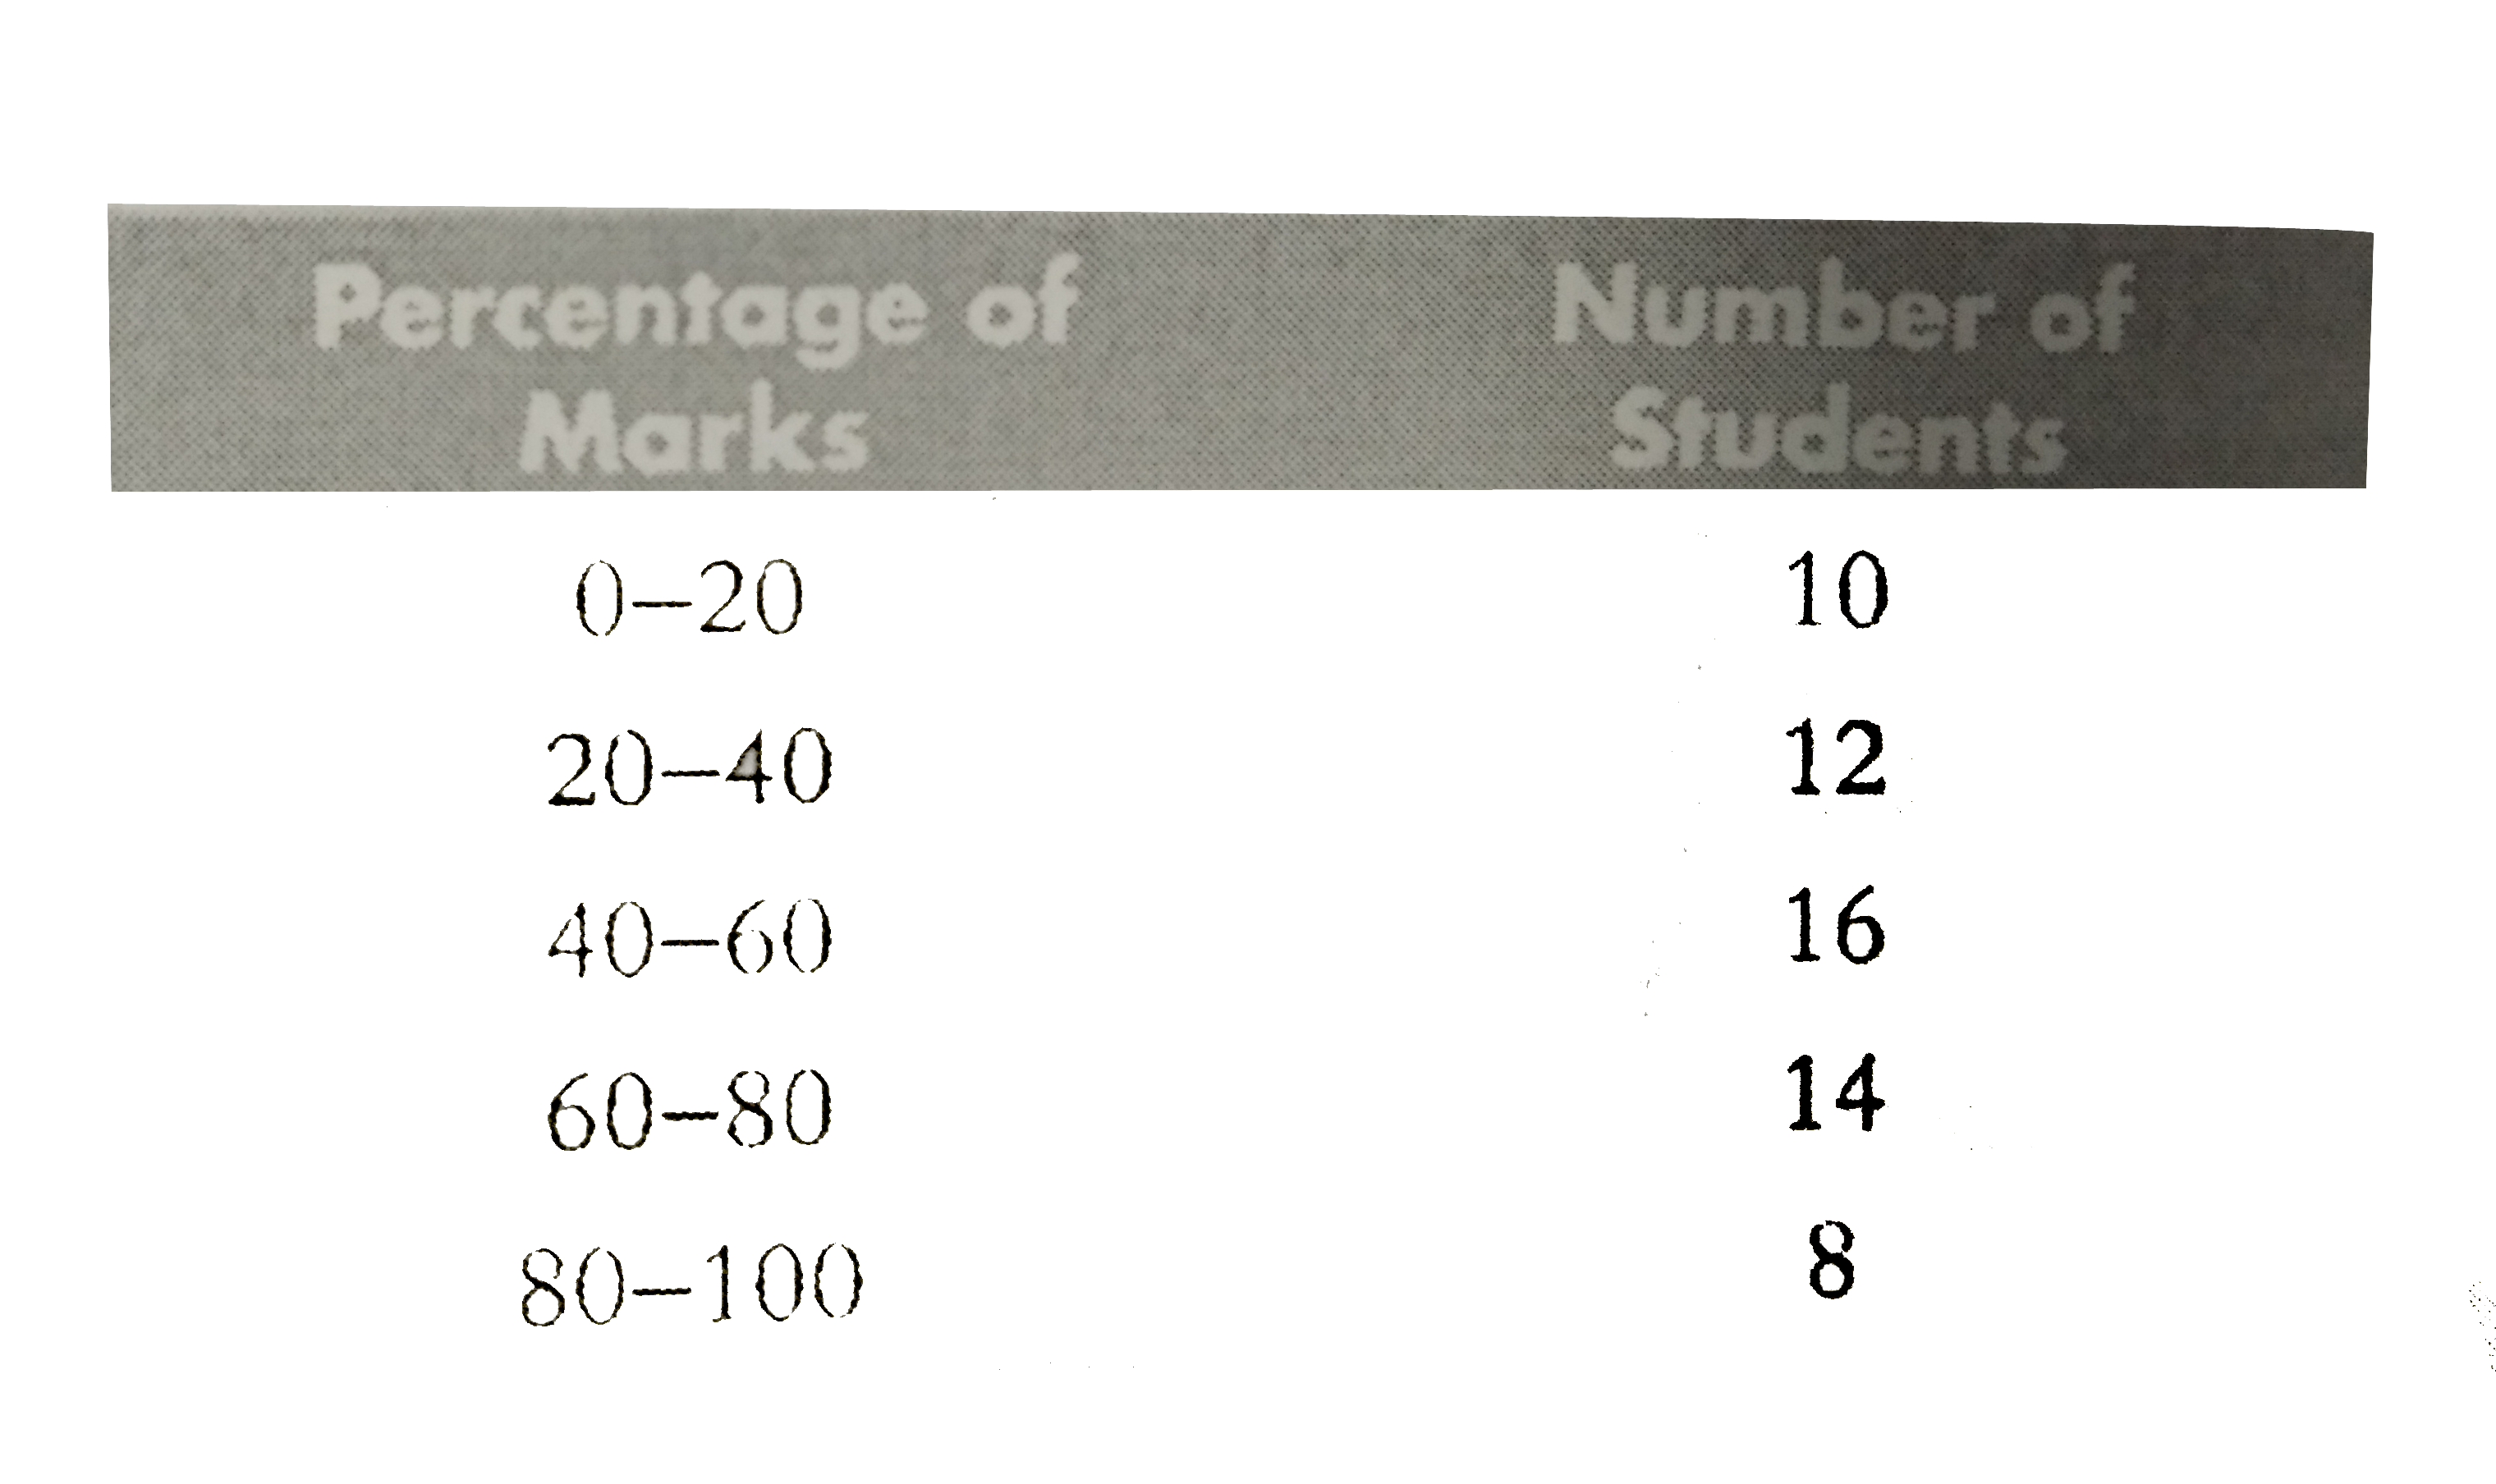
View SolutionA mathematics aptitude test of 50 students was recorded as follows :

Draw a histogram for the above data using a graph paper and locate the mode.
View SolutionA Mathematics aptitude test of 50 students was recorded as follows:

Draw a histogram for the above data using a graph paper and locate the mode:
View SolutionFor the given distribution showing the number of runs scored by 50 batsmen. Extimate the mode of the data :

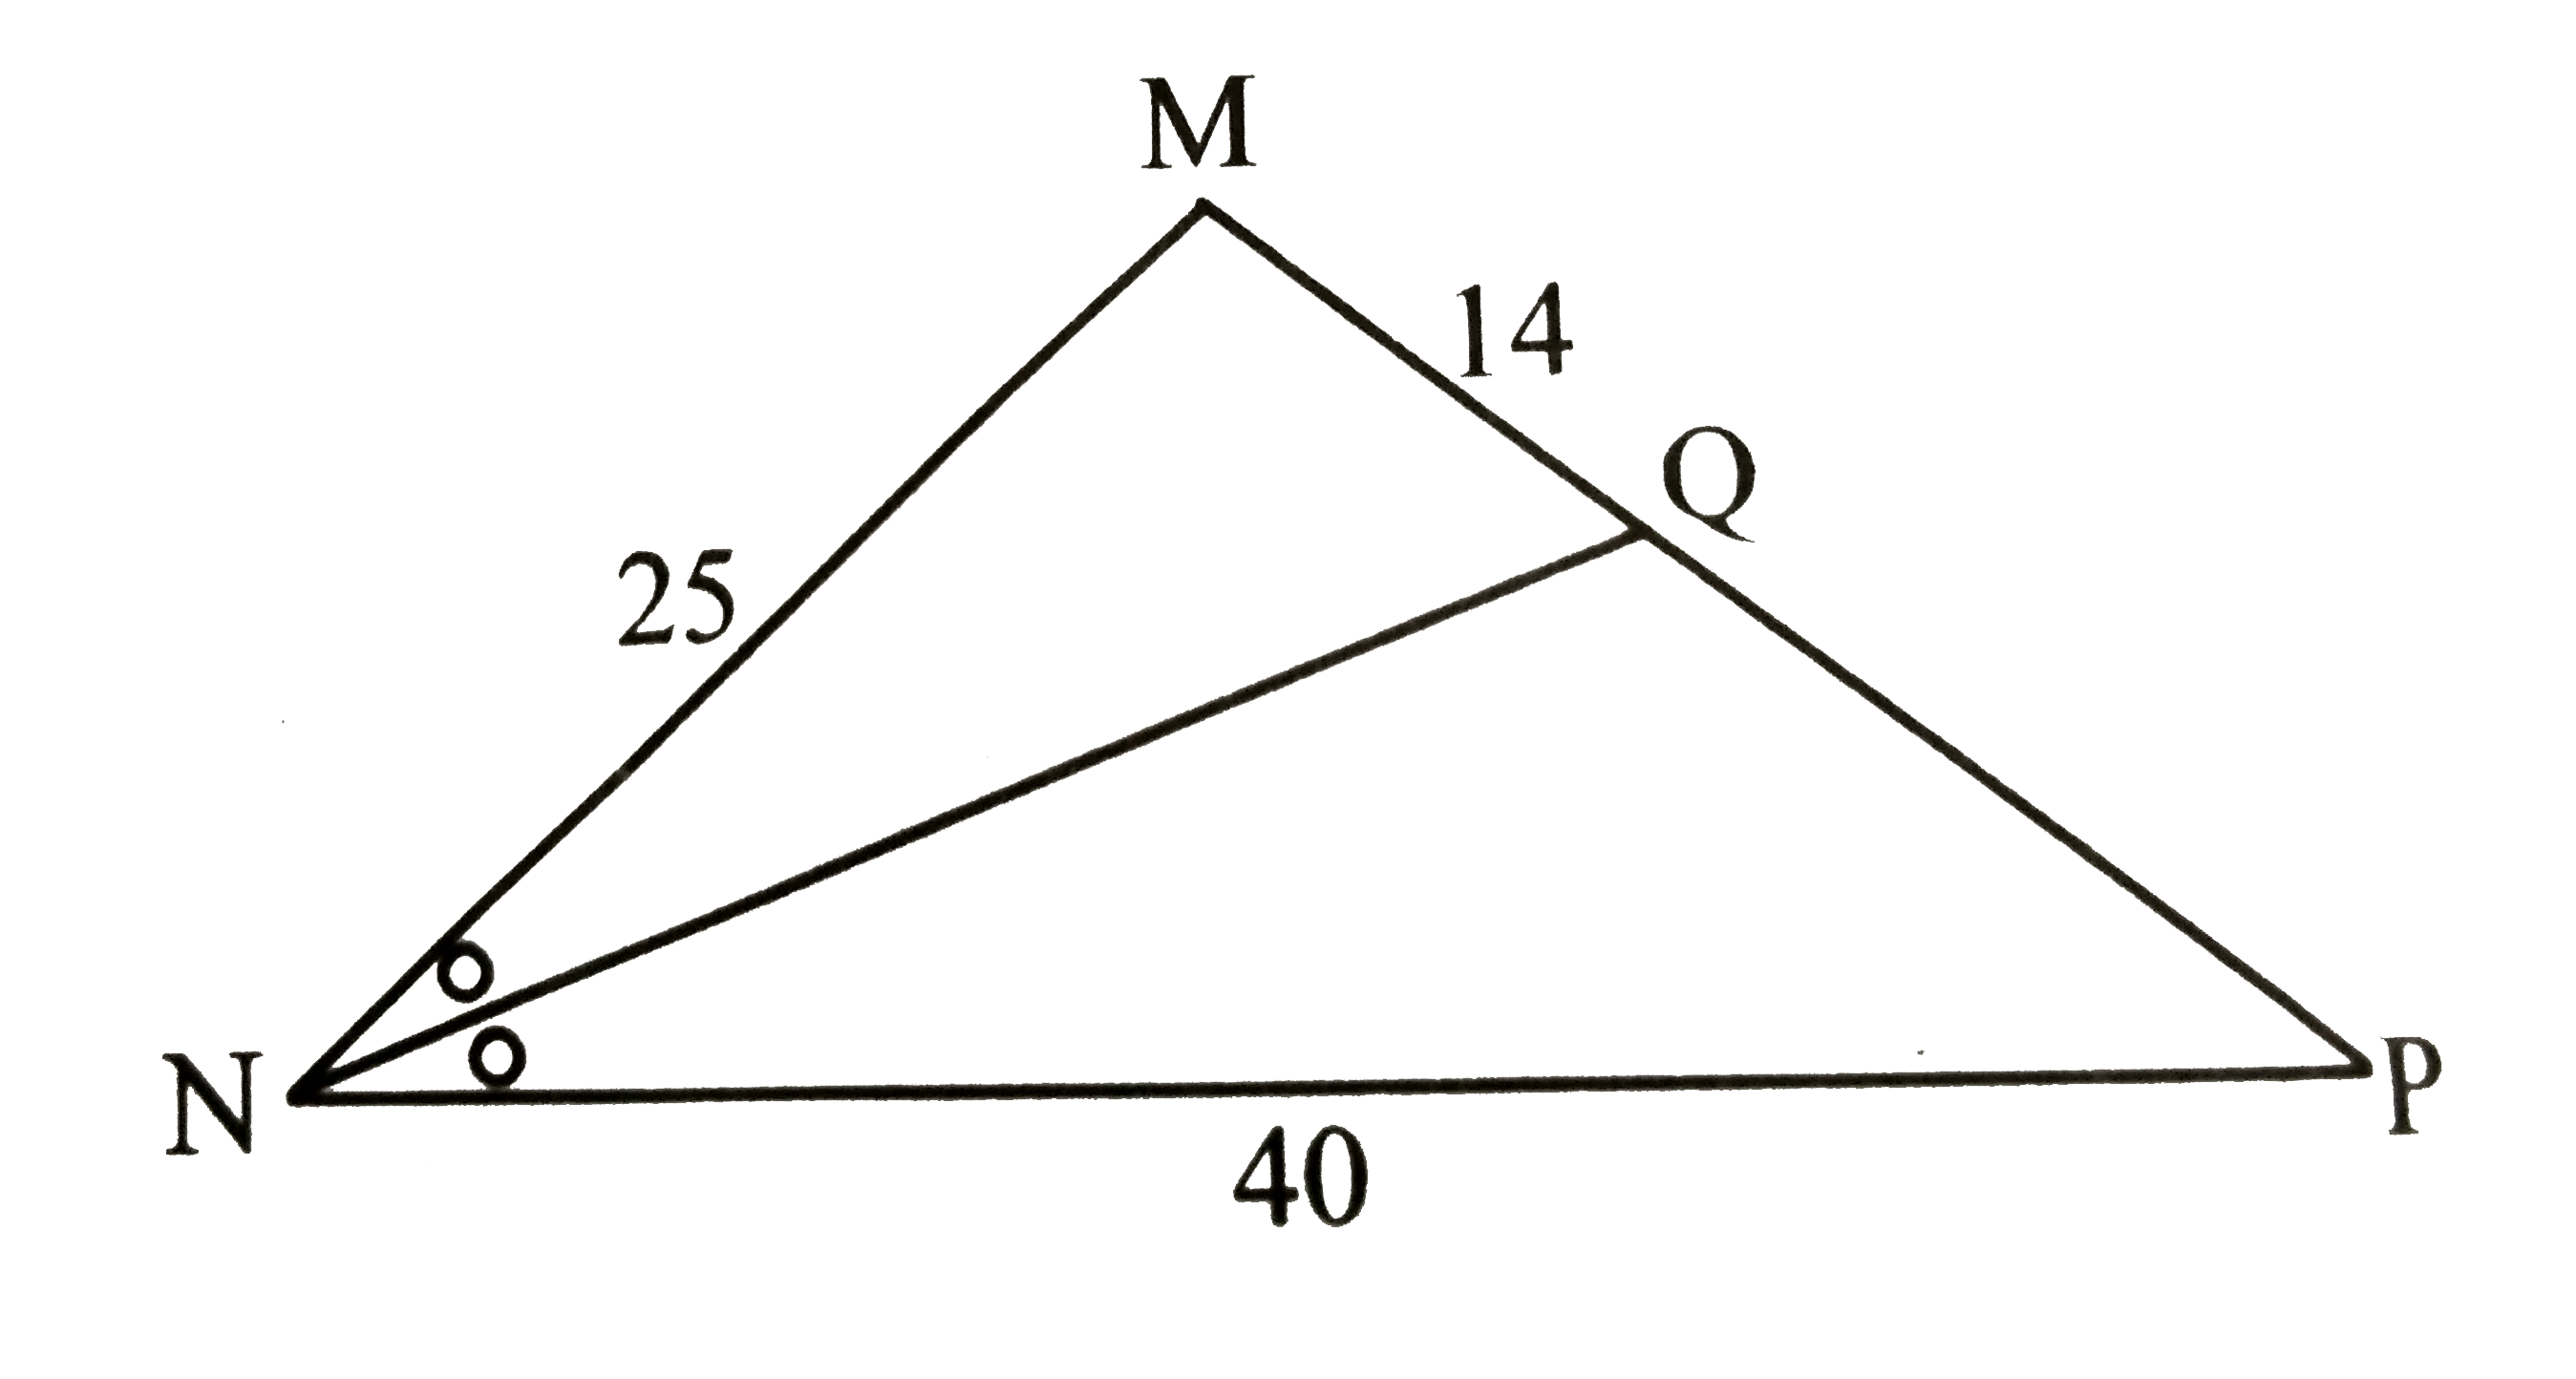
View SolutionFind QP using given information in the figure.
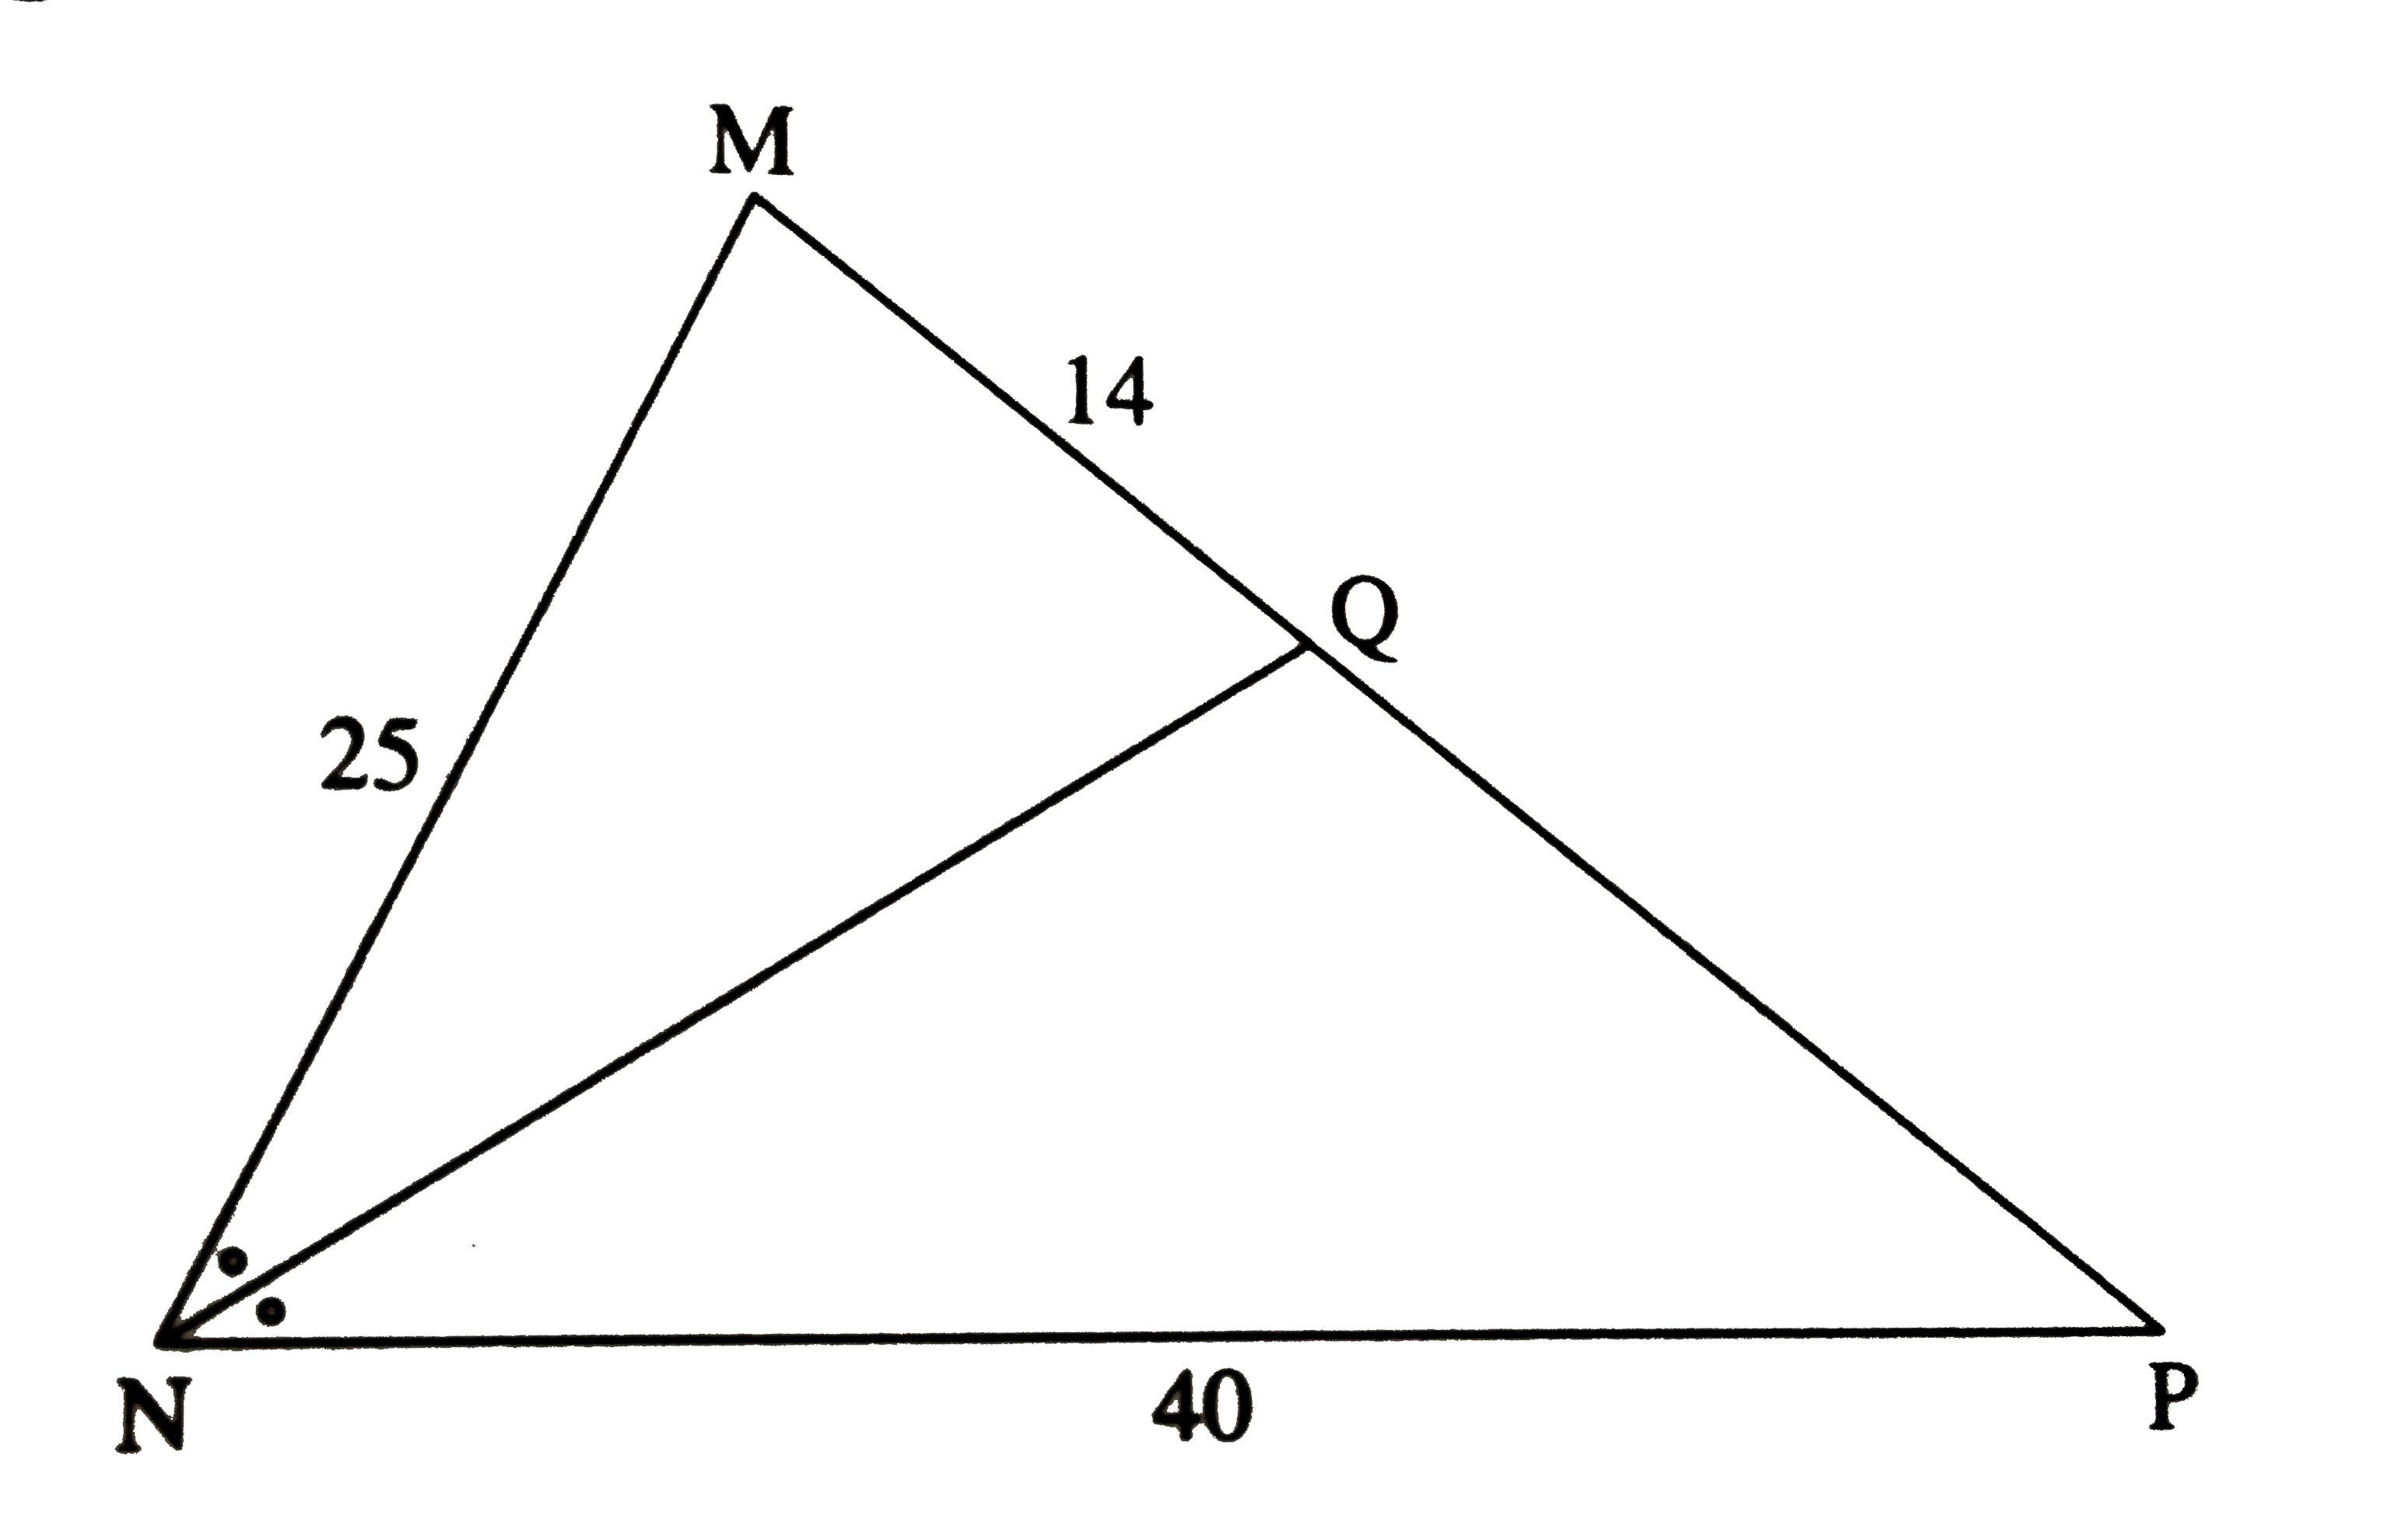
View SolutionFind QP using given information in the figure.
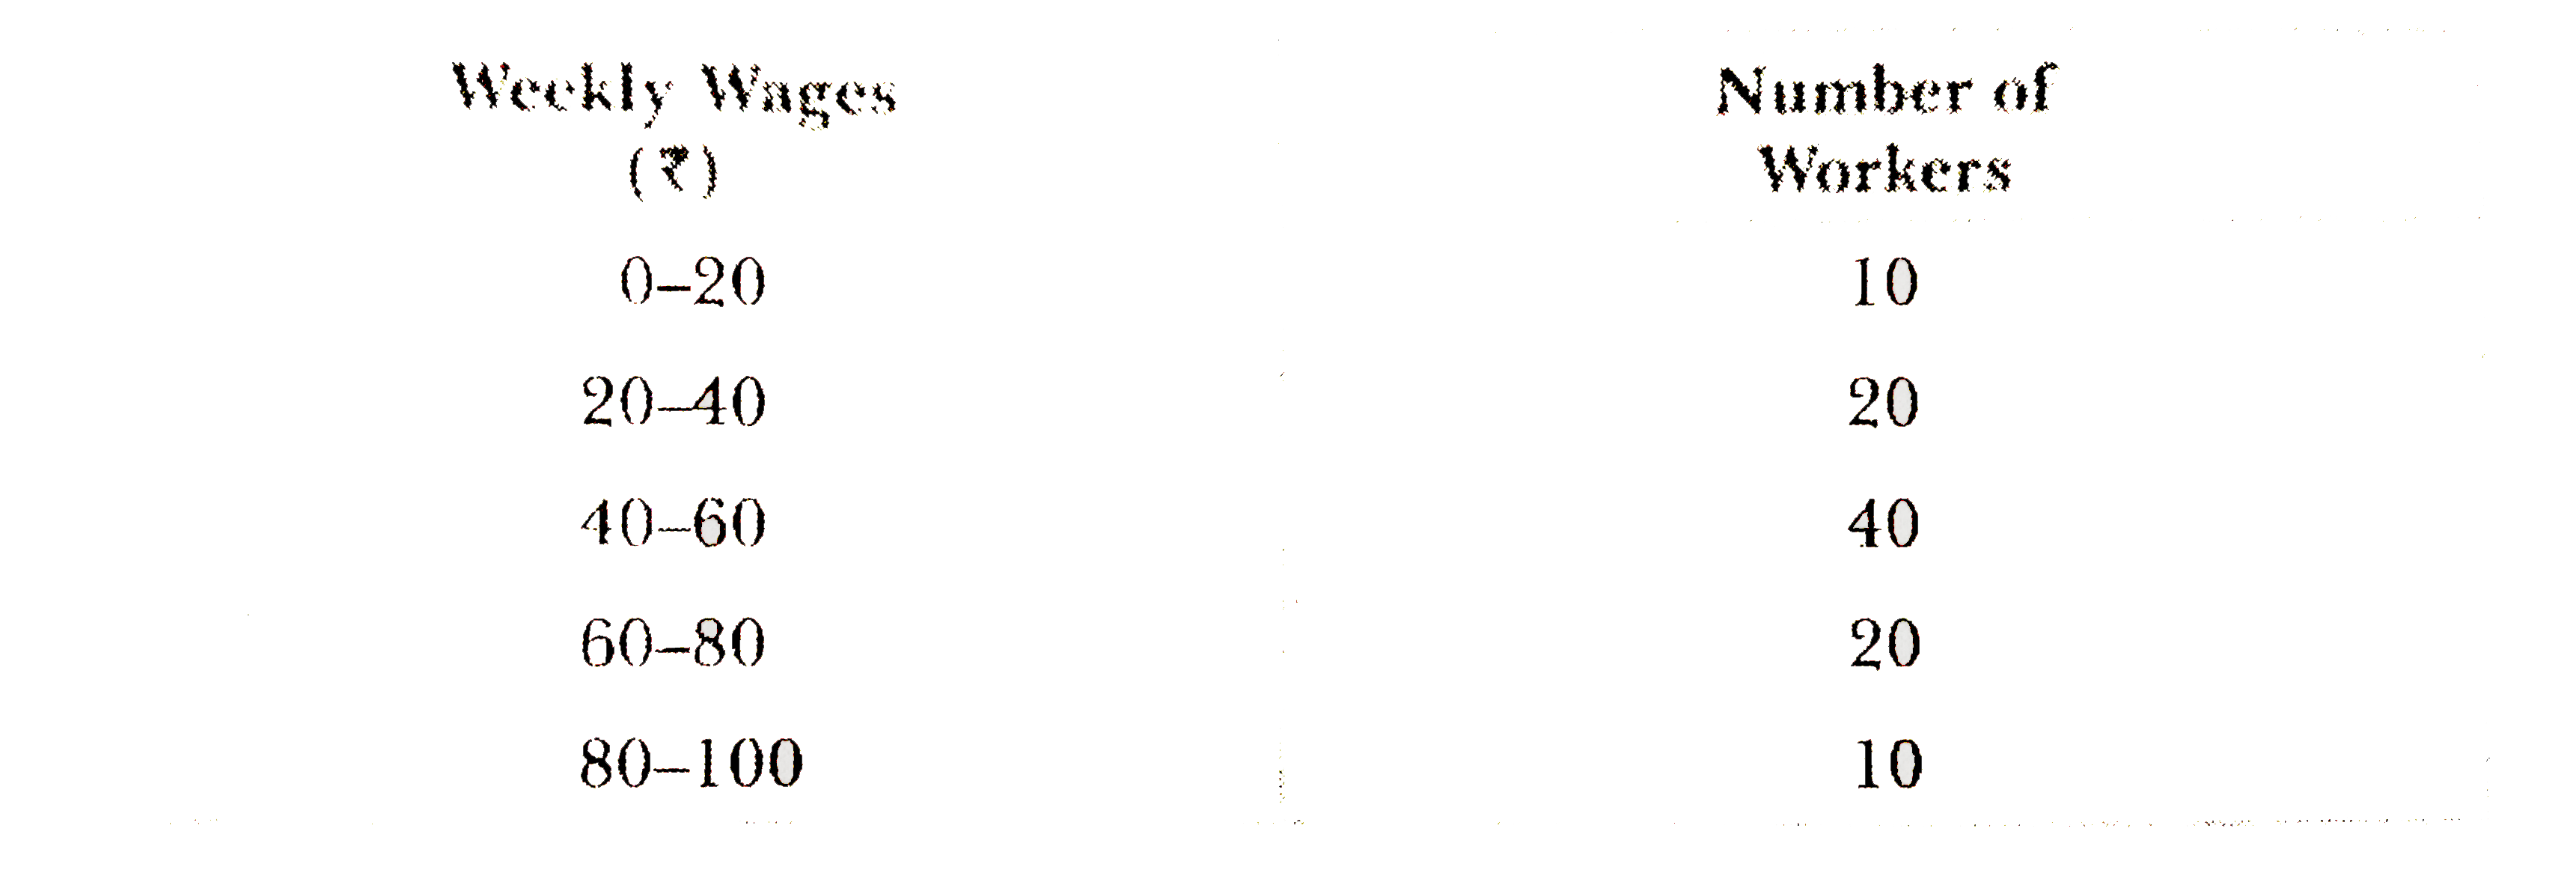
View SolutionDraw the 'less than' and 'more than' ogive on the same graph paper from the data given below :

View SolutionDraw the 'less than' and 'more than' ogive on the same graph paper from the data given below :
View SolutionDraw a histogram of the following data on a graph paper and estimate the mode .
View SolutionThe perimeter P and sides of a square are connected by the relation P=4s. Draw the graph of this relation on the graph paper.
View Solution
