The following frequency distribution table shows the number of mango trees in a grove, their yield of mangoes and also the cumulative frequency. Complete the following activity to find the median of the data.
![The following frequency distribution table shows the number of mango trees in a grove, their yield of mangoes and also the cumulative frequency. Complete the following activity to find the median of the data. Here, total of frequencies N=250. (N)/(2)=(250)/(2)=125 The cumulative frequency which is just greater than 125 is square :. the corresponding class square is the median class. L=150,f=90,cf=square,h=50 Median =L+[(square)/(f)]xxh =150+[(square)/(90)]xx50 =150+(square)/(90)xx50~~184.4 The median of the data is 184.4 mangoes.](https://d10lpgp6xz60nq.cloudfront.net/physics_images/NVT_21_MAT_P1_X_C06_E01_021_Q01.png)
Here, total of frequencies N=250.
N2=2502=125
The cumulative frequency which is just greater than 125 is □
∴ the corresponding class □ is the median class.
L=150,f=90,cf=□,h=50
Median =L+[□f]×h
=150+[□90]×50
=150+□90×50≈184.4
The median of the data is 184.4 mangoes.
Video Solution
Text Solution
The cumulative frequency which is just greater than 125 is □ 53.
∴ the corresponding class □ 150-200 is the median class.
L=150,f=90,cf=□63,h=50
Median =L+⎡⎣N2−cff⎤⎦×h
=150+[125−6390]×50
=150+6290×50≈184.4
|
Updated on:21/07/2023
Topper's Solved these Questions
- BOOK - NAVNEET PUBLICATION - MAHARASHTRA BOARDCHAPTER - STATISTICSEXERCISE - Assignment 6.14videos
STATISTICS
- BOOK - NAVNEET PUBLICATION - MAHARASHTRA BOARDCHAPTER - STATISTICSEXERCISE - Assignment 6.25videos
STATISTICS
- BOOK - NAVNEET PUBLICATION - MAHARASHTRA BOARDCHAPTER - SIMILARITYEXERCISE - SUBJECTIVE TYPE20videos
SIMILARITY
- BOOK - NAVNEET PUBLICATION - MAHARASHTRA BOARDCHAPTER - THEOREMS EXERCISE - CIRCLE15videos
THEOREMS
Similar Questions
Knowledge Check
- Question 1 - Select One
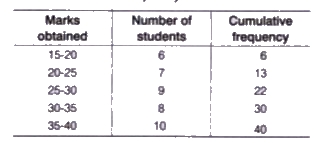
The median of the frequency distribution is
 A28.88B30.88C35.88DNone of these
 - Question 2 - Select One
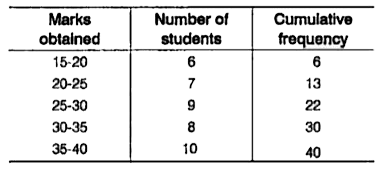
The median of the frequency distribution is
 A28.88B30.88C35.88DNone of these
The frequency distribution table shows the number of mango tree in a grove and their yield of mangoes.Find the megian of data.
 View Solution
Cumulative Frequency Distribution
View SolutionFor the following frequency distribution

The upper limit of median class isView SolutionIn the following frequency distribution, what is the upper limit of the median class ?
 View Solution
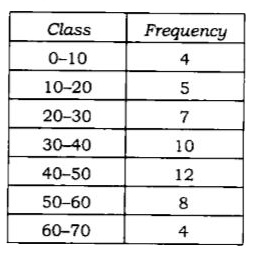
Consider the following frequency distribution
What is the median class?
 View Solution
Median of discrete frequency distribution
View Solution


