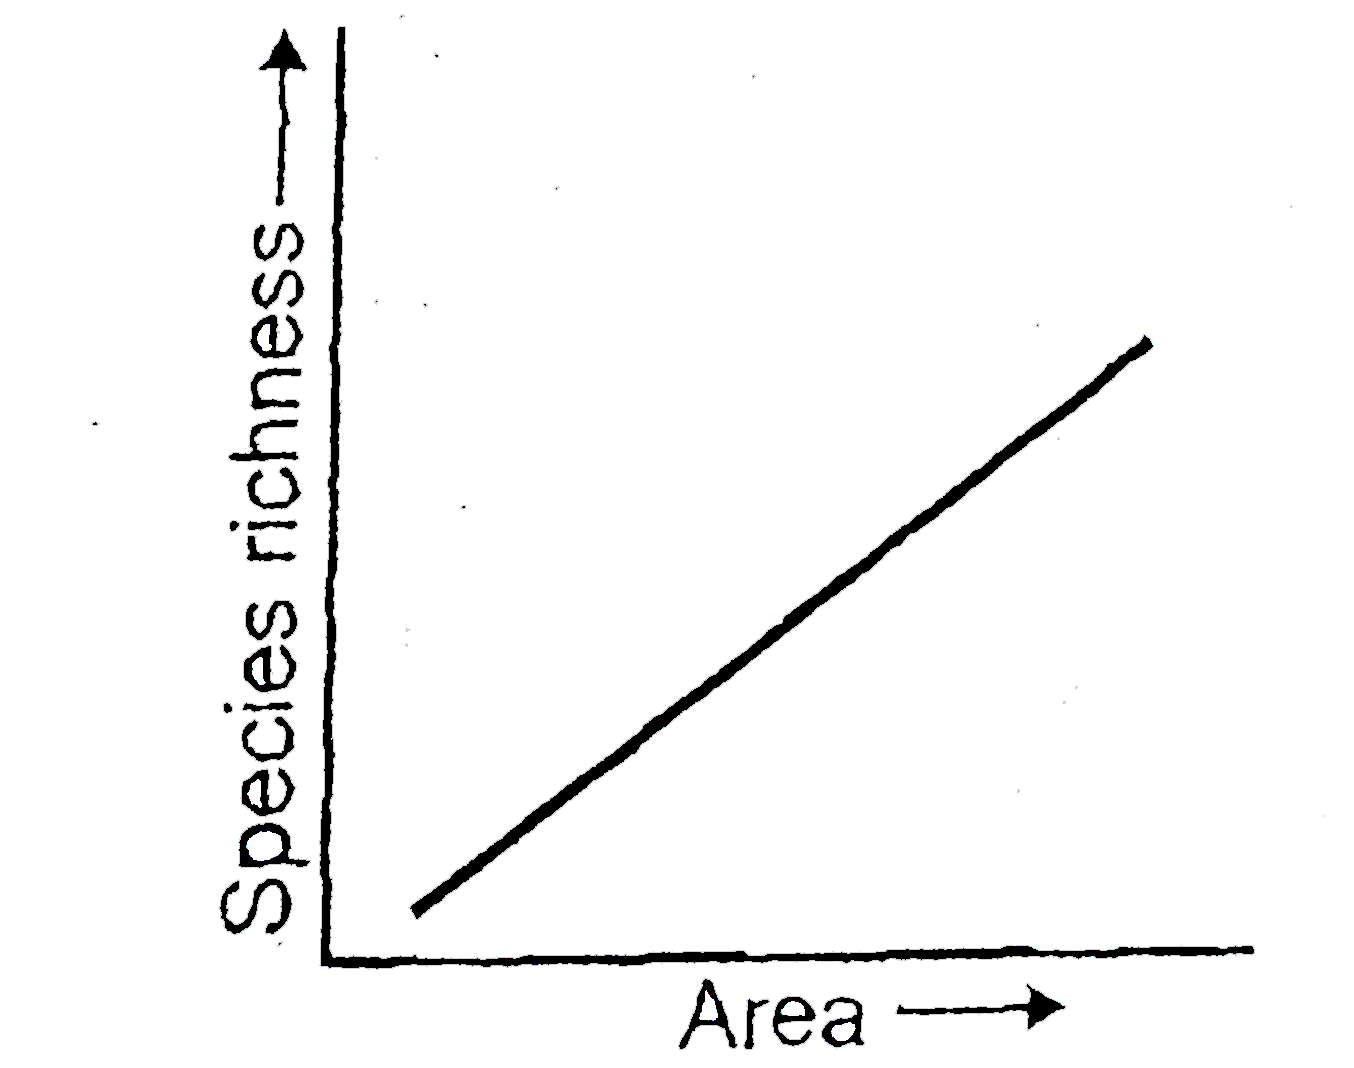
Relationship between species richness (S) and area (A) represent in the following graph is described by the equation

log S = log A + Z log C
log S = log C + Z log A
log C = log A + S log A
log C = log S + Z log A
The correct Answer is:B
Step by step video & image solution for Relationship between species richness (S) and area (A) represent in the following graph is described by the equation by Biology experts to help you in doubts & scoring excellent marks in Class 12 exams.
Updated on:21/07/2023Topper's Solved these Questions
- BIODIVERSITY AND CONSERVATIONBOOK - AAKASH INSTITUTECHAPTER - BIODIVERSITY AND CONSERVATIONEXERCISE - SECTION - B (Objective Type Questions)
34 Videos
- BIODIVERSITY AND CONSERVATIONBOOK - AAKASH INSTITUTECHAPTER - BIODIVERSITY AND CONSERVATIONEXERCISE - SECTION - C (Previous Years Questions)
64 Videos
- BIODIVERSITY AND CONSERVATIONBOOK - AAKASH INSTITUTECHAPTER - BIODIVERSITY AND CONSERVATIONEXERCISE - EXERCISE
20 Videos
- ANIMAL KINGDOM (GENERAL ACCOUNTS & NON-CHORDATES)BOOK - AAKASH INSTITUTECHAPTER - ANIMAL KINGDOM (GENERAL ACCOUNTS & NON-CHORDATES)EXERCISE - Assignment (Section-D)
10 Videos
- BIOLOGICAL CLASSIFICATIONBOOK - AAKASH INSTITUTECHAPTER - BIOLOGICAL CLASSIFICATIONEXERCISE - Assignment (Section-D) Assertion - Reason Type Questions
15 Videos
Similar Questions

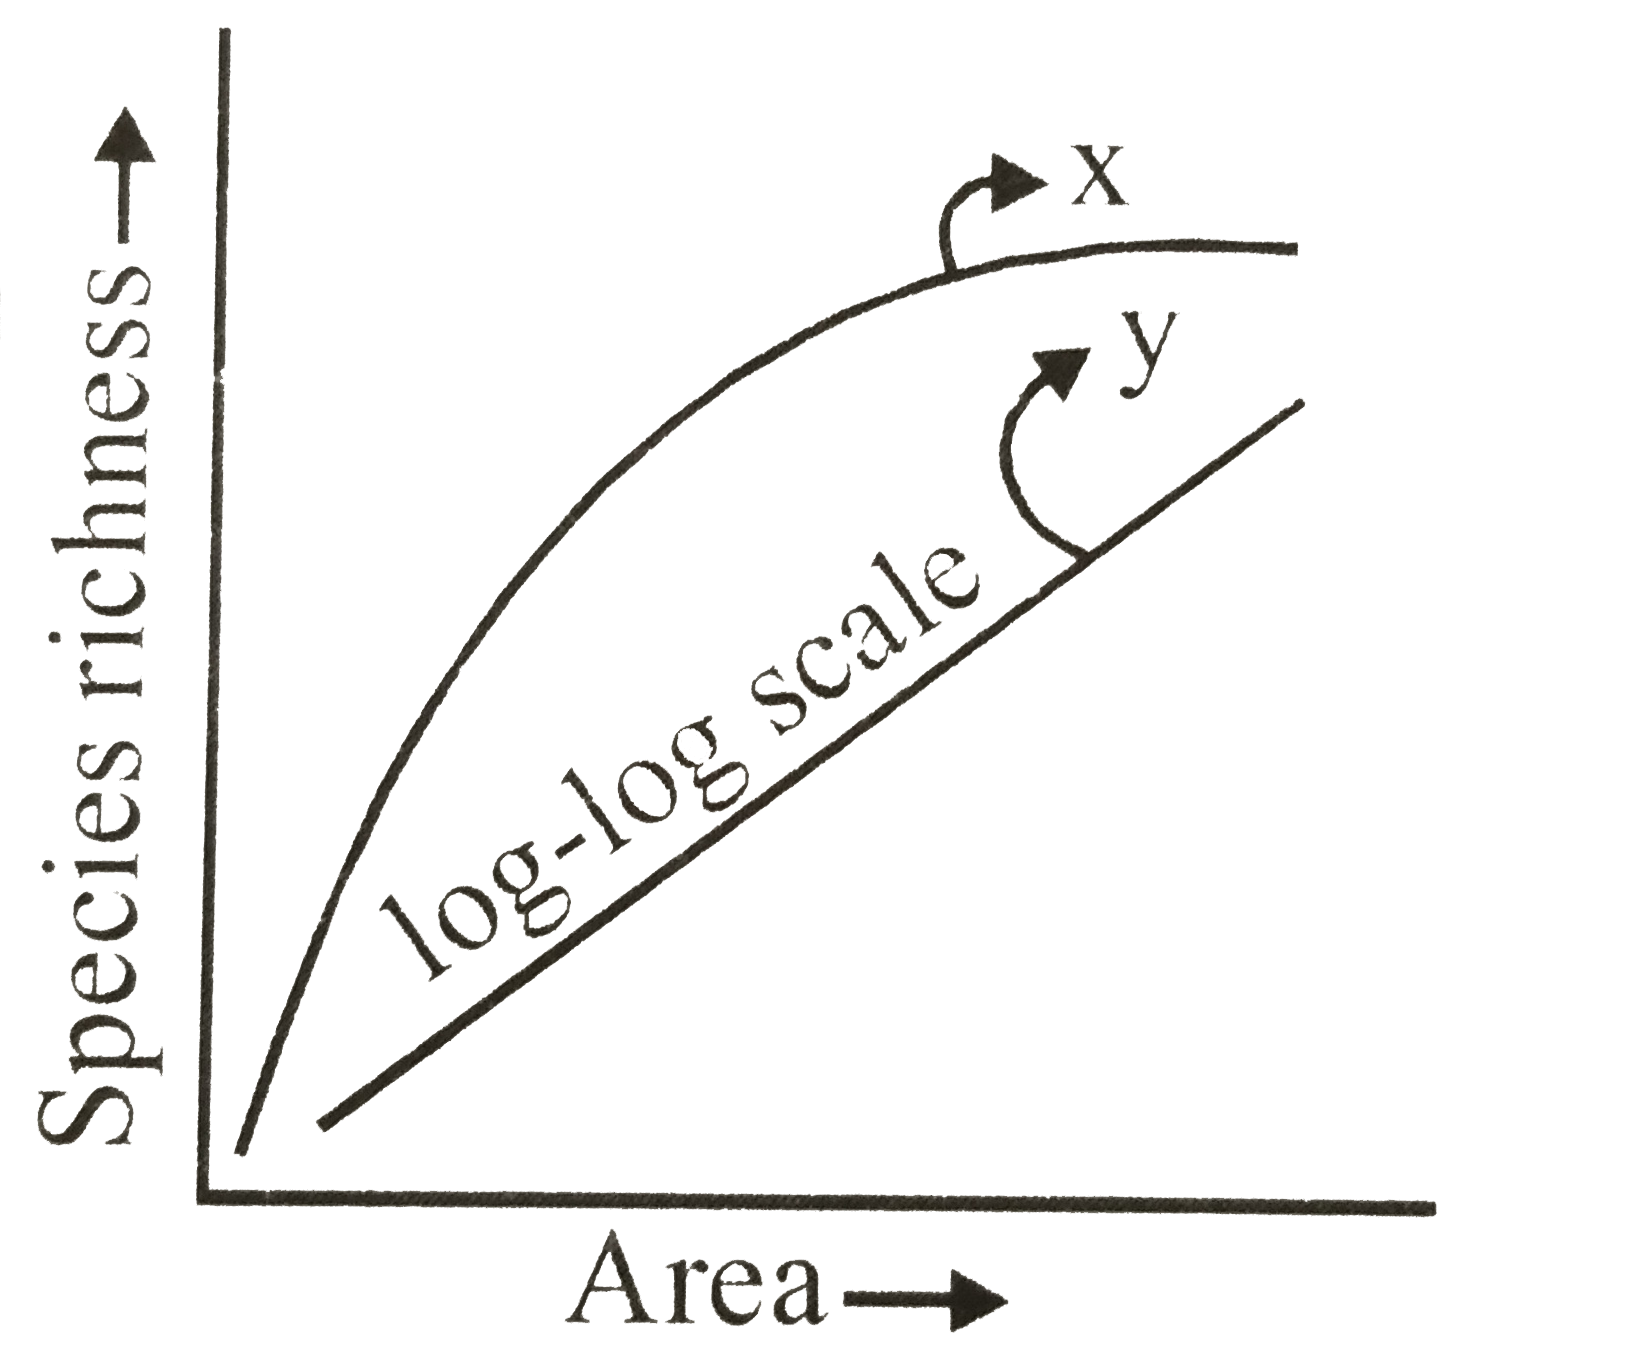
Study the above graph and answer the following questions -
(i) Identify x and y
(ii) The relation between species richness and area can be denoted as generally
(iii) The value of z lies in range of
(iv) On a log scale the relation between species richness and area is
View SolutionThe relation between species richness and area for a wide variety of taxa turns out to be a rectangular hyperbola. Give a brief explanation.
View Solution
Knowledge Check
The relation between species richness and area is correctly depicted by
ALogS=logC−ZlogABLogS=ZlogACLogS=logC+ZlogADLogS=logCThe relation between specises richness and area is described on a logarithmic scale by the equation [where S = species richness, A = area, Z = slope of the line (regression coefficient ), C= Y - intercept]
Alog S = log CBlog S = Z log AClogS=logC−ZlogADlogS=logC+ZlogAAlexander von Humboldt gave the relationship between the species richness and its geographical area . Which of the following is the correct logarithmic equation for his findings ?
Alog C = log Z + S log ABlog C = log C + A log ZClog S = log C + Z log ADlog Z = log C + S log A
The relation between specles richness and area Is described on a logarithmic scale by the equaton (where 8 - specles richness, A= area, Z = slope of the line (regression co-efficient), C=Y-Intercept].
View SolutionWhich of the following graph represents 3s orbital
View SolutionThe graph between stress and strain represents the
View SolutionWhich of the statement are in accordance with the observation of geographer Alexander von Humboldt ?
I. Within a region species, richness increases with increasing explored area but within a limit.
II. The relation between species richness and area is a rectangular hyperbole.
III. The richness of species decreases with the increasing explored area.
IV. There is no relation between the explored area and species richness .
View SolutionThe relation between species richness and area for a wide variety of taxa (angiosperm plants, birds, bats, freshwater fishes) is a
View Solution
